. 2023 Feb;17(1):63-76.
doi: 10.1007/s12072-022-10445-1. Epub 2022 Nov 22.

The clinical implications and molecular features of intrahepatic cholangiocarcinoma with perineural invasion

Affiliations

The clinical implications and molecular features of intrahepatic cholangiocarcinoma with perineural invasion

Xian-Long Meng et al. Hepatol Int. 2023 Feb.

Abstract

Background: Perineural invasion (PNI) is associated with metastasis in malignancies, including intrahepatic cholangiocarcinoma (ICC), and is correlated with poor prognosis.

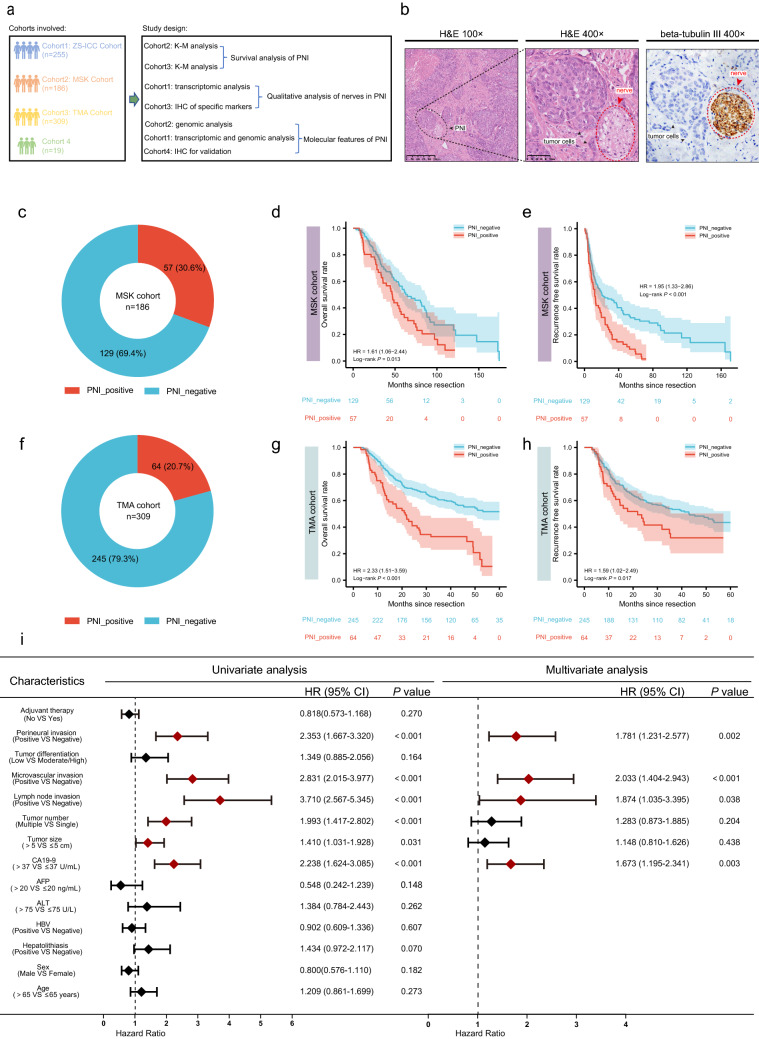
Methods: The study included three large cohorts: ZS-ICC and TMA cohorts from our team, MSK cohort from a public database, and a small cohort named cohort 4. Prognostic implications of PNI were investigated in MSK cohort and TMA cohort. PNI-related genomic and transcriptomic profiles were analyzed in MSK and ZS-ICC cohorts. GO, KEGG, and ssGSEA analyses were performed. Immunohistochemistry was used to investigate the relationship between PNI and markers of neurons, hydrolases, and immune cells. The efficacy of adjuvant therapy in ICC patients with PNI was also assessed.

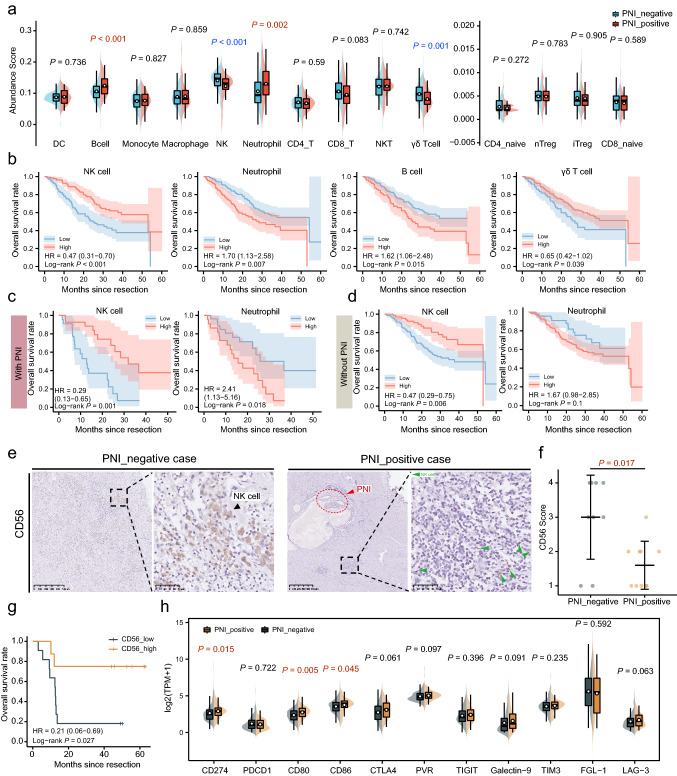
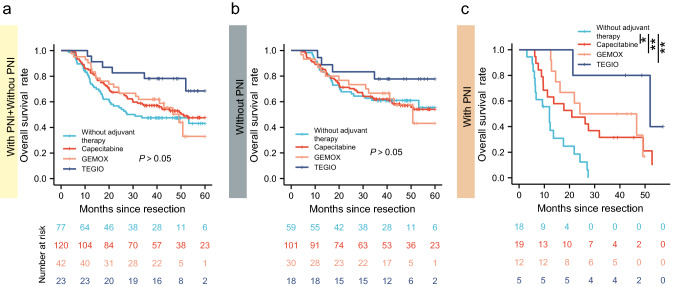
Results: A total of 30.6% and 20.7% ICC patients had PNI in MSK and TMA cohorts respectively. Patients with PNI presented with malignant phenotypes such as high CA19-9, the large bile duct type, lymph node invasion, and shortened overall survival (OS) and relapse-free survival (RFS). Nerves involved in PNI positively express tyrosine hydroxylase (TH), a marker of sympathetic nerves. Patients with PNI showed high mutation frequency of KRAS and an immune suppressive metastasis prone niche of decreased NK cell, increased neutrophil, and elevated PD-L1, CD80, and CD86 expression. Patients with PNI had an extended OS after adjuvant therapy with TEGIO, GEMOX, or capecitabine.

Conclusion: Our study deciphered the genomic features and the immune suppressive metastasis-prone niche in ICC with PNI. Patients with PNI showed a poor prognosis after surgery but a good response to adjuvant chemotherapy.

Keywords: Adjuvant therapy; Bioinformatics; Intrahepatic cholangiocarcinoma; KRAS; Metastasis prone niche; Overall survival; Pathology feature; Perineural invasion; Relapse-free survival; Sympathetic nerve.


Conflict of interest statement

Xian-Long Meng, Jia-Cheng Lu, Hai-Ying Zeng, Zhen Chen, Xiao-Jun Guo, Chao Gao, Yan-Zi Pei, Shu-Yang Hu, Mu Ye, Qi-Man Sun, Guo-Huang Yang, Jia-Bin Cai, Pei-Xin Huang, Lei Yv, Lv Zhang, Ying-Hong Shi, Ai-Wu Ke, Jian Zhou, Jia Fan, Yi Chen, Xiao-Yong Huang, Guo-Ming Shi have declared that no competing interest exists.

Figures

Fig. 1
Fig. 1
PNI is an unfavorable prognostic factor for patients with ICC post-operation. (a) Cohorts involved and study design of this article: ZS-ICC cohort (n = 255), cohort 4 and TMA cohort (n=309) are from Zhongshan hospital, Shanghai, China; MSK cohort is from a public database. (b) Representative images of H&E staining and beta-tubulin III staining of PNI in TMA cohort.(c) Fan chart of the components of MSK cohort: PNI positive cases accounted for 30.6% (n=57) of MSK cohort. (d) K–M analysis of OS between patients with and without PNI in MSK cohort (HR = 1.61, 1.06–2.44, P = 0.013). (e) K–M analysis of RFS between patients with and without PNI in MSK cohort (HR = 1.95, 1.33–2.86, P < 0.001). (f) Fan chart of the components of the TMA cohort: PNI positivity accounted for 20.7% (n = 64) of TMA cohort. (g) K–M analysis of OS between patients with and without PNI in TMA cohort (HR = 2.33, 1.51–3.59, P < 0.001).(h) K–M analysis of RFS between patients with and without PNI in TMA cohort (HR = 1.59, 1.02–2.49, P = 0.017). (i) Forest illustration of univariate and multivariate analyses of OS in TMA cohort (HBV: hepatitis B virus; ALT: alanine aminotransferase; AFP: alpha fetoprotein; CA19-9: carbohydrate antigen199; HR: hazard ratio; CI:confidence interval)
Fig. 2
Fig. 2
PNI derived from sympathetic nerves in ICC. (a) Graphical exhibition of the interactions between automatic nerves and tumor. (b) Dot plot of PGP9.5 (P = 0.292), TUBB3 (P = 0.656), and SYN (P = 0.612) of ZS-ICC cohort; Unpaired t-test was used. (c) Dot plot of mRNA expression of VACHT (P = 0.266) and TH ( = 0.005) in ZS-ICC cohort; Unpaired t-test was used. (d) Representative IHC image of TH positive nerves involved in patients with PNI in TMA cohort. (e) Bar plot of ADRs mRNA expression between patients with and without PNI in ZS-ICC cohort; Unpaired t-test was used. (f) Representative images of IHC staining of MAO-A in TMA cohort. (g) Comparison of MAO-A expression between patients with and without PNI in TMA cohort: picture on the left is the violin plot of the MAO-A IHC score between PNI positive and PNI negative patients, and unpaired t-test was used to compare the differences (P = 0.0005); picture on the right is the bar plot of the proportion of different levels of MAO-A in PNI positive cases and PNI negative cases, and chi-square test was used (P = 0.001). (h) K–M analysis of OS between patients with high and low MAO-A expression in TMA cohort (HR = 0.61, 0.44–0.84, P = 0.002). (i) K–M analysis of RFS between MAO-A high and low expression patients in the TMA cohort (HR = 0.72, 0.52–1.01, P = 0.05)
Fig. 3
Fig. 3
ICC patients with PNI were characterized by immune suppressive metastasis niche. (a) ssGSEA analysis of infiltrating immune cells of ZS-ICC cohort and unpaired t-test was used. (b) K–M analysis of OS among patients with different immune cell abundance score in ZS-ICC cohort. (c) K–M analysis of OS among PNI-positive patients with different infiltration of NK cells and neutrophils in ZS-ICC cohort. (d) K–M analysis of OS among PNI-negative patients with different infiltration of NK cells and neutrophils in ZSICC cohort. (e) Representative image of the CD56 IHC staining among ICC patients from cohort 4. (f) Comparison of CD56 expression score between PNI positive and PNI negative patients of cohort 4 (P = 0.017).Wilcoxon-test was used. (g) K–M analysis of OS between patients with high infiltration and low infiltration of CD56 positive NK cells in cohort 4. (CD56_low: IHC Score 1–2; CD56_high: IHC Score 3–4; HR = 0.21; P = 0.027). (h) The mRNA expression of immune checkpoints and relative ligands between patients with and without PNI in ZS-ICC cohort. Unpaired t-test was used
Fig. 4
Fig. 4
ICC patients with PNI exhibited higher frequency of KRAS mutations. (a) Bar plot of different mutation frequency genes in MSK and ZS-ICC cohorts (ns: P > 0.05; *: P < 0.05; **: P < 0.01). Chi-square test was used. (b) K–M analysis of OS between patients with and without KRAS mutations in MSK cohort (HR = 3.39, P < 0.001). (c) K–M analysis of OS between patients with and without KRAS mutations in ZS-ICC cohort (HR = 2.36, P < 0.001)
Fig. 5
Fig. 5
ICC patients with PNI well responded to adjuvant therapy. (a) K–M analysis of OS between patients with and without different adjuvant therapies in TMA cohort (log-rank P. adj > 0.05). (b) K–M analysis of OS between PNI-negative patients with different adjuvant therapies and without adjuvant therapy in TMA cohort (log-rank P. adj > 0.05). (c) K–M analysis of OS between PNI-positive patients with different adjuvant therapies and without adjuvant therapy in the TMA cohort (TEGIO vs. without adjuvant therapy: P. adj = 0.008; GEMOX vs. without adjuvant therapy: P. adj = 0.005; capecitabine vs. without adjuvant therapy: P. adj = 0.037; ns: P > 0.05; *: P < 0.05; **: P < 0.01). (d) K–M analysis of RFS between patients with and without different adjuvant therapies in TMA cohort (log-rank P. adj > 0.05). (e) K–M analysis of RFS between PNI-negative patients with different adjuvant therapies and without adjuvant therapy in TMA cohort (log-rank P. adj > 0.05). (f) K–M analysis of RFS between PNI-positive patients with different adjuvant therapies and without adjuvant therapy in the TMA cohrt (log-rank P. adj>0.05)

References

    1. Massarweh NN, El-Serag HB. Epidemiology of hepatocellular carcinoma and intrahepatic cholangiocarcinoma. Cancer Control. 2017;24(3):1073274817729245. - PMC - PubMed
    1. Fu J, Li Y, Li Z, Li N. Clinical utility of decarboxylation prothrombin combined with α-fetoprotein for diagnosing primary hepatocellular carcinoma. Biosci Rep. 2018;38(5):BSR20180044. - PMC - PubMed
    1. Demir IE, Ceyhan OG, Liebl F, et al. Neural invasion in pancreatic cancer: the past, present and future. Cancers (Basel) 2010;2(3):1513–1527. - PMC - PubMed
    1. Demir IE, Friess H, Ceyhan GO. Neural plasticity in pancreatitis and pancreatic cancer. Nat Rev Gastroenterol Hepatol. 2015;12(11):649–659. - PubMed
    1. Stopczynski RE, Normolle DP, Hartman DP, et al. Neuroplastic changes occur early in the development of pancreatic ductal adenocarcinoma. Cancer Res. 2014;74(6):1718–1727. - PMC - PubMed