. 2022 Nov 23;12(1):20169.
doi: 10.1038/s41598-022-24245-y.

Acute gut inflammation reduces neural activity and spine maturity in hippocampus but not basolateral amygdala

Affiliations

Acute gut inflammation reduces neural activity and spine maturity in hippocampus but not basolateral amygdala

Chelsea E Matisz et al. Sci Rep. .

Abstract

Gastrointestinal tract (gut) inflammation increases stress and threat-coping behaviors, which are associated with altered activity in fear-related neural circuits, such as the basolateral amygdala and hippocampus. It remains to be determined whether inflammation from the gut affects neural activity by altering dendritic spines. We hypothesized that acute inflammation alters dendritic spines in a brain region-specific manner. Here we show that acute gut inflammation (colitis) evoked by dextran sodium sulfate (DSS) did not affect the overall spine density in the CA1 region of hippocampus, but increased the relative proportion of immature spines to mature spines on basal dendrites of pyramidal neurons. In contrast, in animals with colitis, no changes in spine density or composition on dendrites of pyramidal cells was observed in the basolateral amygdala. Rather, we observed decreased spine density on dendrites of stellate neurons, but not the relative proportions of mature vs immature spines. We used cFos expression evoked by the forced swim task as a measure of neural activity during stress and found no effect of DSS on the density of cFos immunoreactive neurons in basolateral amygdala. In contrast, fewer CA1 neurons expressed cFos in mice with colitis, relative to controls. Furthermore, CA1 cFos expression negatively correlated with active stress-coping in the swim task and was negatively correlated with gut inflammation. These data reveal that the effects of acute gut inflammation on synaptic remodeling depend on brain region, neuronal phenotype, and dendrite location. In the hippocampus, a shift to immature spines and hypoactivity are more strongly related to colitis-evoked behavioral changes than is remodeling in basolateral amygdala.


Conflict of interest statement

The authors declare no competing interests.

Figures

Figure 1
Figure 1
Exposure to DSS promotes colon shortening, weight loss, and macroscopic damage in the colon, which is negatively correlated with reduced immobility time in the forced swim task. (a) Macroscopic damage score; Kruskal Wallis, Dunn’s post-test *p < 0.05 relative to control. Data shown are median ± 95% CI. (b) Colon length; One Way ANOVA, Dunnett’s post-test, *p < 0.05 relative to control. Data shown are mean ± SEM. (c) Change in body weight over course of DSS exposure; two-way ANOVA, Tukey’s post-test; *p < 0.05 versus control, #p < 0.05 versus 2%DSS treatment. Data shown are mean ± SEM. (d) Total immobility time in the forced swim task; One-way ANOVA, p = 0.0627. Data shown are mean ± SEM. (e) Immobility time as a function of macroscopic damage score; linear regression. N = 8 per group.
Figure 2
Figure 2
Spine density and composition on basal and apical dendrites of CA1 neurons in the hippocampus. (a) Photomicrograph of Golgi labeled cells of CA1 region in the mouse hippocampus (scale bar: 200 µm). (b) Larger view of panel a (scale bar: 200 μm). (c) Representative image of CA1 neuron (scale bar: 25 µm). (d) Representative examples of spine morphologies in CA1 (scale bar: 1 µm). (e) Density of spines on apical dendrites in CA1; data shown are mean ± SEM. Proportion of immature spines (f) and head spines (g) on apical dendrites in the CA1; data shown are median ± 95% CI. (h) Density of spines on basal dendrites in CA1; data shown are mean ± SEM. Proportion of immature spines (i) and head spines (j) on basal dendrites in the CA1; data shown are median ± 95% CI. Density data analyzed by One-way ANOVA. Composition data analyzed by Kruskal Wallis with Dunn’s post-test to negative control; *p < 0.05. n = 20–24 dendrites, from 6 neurons, from 6 animals per group.
Figure 3
Figure 3
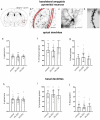
Spine density and composition on basal and apical dendrites of pyramidal cells in the basolateral amygdala. (a) Region of interest illustrated on a standard mouse brain atlas, (b) Photomicrograph of Golgi labeled cells in basolateral amygdala (BLA) region in a mouse brain (scale bar: 200 µm). (c) Representative image of a BLA pyramidal neuron (scale bar: 25 µm) (d) Representative image of dendrite selected for spine counting (scale bar: 2 µm). (e) Density of spines on basal dendrites in BLA; data shown are mean ± SEM. Proportion of immature spines (f) and head spines (g) on basal dendrites in the BLA; data shown are median ± 95% CI. (h) Density of spines on apical dendrites in BLA, data shown are mean ± SEM. Proportion of immature spines (i) and head spines (j) on apical dendrites in the BLA; data shown are median ± 95% CI. Density data analyzed by One-way ANOVA with Dunnett’s post-test to negative control, data shown as mean ± SEM, *p < 0.05. Composition data analyzed by Kruskal–Wallis. n = 15–24 dendrites, from 12 to 19 neurons, from 5–6 animals per group.
Figure 4
Figure 4
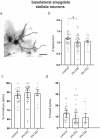
Spine density and composition of stellate neurons in the basolateral amygdala. (a) Representative image of a stellate neuron; scale bar 25um. (b) Density of spines on dendrites in BLA; data shown are mean ± SEM. Proportion of immature spines (c) and head spines (d) on dendrites in the BLA; data shown are median ± 95% CI. Density data analyzed by One-way ANOVA with Dunnett’s post-test to negative control, data shown as mean ± SEM, *p < 0.05. Composition data analyzed by Kruskal–Wallis. n = 24–40 dendrites, from 12 to 19 neurons, from 6 animals per group.
Figure 5
Figure 5
cFos expression in the CA1 hippocampus and the basolateral amygdala. (a) Representative image of cFos expression of control and DSS-treated animals in the CA1 of the hippocampus. DAPI in blue, cFos in red. Scale bar 100 µm. (b) Density of cFos+ cells in the CA1 of the hippocampus; student’s t-test; *p < 0.05. (c) Linear regression between cFos density in the CA1 and macroscopic damage score. (d) Linear regression between cFos expression in the CA1 and immobility time. (e) Representative image of cFos expression of control and DSS-treated animals in the BLA. DAPI in blue, cFos in red. Scale bar 100 µm. (f) Density of cFos+ cells in the BLA. (g) Linear regression between cFos density in the BLA and macroscopic damage score. (h) Linear regression between cFos density in the BLA and immobility time Data are mean ± SEM Control (n = 4) and 2.5% DSS (n = 8).

References

    1. Neuendorf R, Harding A, Stello N, Hanes D, Wahbeh H. Depression and anxiety in patients with inflammatory bowel disease: A systematic review. J. Psychosom. Res. 2016;87:70–80. - PubMed
    1. Barberio B, Zamani M, Black CJ, Savarino EV, Ford AC. Prevalence of symptoms of anxiety and depression in patients with inflammatory bowel disease: A systematic review and meta-analysis. Lancet Gastroenterol. Hepatol. 2021;6:359–370. - PubMed
    1. Marrie RA, Graff LA, Fisk JD, Patten SB, Bernstein CN. The relationship between symptoms of depression and anxiety and disease activity in IBD over time. Inflamm. Bowel Dis. 2021;27:1285–1293. - PMC - PubMed
    1. Matisz C, Gruber A. Neuroinflammatory remodeling of the anterior cingulate cortex as a key driver of mood disorders in gastrointestinal disease and disorders. Neurosci. Biobehav. Rev. 2021 doi: 10.20944/preprints202009.0593.v1. - DOI - PubMed
    1. Gruber AJ, McDonald RJ. Context, emotion, and the strategic pursuit of goals: Interactions among multiple brain systems controlling motivated behavior. Front. Behav. Neurosci. 2012;6:50. - PMC - PubMed

Publication types