. 2022 Nov 22;12(1):20083.
doi: 10.1038/s41598-022-24589-5.

Drivers and potential distribution of anthrax occurrence and incidence at national and sub-county levels across Kenya from 2006 to 2020 using INLA

Affiliations

Drivers and potential distribution of anthrax occurrence and incidence at national and sub-county levels across Kenya from 2006 to 2020 using INLA

Valentina A Ndolo et al. Sci Rep. .

Abstract

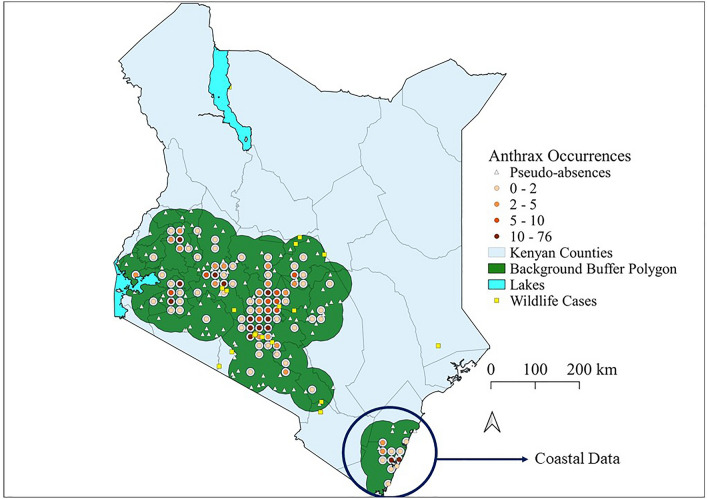
Anthrax is caused by, Bacillus anthracis, a soil-borne bacterium that infects grazing animals. Kenya reported a sharp increase in livestock anthrax cases from 2005, with only 12% of the sub-counties (decentralised administrative units used by Kenyan county governments to facilitate service provision) accounting for almost a third of the livestock cases. Recent studies of the spatial extent of B. anthracis suitability across Kenya have used approaches that cannot capture the underlying spatial and temporal dependencies in the surveillance data. To address these limitations, we apply the first Bayesian approach using R-INLA to analyse a long-term dataset of livestock anthrax case data, collected from 2006 to 2020 in Kenya. We develop a spatial and a spatiotemporal model to investigate the distribution and socio-economic drivers of anthrax occurrence and incidence at the national and sub-county level. The spatial model was robust to geographically based cross validation and had a sensitivity of 75% (95% CI 65-75) against withheld data. Alarmingly, the spatial model predicted high intensity of anthrax across the Northern counties (Turkana, Samburu, and Marsabit) comprising pastoralists who are often economically and politically marginalized, and highly predisposed to a greater risk of anthrax. The spatiotemporal model showed a positive link between livestock anthrax risk and the total human population and the number of exotic dairy cattle, and a negative association with the human population density, livestock producing households, and agricultural land area. Public health programs aimed at reducing human-animal contact, improving access to healthcare, and increasing anthrax awareness, should prioritize these endemic regions.


Conflict of interest statement

The authors declare no competing interests.

Figures

Figure 1
Figure 1
Results of correlation between covariates using Pearson’s correlation coefficient test for the spatial model. Correlation between covariates is shown by red numbers (negative correlation) and blue numbers (positive correlation). Correlations with a p-value > 0.01 are regarded as insignificant and the correlation coefficient values are left blank. The figure was generated using R software v. 4.1.0.
Figure 2
Figure 2
Results of correlation between covariates using Pearson’s correlation coefficient test for the spatiotemporal model. Correlation between covariates is shown by red numbers (negative correlation) and blue numbers (positive correlation). Correlations with a p-value > 0.01 are regarded as insignificant and the correlation coefficient values are left blank. The figure was generated using R software v. 4.1.0.
Figure 3
Figure 3
Spatial distribution of thinned livestock anthrax case locations across Kenya from 2006 to 2020. The map shows livestock anthrax case locations (n = 540) thinned to pixels of 20 km2 to form 95 new marked locations. The orange dots show the new presence locations which are marked points with colour intensity representing the number of livestock cases per location. The white triangles show the random pseudo-absence locations. The yellow squares are the wildlife cases obtained from the Kenya Wildlife Service. The green polygon is the background calibration buffer used to derive the random pseudo-absence locations. This map was generated using Quantum Geographical Information Systems (QGIS) v. 3.16.11 (https://www.qgis.org/en/site/forusers/download.html).
Figure 4
Figure 4
Geographical cross-validation tests for spatial model robustness. The figure shows the magnitude and direction of the fixed effects for the final model and the holdout model to test whether the model was robust following the exclusion of a spatially distinct block of data.
Figure 5
Figure 5
Smoothed fits for Enhanced Vegetation Index (EVI) (units) and elevation (m). The solid black line shows the posterior mean of the smoothing function, and the shaded grey areas represent the 95% credible intervals. The y-axis shows the estimated incidence of anthrax. The figure was generated using R software v. 4.1.0.
Figure 6
Figure 6
The posterior predicted mean of the incidence of anthrax disease across Kenya from livestock data (2006–2020). The scale for anthrax incidence shows colours ranging from blue to red, with blue showing areas with low incidence and warmer colours towards red showing areas with higher anthrax incidence. This map was generated using Quantum Geographical Information Systems (QGIS) v. 3.16.11 (https://www.qgis.org/en/site/forusers/download.html).
Figure 7
Figure 7
The uncertainty around the slope of the posterior predicted incidence of anthrax disease across Kenya. The grey areas show locations where greater than 5 percent (a) and 10 percent (b) of the slope of predicted incidence was below the cut-off (0.205) for positivity. We extracted the fitted density distributions of the predicted anthrax incidence and calculated the percentage/proportion of the density distribution that was lower than the positivity cut-off, then greyed out areas that had more than 5% (a) or 10% (b) of the fitted density below the cut-off. The scale for anthrax incidence shows colours ranging from blue to red, with blue showing areas with low incidence and warmer colours towards red showing areas with higher anthrax incidence. Maps generated using Quantum Geographical Information Systems (QGIS) v. 3.16.11 (https://www.qgis.org/en/site/forusers/download.html).
Figure 8
Figure 8
Temporal trends in country-wide livestock anthrax cases from 2006 to 2020. The polygon height illustrates the monthly total livestock cases reported across Kenya. The full anthrax case time series was assembled from the Kenya Directorate of Veterinary Services: Monthly case reports from 2006 to 2020. Full details of reporting procedures and case definitions are provided in Methods. The figure was generated using R software v. 4.1.0.
Figure 9
Figure 9
Spatiotemporal trends in confirmed livestock anthrax cases across Kenya. Maps illustrate the total reported livestock anthrax cases in each sub-county from 2009 to 2020. Map generated using Quantum Geographical Information Systems (QGIS) v. 3.16.11 (https://www.qgis.org/en/site/forusers/download.html).
Figure 10
Figure 10
Geographical cross-validation tests for model robustness. The figures show the magnitude and direction of the fixed effect across all the holdout models to test whether the findings were overly influenced by data from any geographical location. The figure was generated using R software v. 4.1.0.
Figure 11
Figure 11
Spatial distribution and correlates of annual anthrax occurrence and incidence (2006–2020) at sub-county level across Kenya. Maps show the fitted probability of anthrax occurrence (a) and incidence (b; livestock cases per 100,000 people) for 290 sub-counties in the last quarter of 2020. The points and error bars (c) illustrate the parameter estimates of the linear socio-economic fixed-effects (the posterior mean estimate and the 95% credible interval) for the best-fitting models of anthrax occurrence (red) and incidence (blue) (n = 17,400 observations). The linear covariates were standardized (centered and scaled) before model fitting, such that parameters estimate the effect of 1 standard deviation change in the covariate on either the odds of occurrence or incidence. The models both included spatiotemporal random effects (sub-county per year) to incorporate spatial and temporal heterogeneity and were robust to geographical cross-validation tests (Fig. 10). Maps were generated using Quantum Geographical Information Systems (QGIS) v. 3.16.11 (https://www.qgis.org/en/site/forusers/download.html).
Figure 12
Figure 12
The posterior mean of the spatial random effects. The maps show the posterior mean of the spatial random effects for the occurrence (a) and incidence (b) models. Maps were generated using Quantum Geographical Information Systems (QGIS) v. 3.16.11 (https://www.qgis.org/en/site/forusers/download.html).
Figure 13
Figure 13
Random walk trend for the occurrence (a) and incidence (b) models. The lower panels show the marginal posterior distribution for the standard deviation (σ) hyperparameter of the random walk trend for the occurrence model (c) and the incidence model (d). The image was derived from the results of the R-INLA package implemented via R v. 4.1.0.

Similar articles

Cited by

References

    1. World Health Organization. Anthrax in Humans and Animals. (WHO Press, 2008). - PubMed
    1. Banerjee D, Chakraborty B, Chakraborty B. Anthrax: Where margins are merging between emerging threats and bioterrorism. Indian J. Dermatol. 2017;62:456–458. - PMC - PubMed
    1. Liskova EA, et al. Reindeer anthrax in the Russian arctic, 2016: Climatic determinants of the outbreak and vaccination effectiveness. Front. Vet. Sci. 2021;8:1–9. doi: 10.3389/fvets.2021.668420. - DOI - PMC - PubMed
    1. Hugh-Jones M, Blackburn J. The ecology of Bacillus anthracis. Mol. Aspects Med. 2009;30:356–367. doi: 10.1016/j.mam.2009.08.003. - DOI - PubMed
    1. Oyas H, et al. Recurrent anthrax outbreaks in humans, livestock, and wildlife in the same locality, Kenya, 2014–2017. Am. J. Trop. Med. Hyg. 2018;99:833–839. doi: 10.4269/ajtmh.18-0224. - DOI - PMC - PubMed

Publication types