Meta-Analysis
. 2022 Nov 23;23(1):245.
doi: 10.1186/s13059-022-02811-x.

The genetic and biochemical determinants of mRNA degradation rates in mammals

Affiliations
Meta-Analysis

The genetic and biochemical determinants of mRNA degradation rates in mammals

Vikram Agarwal et al. Genome Biol. .

Abstract

Background: Degradation rate is a fundamental aspect of mRNA metabolism, and the factors governing it remain poorly characterized. Understanding the genetic and biochemical determinants of mRNA half-life would enable more precise identification of variants that perturb gene expression through post-transcriptional gene regulatory mechanisms.

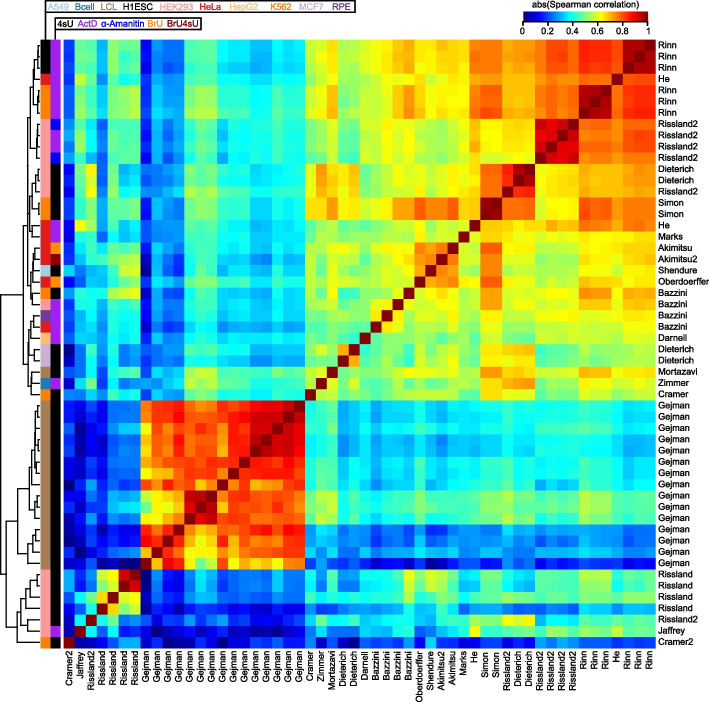
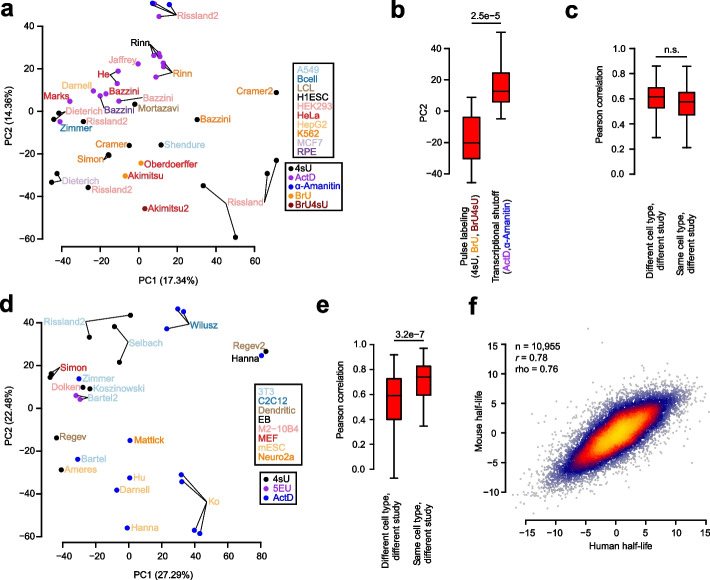
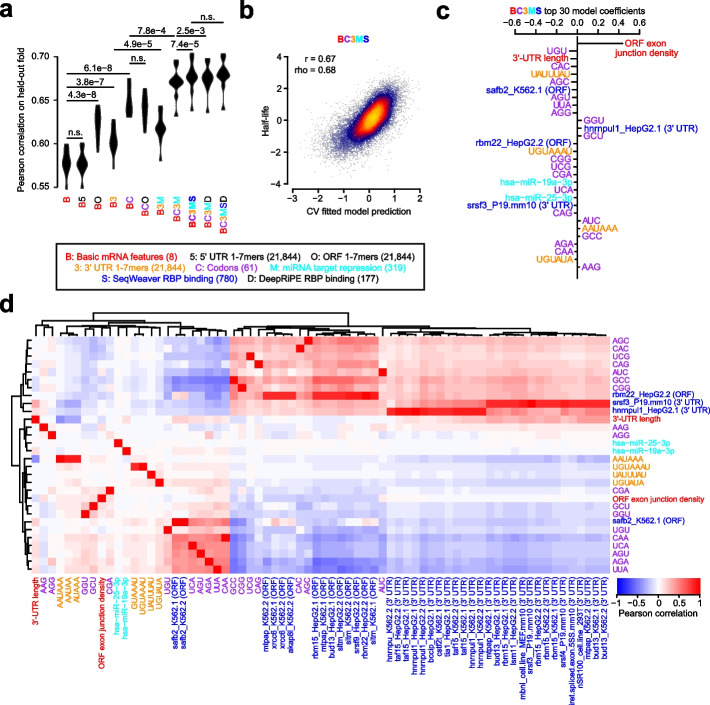
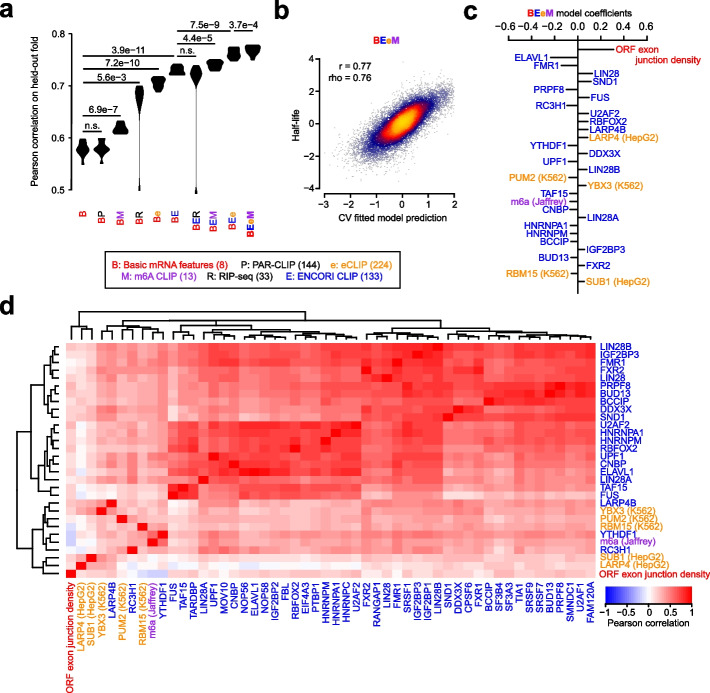
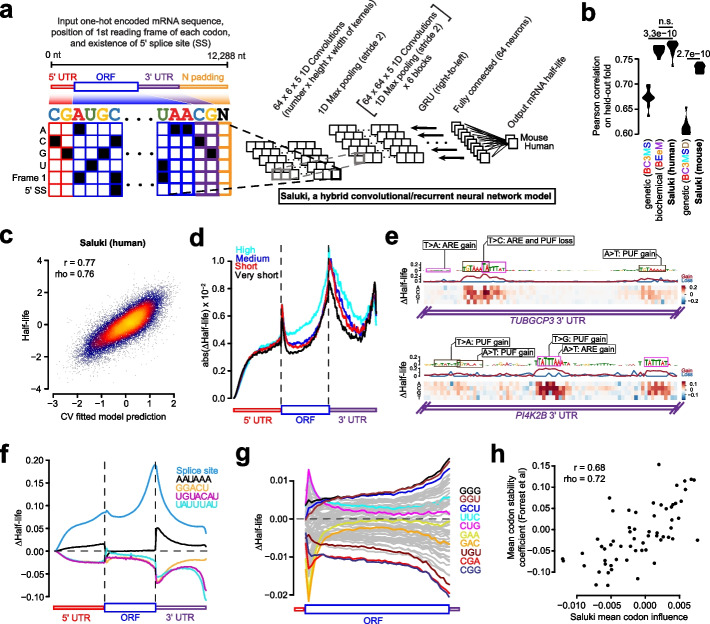
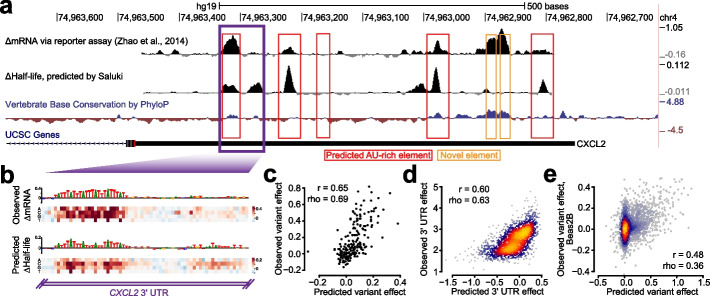
Results: We establish a compendium of 39 human and 27 mouse transcriptome-wide mRNA decay rate datasets. A meta-analysis of these data identified a prevalence of technical noise and measurement bias, induced partially by the underlying experimental strategy. Correcting for these biases allowed us to derive more precise, consensus measurements of half-life which exhibit enhanced consistency between species. We trained substantially improved statistical models based upon genetic and biochemical features to better predict half-life and characterize the factors molding it. Our state-of-the-art model, Saluki, is a hybrid convolutional and recurrent deep neural network which relies only upon an mRNA sequence annotated with coding frame and splice sites to predict half-life (r=0.77). The key novel principle learned by Saluki is that the spatial positioning of splice sites, codons, and RNA-binding motifs within an mRNA is strongly associated with mRNA half-life. Saluki predicts the impact of RNA sequences and genetic mutations therein on mRNA stability, in agreement with functional measurements derived from massively parallel reporter assays.

Conclusions: Our work produces a more robust ground truth for transcriptome-wide mRNA half-lives in mammalian cells. Using these revised measurements, we trained Saluki, a model that is over 50% more accurate in predicting half-life from sequence than existing models. Saluki succinctly captures many of the known determinants of mRNA half-life and can be rapidly deployed to predict the functional consequences of arbitrary mutations in the transcriptome.

Keywords: Deep neural networks; Post-transcriptional gene regulation; mRNA half-life; mRNA stability.


Conflict of interest statement

V.A. and D.R.K. are employees of Calico Life Sciences.

Figures

Fig. 1
Fig. 1
Comparison of half-lives in a compendium of human datasets. Heatmap of the absolute value of the Spearman correlations measured between half-lives derived from each pair of 54 human samples. Absolute values were used to accommodate five samples from four studies [29, 38, 42, 48] whose data were deposited as degradation rates rather than half-lives. Samples are clustered using hierarchical clustering according to the indicated dendrogram. Rows are labeled by the study of origin (Table 1) and colored by the cell type of origin and measurement approach
Fig. 2
Fig. 2
Assessment of measurement bias and cell-type specificity present in half-life data. a PCA of all human samples except those from an outlier study [46], with sample names colored according to cell type and corresponding data point colored according to measurement approach. Axes are labeled according to the percentage of variance among samples explained by the first two PCs. See also Additional file 1: Fig. S3 for the same analysis using all samples. b Boxplot of sample distributions along PC2, partitioned according to the measurement method (i.e. pulse labeling or transcriptional shutoff). Replicates for the same study were first averaged according to their PC2 value prior to assessing differences between the methods, with statistical differences between distributions evaluated using a two-sided Wilcoxon rank-sum test. c Evaluation of the Pearson correlations between pairs of half-life samples. Considered in this plot were the subset of pairs of two different studies that interrogated half-lives in either the same cell type or different cell types. Statistical differences between the distributions were evaluated using a one-sided Wilcoxon rank-sum test to assess whether correlations from the same cell type exceeded those from a different cell type. d, e These panels are the same as those in a and c, respectively, except compare mouse samples. f Comparison of consensus, cell-type agnostic (i.e., methodology and cell-type independent) measurements of human and mouse half-lives among one-to-one orthologous genes. Half-lives for each species were computed as PC1 of the respective gene × sample matrix. Also indicated are the Pearson (r) and Spearman (rho) correlation values as well as sample size (n) of genes considered. Shown in all boxplots are the median value (bar), 25th and 75th percentiles (box), and 1.5 times the interquartile range (whiskers)
Fig. 3
Fig. 3
Prediction of human half-lives using sequence-encoded features. a Performance of trained lasso regression models on each of 10 held-out folds of data. Compared is the relative performance between pairs of nested models which iteratively consider greater numbers of features. Each model is described by a code indicating the features considered. A description of the code is provided in the key, along with the corresponding number of features considered listed in parentheses. An improvement in a more complex model relative to a simpler model was evaluated with a one-sided, paired t-test, adjusted with a Bonferroni correction to account for the total number of hypothesis tests. Features which were ultimately determined to contribute to performance improvement are colored, or are left black if they did not improve the model. b Shown are the final predictions for the optimal model (i.e., BC3MS) after concatenating the observations for all 10 folds of held-out data. Also indicated are the Pearson (r) and Spearman (rho) correlation values. c The top 30 ranked model coefficients corresponding to the BC3MS model, trained on the full dataset. Features are colored according to the same key as that in panel a. d Pearson correlation matrix between the union of all top 30 features from c, shown as rows, and other features sharing a Pearson correlation either ≤ −0.8 or ≥ 0.8, shown as columns. Feature names are colored according to the origin of the feature as shown in the same key as panel a. Hierarchical clustering was used to group features exhibiting similar correlation patterns
Fig. 4
Fig. 4
Prediction of human half-lives using biochemical features. This figure is organized in the same fashion as Fig. 3, except it evaluates features derived from biochemical experiments. All CLIP data is computed as the number of peaks on the full-length transcript, while RIP-seq is represented as a continuous measurement of the enrichment of RBP binding relative to a control IP
Fig. 5
Fig. 5
State-of-the-art prediction of half-lives and genetic variant functional effects using a sequence-based deep learning model. a A hybrid convolutional/recurrent neural network architecture to predict half-life from an input of the RNA sequence, an encoding of the first frame of each codon, and 5′ splice site junction(s). The deep learning model, called Saluki, was jointly trained on mouse and human half-life data to predict species-specific half-lives. b Performance of the trained Saluki models on each of 10 held-out folds of data, relative to the corresponding performances from our best genetic (i.e., “BC3MS” for human and “BC3MSD” for mouse, respectively) and biochemical (i.e., “BEeM”) lasso regression models. An improvement relative to another model was evaluated with a two-sided, paired t-test. c Shown are the final predictions after concatenating the observations for all 10 folds of held-out data. Also indicated are the Pearson (r) and Spearman (rho) correlation values. d Metagene plot of ISM scores across all mRNAs for percentiles along the 5′ UTR, ORF, and 3′ UTR. mRNAs were grouped into one of 4 bins according to their predicted half-lives. For the set of mRNAs within each bin, we plotted the average of the absolute value of the mean predicted effect size (i.e., of the three possible alternative mutations). e ISM results of two 3′ UTR segments from TUBGCP3 and PI4K2B. Partial matches to the AU-rich element (ARE, or “UAUUUAU”) and Pumilio/FBF (PUF, or “UGUAHAUA”) binding element consensus sequences are boxed. For each motif, single point mutations resulting in particularly severe or opposite phenotypes are shown alongside annotations reflecting the corresponding ARE and PUF consensus gain or loss events. f Insertional analysis of motifs discovered by TF-MoDISco [84]. Each motif was inserted into one of 50 positional bins along the 5′ UTR, ORF, and 3′ UTR of each mRNA. Indicated is the average predicted change in half-life for each bin plotted along a metagene. g This panel is the same as panel f, except it performs analysis of 61 codons (excluding the 3 stop codons) inserted into the first reading frame along the length of the ORF. Selected codons are colored, with the rest shown in gray. h Scatter plot showing the relationship between the mean influence of each codon along the length of the ORF, as predicted by Saluki in panel g, and the mean codon stability coefficient over a set of cell types as observed previously [26]. Also indicated are the Pearson (r) and Spearman (rho) correlation values
Fig. 6
Fig. 6
Concordance of Saluki predictions and functional data from massively parallel reporter assays. a Effect of mutation on RNA stability, as measured by an MPRA [87], for tiles along the CXCL2 3′ UTR separated by 8-nt intervals. Also shown are variant effect predictions from Saluki (smoothed along a local 8-nt window) for the same region, and vertebrate base conservation as measured by PhyloP [90]. Predicted AREs are boxed in red, and novel elements detected by the MPRA are boxed in orange. b Saturation mutagenesis of a segment of the CXCL2 3′ UTR, boxed in purple in part a. Shown are the observed variant effects (top) and Saluki’s predicted variant effects (bottom). The reference sequence is shown for each, in which the nucleotide height is scaled according to the mean observed or predicted effect for that position. c Scatter plot of the observed and predicted variant effects shown in panel b. d Scatter plot of the observed and predicted 3′ UTR effects for each of 3000 conserved 3′ UTRs profiled by fastUTR [87]. e Scatter plot of the observed and predicted variant effects, as measured in Beas2B cells [88]. Also indicated are the Pearson (r) and Spearman (rho) correlation values for panels c–e

References

    1. Kelley DR, Reshef YA, Bileschi M, Belanger D, McLean CY, Snoek J. Sequential regulatory activity prediction across chromosomes with convolutional neural networks. Genome Res. 2018;28:739–750. - PMC - PubMed
    1. Agarwal V, Shendure J. Predicting mRNA abundance directly from genomic sequence using deep convolutional neural networks. Cell Rep. 2020;31:107663. - PubMed
    1. Zhou J, Theesfeld CL, Yao K, Chen KM, Wong AK, Troyanskaya OG. Deep learning sequence-based ab initio prediction of variant effects on expression and disease risk. Nat Genet. 2018;50:1171–1179. - PMC - PubMed
    1. Avsec Ž, Agarwal V, Visentin D, Ledsam JR, Grabska-Barwinska A, Taylor KR, et al. Effective gene expression prediction from sequence by integrating long-range interactions. Nat Methods. 2021;18:1196–1203. - PMC - PubMed
    1. Kelley DR. Cross-species regulatory sequence activity prediction. PLoS Comput Biol. 2020;16:e1008050. - PMC - PubMed

Publication types

LinkOut - more resources