. 2023 Mar;29(3):893-906.
doi: 10.1111/cns.14025. Epub 2022 Nov 23.

Neuroprotective effects of a lead compound from coral via modulation of the orphan nuclear receptor Nurr1

Affiliations

Neuroprotective effects of a lead compound from coral via modulation of the orphan nuclear receptor Nurr1

Jian-Wei Su et al. CNS Neurosci Ther. 2023 Mar.

Abstract

Aims: To screen coral-derived compounds with neuroprotective activity and clarify the potential mechanism of lead compounds.

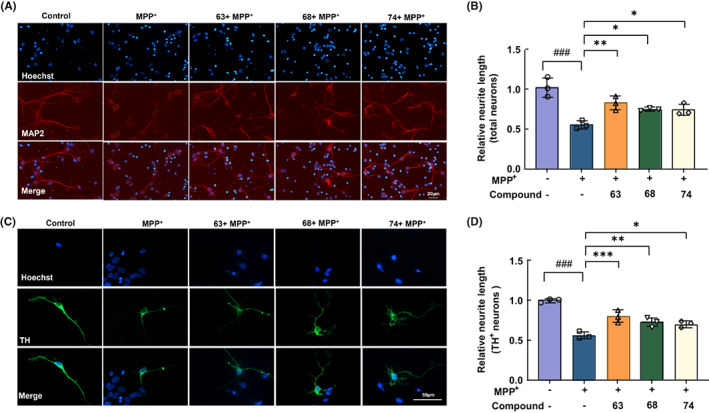
Methods: The lead compounds with neuroprotective effects were screened by H2 O2 and 1-methyl-4-phenyl-1,2,3,6-tetrahydropyridine (MPP+ )-induced cell damage models in SH-SY5Y cells. CCK8 and LDH assays were used to detect cell viability. The anti-apoptosis of lead compounds was evaluated by flow cytometry. JC-1 and MitoSox assays were performed to examine the changes in mitochondrial membrane potential and mitochondrial ROS level. Survival of primary cortical and dopaminergic midbrain neurons was measured by MAP2 and TH immunoreactivities. The Caenorhabditis elegans (C. elegans) model was established to determine the effect of lead compounds on dopaminergic neurons and behavior changes.

Results: Three compounds (No. 63, 68, and 74), derived from marine corals, could markedly alleviate the cell damage and notably reverse the loss of worm dopaminergic neurons. Further investigation indicated that compound 63 could promote the expression of Nurr1 and inhibit neuronal apoptosis signaling pathways.

Conclusion: Lead compounds from marine corals exerted significant neuroprotective effects, which indicated that coral might be a new and potential resource for screening and isolating novel natural compounds with neuroprotective effects. Furthermore, this study also provided a new strategy for the clinical treatment of neurodegenerative diseases such as Parkinson's disease.

Keywords: C. elegans; Nurr1; SH-SY5Y cells; corals-derived compounds; neuroprotection.


Conflict of interest statement

All the authors declare no conflict of interest.

Figures

FIGURE 1
FIGURE 1
Neuroprotective activity of novel natural compounds from marine coral. (A) Schematic diagram of natural compounds screening process. (B) The cell viability of SH‐SY5Y cells after the treatment of 101 natural compounds. (C, D) The cell viability of SH‐SY5Y cells treated with compounds from the primary screening and MPP+ (500 μM) or H2O2 (100 μM). (E–G) The cell viability of SH‐SY5Y cells treated with compounds 63, 68, 74, and MPP+ or H2O2. Differences between the treatment groups were assessed using one‐way anovas, followed by Dunnett's multiple comparisons test or Šídák's multiple comparisons test. Data were expressed as mean ± SEM, ###p < 0.001 compared with the control group; *p < 0.05, **p < 0.01, and ***p < 0.001 compared with the MPP+/H2O2 group. All experiments were performed in triplicate.
FIGURE 2
FIGURE 2
Alleviation of compounds 63, 68, and 74 on mitochondrial dysfunction and apoptosis in MPP+‐induced SH‐SY5Y cells. (A) Representative immunofluorescence images of MitoSox (red) and Hoechst (blue) in SH‐SY5Y cells. (B) Mean fluorescence intensity analysis of mitoSox. (C, D) Representative images of JC‐1 (JC‐1 aggregate, red; JC‐1 monomer, green) and mean red fluorescence intensity analysis of JC‐1 (D). (E, F) Flow cytometric analyses of PI‐Annexin V staining of apoptotic SH‐SY5Y cells. Cells for Annexin V+/PI and Annexin V+/PI were both considered to be apoptotic. (G, H) Representative immunofluorescence images of PI (G) and Mean fluorescence intensity analysis (H). Scale bar = 20 μm. Differences between the treatment groups were assessed using one‐way anovas, followed by Dunnett's multiple comparisons test. Data were expressed as mean ± SEM, ### p < 0.001 compared with the control group; *p < 0.05, **p < 0.01, and ***p < 0.001 compared with the MPP+ group. All experiments were performed in triplicate.
FIGURE 3
FIGURE 3
Neuroprotective effects of compounds 63, 68, and 74 on primary neurons. (A, B) Representative immunofluorescence images of MAP2 (A) and mean fluorescence intensity analysis (B). Scale bar = 20 μm. (C, D) Representative immunofluorescence images of TH and mean fluorescence intensity analysis. Scale bar = 50 μm. Nuclei were stained with Hoechst (blue). Differences between the treatment groups were assessed using one‐way anovas, followed by Dunnett's multiple comparisons test. Data were expressed as mean ± SEM, ### p < 0.001 compared with the control group; *p < 0.05, **p < 0.01, and ***p < 0.001 compared with the MPP+ group. All experiments were performed in triplicate.
FIGURE 4
FIGURE 4
Compounds 63 and 74 reverse the loss of MPP+‐treated dopaminergic neurons in the Caenorhabditis elegans model. (A) Illustrations of the DA neuron anatomy in C. elegans. (B) Representative fluorescence images of different concentrations of MPP+ on dopamine neurons of BZ555 C. elegans (dat‐1p::GFP). (C) Statistics of mean fluorescence intensity of dopamine neurons in BZ555 C. elegans model. (D) GFP expression patterns of MPP+ (8 mM)‐treated transgenic strain BZ555, and treated with positive control medicine (selegiline, 5 μM), compounds 63 (5 μM), 68 (5 μM), or 74 (5 μM). Scale bar = 50 μm. (E–G) Mean fluorescence intensity analysis of DA neurons in BZ555 C. elegans model. Differences between the treatment groups were assessed using one‐way anovas, followed by Dunnett's multiple comparisons test or Šídák's multiple comparisons test. Data were expressed as mean ± SEM, ### p < 0.001 compared with the control group; ***p < 0.001 compared with the MPP+ group. The experiment was performed independently at least three times (The number of worms = 15–20 animals/group per replicate).
FIGURE 5
FIGURE 5
Compounds 63 and 68 improve behavioral disorder and MPP+‐induced lifespan reduction in the Caenorhabditis elegans model. (A) The basal slowing rate in MPP+‐induced N2 C. elegans and treated with 63, 68, and 74. (B–D) The percent of N2 C.elegans exhibiting SWIP. (E–J) Survival curves in MPP+‐induced N2 and BZ555 C. elegans and treated with compounds 63, 68, and 74. Differences between the treatment groups were assessed using one‐way anovas, followed by Dunnett's multiple comparisons test. Data were expressed as mean ± SEM, ### p < 0.001 compared with the control group; *p < 0.05, **p < 0.01 compared with the MPP+ group. The experiment was performed independently at least three times (The number of worms = 12–20 animals/group per replicate).
FIGURE 6
FIGURE 6
Amelioration of compound 63 on MPP+‐induced apoptosis and oxidative stress in SH‐SY5Y cells and N2 C. elegans. (A, B) Flow cytometric analyses of Annexin V‐PI staining of apoptotic SH‐SY5Y cells after the treatment of compounds 63. (C–E) Effects of compound 63 on the MPP+‐induced oxidative stress of SH‐SY5Y cells were examined by the levels of GSH, SOD, and the ratio of GSH/GSSG ratio. SH‐SY5Y cells were treated with compound 63 and selegiline at 1 μM. (F, G) Effects of compound 63 on the MPP+‐induced oxidative stress of N2 C. elegans were detected by Sod2 and Sod3 mRNA levels. N2 C. elegans were treated with compound 63 and selegiline at 5 μM. Differences between the treatment groups were assessed using one‐way anovas, followed by Dunnett's multiple comparisons test or Šídák's multiple comparisons test. Data were expressed as mean ± SEM, ### p < 0.001 compared with the control group; *p < 0.05, **p < 0.01, and ***p < 0.001 compared with the MPP+ group; & p < 0.05 and &&& p < 0.001 compared with the 0.01 μM‐ compound 63 treatment group. All experiments were performed in triplicate.
FIGURE 7
FIGURE 7
Inhibition of compound 63 on MPP+‐induced neuronal apoptosis by Nurr1. (A, B) Target prediction database and possible target analysis of compound 63. (C, D) Levels of Nfκb, Bcl2, Bcl‐x, Jnk3, Nos2, Nurr1, and Cryab mRNA expression in primary neurons (C) and SH‐SY5Y cells (D). (E) Western blot analysis of Nurr1, Bcl2, Bax, and Caspase3 expression in SH‐SY5Y cells. (F, G) Correlation analysis of Nurr1 and Bcl2 in the amygdala and nucleus accumbens. (H) The efficiency of Nurr1 knockdown after the transfection of siRNA by QPCR. (I, K) Representative immunofluorescence images of mitoSox (I) and PI (K) in SH‐SY5Y cells. (J, L) Mean fluorescence intensity analysis of MitoSox and PI in SH‐SY5Y cells. Nuclei were stained with Hoechst (blue). Differences between the treatment groups were assessed using one‐way anovas, followed by Dunnett's multiple comparisons test or Šídák's multiple comparisons test. Data were expressed as mean ± SEM, # p < 0.05, ## p < 0.01, and ### p < 0.001 compared with the control group; *p < 0.05, **p < 0.01 and ***p < 0.001 compared with the MPP+ group. All experiments were performed in triplicate.

Similar articles

Cited by

References

    1. Ross CA, Poirier MA. Protein aggregation and neurodegenerative disease. Nat Med. 2004;10:S10‐S17. - PubMed
    1. Vazquez‐Velez GE, Zoghbi HY. Parkinson's disease genetics and pathophysiology. Annu Rev Neurosci. 2021;44:87‐108. - PubMed
    1. Balestrino R, Schapira AHV. Parkinson disease. Eur J Neurol. 2020;27(1):27‐42. - PubMed
    1. Chiurchiù V, Orlacchio A, Maccarrone M. Is modulation of oxidative stress an answer? The state of the art of redox therapeutic actions in neurodegenerative diseases. Oxid Med Cell Longev. 2016;2016:7909380. - PMC - PubMed
    1. Srivastava AK, Roy Choudhury S, Karmakar S. Melatonin/polydopamine nanostructures for collective neuroprotection‐based Parkinson's disease therapy. Biomater Sci. 2020;8(5):1345‐1363. - PubMed

Publication types

Substances