. 2022 Nov;12(11):e1102.
doi: 10.1002/ctm2.1102.

Spliceosomal profiling identifies EIF4A3 as a novel oncogene in hepatocellular carcinoma acting through the modulation of FGFR4 splicing

Affiliations

Spliceosomal profiling identifies EIF4A3 as a novel oncogene in hepatocellular carcinoma acting through the modulation of FGFR4 splicing

Juan L López-Cánovas et al. Clin Transl Med. 2022 Nov.

Abstract

Introduction: Altered splicing landscape is an emerging cancer hallmark; however, the dysregulation and implication of the cellular machinery controlling this process (spliceosome components and splicing factors) in hepatocellular carcinoma (HCC) is poorly known. This study aimed to comprehensively characterize the spliceosomal profile and explore its role in HCC.

Methods: Expression levels of 70 selected spliceosome components and splicing factors and clinical implications were evaluated in two retrospective and six in silico HCC cohorts. Functional, molecular and mechanistic studies were implemented in three cell lines (HepG2, Hep3B and SNU-387) and preclinical Hep3B-induced xenograft tumours.

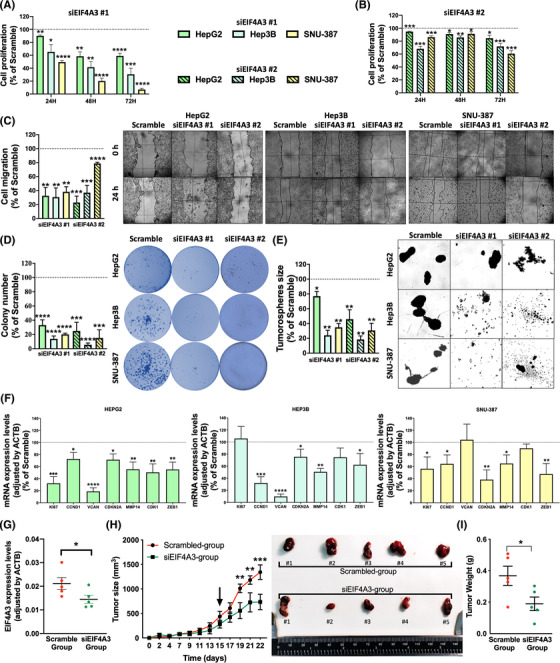
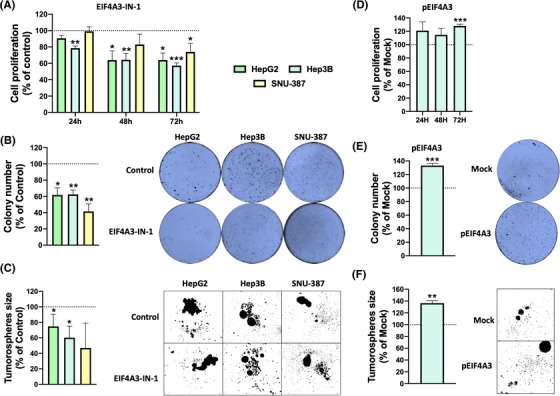
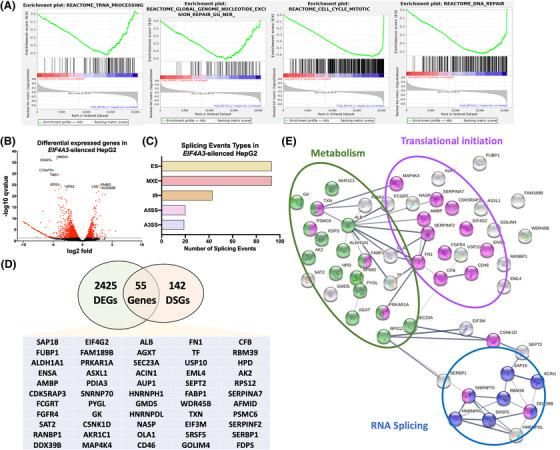
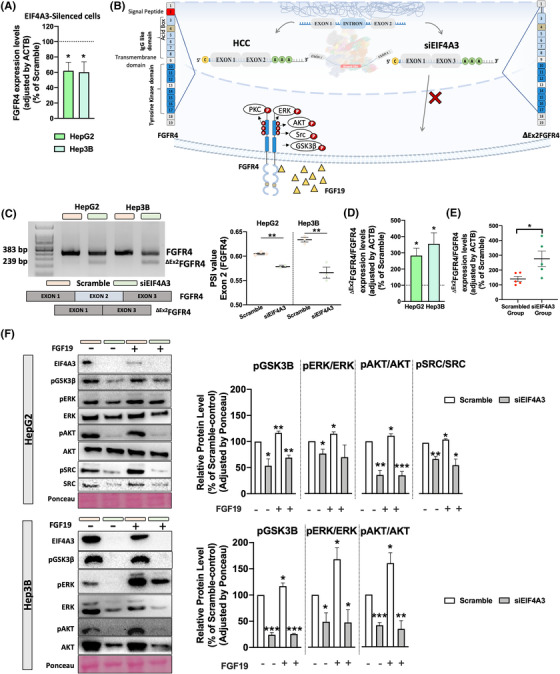
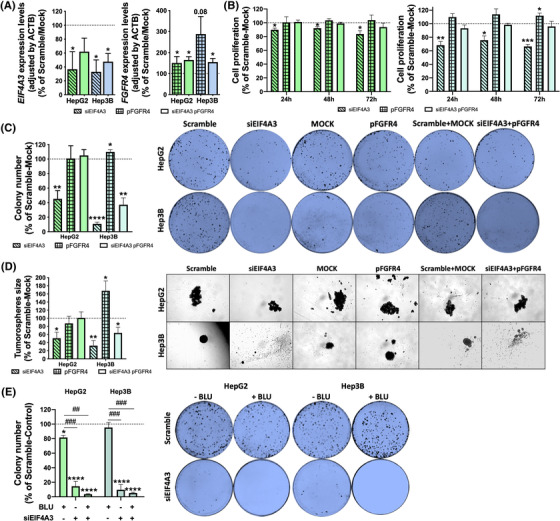
Results: Spliceosomal dysregulations were consistently found in retrospective and in silico cohorts. EIF4A3, RBM3, ESRP2 and SRPK1 were the most dysregulated spliceosome elements in HCC. EIF4A3 expression was associated with decreased survival and greater recurrence. Plasma EIF4A3 levels were significantly elevated in HCC patients. In vitro EIF4A3-silencing (or pharmacological inhibition) resulted in reduced aggressiveness, and hindered xenograft-tumours growth in vivo, whereas EIF4A3 overexpression increased tumour aggressiveness. EIF4A3-silencing altered the expression and splicing of key HCC-related genes, specially FGFR4. EIF4A3-silencing blocked the cellular response to the natural ligand of FGFR4, FGF19. Functional consequences of EIF4A3-silencing were mediated by FGFR4 splicing as the restoration of non-spliced FGFR4 full-length version blunted these effects, and FGFR4 inhibition did not exert further effects in EIF4A3-silenced cells.

Conclusions: Splicing machinery is strongly dysregulated in HCC, providing a source of new diagnostic, prognostic and therapeutic options in HCC. EIF4A3 is consistently elevated in HCC patients and associated with tumour aggressiveness and mortality, through the modulation of FGFR4 splicing.

Keywords: FGF19; liver cancer; preclinical model; splicing machinery.


Conflict of interest statement

The authors have no conflicts of interest to declare.

Figures

FIGURE 1
FIGURE 1
Spliceosome components and splicing factors are altered in hepatocellular carcinoma (HCC): (A) fold‐change of spliceosome components and splicing factors expression in HCC tissue versus non‐tumour adjacent tissue (NTAT) in Retrospective‐1 cohort. Data are presented as mean ± standard error of the mean (SEM); (B) bubble plot of the expression pattern of significantly dysregulated spliceosome components and splicing factors in seven validation cohorts. The y‐axis indicates the spliceosome component and splicing factors altered in Retrospective‐1. Bubbles indicate the expression pattern. The bubble size indicates the p‐value; (C) VIP score analysis showing the spliceosome components and splicing factors with higher discriminatory capacity in Retrospective‐1; (D) spliceosomal components more frequently found among the five elements (Top 5) with more discriminatory capacity in all the studied cohorts by VIP score analysis; (E) ROC curve analysis constructed with the expression levels of EIF4A3, ESRP2, SRPK1 and RBM3 to discriminate between tumour and non‐tumour samples in all the studied cohorts; (F) transcriptomic and genomic alteration landscape of EIF4A3, ESRP2, SRPK1 and RBM3 in the TCGA cohort, and the clinical features of the patients. The asterisks (*p < .05; **p < .01; ***p < .001) indicate statistically significant differences
FIGURE 2
FIGURE 2
EIF4A3 is associated with clinical aggressiveness and poor survival of hepatocellular carcinoma (HCC) patients: (A) EIF4A3 overexpression in HCC samples versus normal or non‐tumour adjacent tissue (NTAT) from seven different cohorts; (B) ROC curve analysis to discriminate between HCC versus normal or NTAT based on EIF4A3 expression; (C) association between EIF4A3 expression and clinical parameters in Retrospective‐1 cohort; (D) overall survival of patients from Retrospective‐1 and TCGA cohort categorized by the expression levels of EIF4A3 (patients with highest expression vs. lowest expression group [cut‐off = median]) determined by long‐rank‐p‐value method; (E) recurrence of patients from Retrospective‐1 cohort (patients with highest expression vs. lowest expression group) determined by long‐rank‐p‐value method; (F) EIF4A3 expression levels in TCGA patients with mutations in key HCC genes; (G) EIF4A3 protein levels in CPTAC cohort; (H) overall survival and recurrence of patients from CPTAC cohort categorized by the protein levels of EIF3A3 (patients with highest expression vs. lowest expression group [cut‐off = median]) determined by long‐rank‐p‐value method, and association between EIF4A3 protein levels and clinical parameters in CPTAC cohort; (I) EIF4A3 mRNA levels in HepG2, Hep3B and SNU‐345 cell lines determined by qPCR and adjusted by ACTB expression; (J) EIF4A3 protein levels in HepG2, Hep3B and SNU‐345 cell lines determined by western‐blot; (K) EIF4A3 levels in supernatant from HepG2, Hep3B and SNU‐345 cells determined by ELISA; (L) EIF4A3 levels in plasma from a cohort of HCC (n = 16), cirrhosis (n = 25), NAFLD (n = 28) patients and control individuals (n = 21) determined by ELISA. The asterisks (*p < .05; **p < .01; ****p < .0001) indicate statistically significant differences. HR means hazard ratio
FIGURE 3
FIGURE 3
EIF4A3 silencing decreases aggressiveness of hepatocellular carcinoma (HCC) cells: proliferation of EIF4A3‐silenced with siEIF4A3#1 (A) and siEIF4A3#2 (B) compared to scramble‐treated cell lines (HepG2, Hep3B and SNU‐387) at 24, 48 and 72 h determined by the Alamar Blue assay; (C) migration of EIF4A3‐silenced compared to scramble‐treated cells. Representative images of cell migration after 24 h are depicted; (D) number of colonies formed in EIF4A3‐silenced compared to scramble‐treated cells. Representative images of colonies formed after 10 days are depicted; (E) mean tumoursphere size of EIF4A3‐silenced compared to scramble‐treated cells. Representative images of tumourspheres formed after 10 days are depicted; (F) mRNA expression levels of key tumour markers genes in EIF4A3‐silenced versus scramble‐treated cells; (G) Validation of EIF4A3 expression by qPCR after in vivo silencing in xenograft models; (H) growth rate of tumours in Hep3B‐induced xenograft tumours in nude mice (n = 5) before and after in vivo EIF4A3‐silencing (indicated by the arrow). Representative images of scramble‐ and siEIF4A3‐treated tumours are depicted; (I) final tumour weight of scramble‐ and siEIF4A3‐treated tumours. Data are presented as mean ± standard error of the mean (SEM) from n = 3–5 independent experiments. The asterisks (*p < .05; **p < .01; ***p < .001; ****p < .0001) indicate statistically significant differences
FIGURE 4
FIGURE 4
Pharmacologic inhibition or overexpression of EIF4A3 alter aggressiveness of liver cancer cells: (A) cell proliferation was determined in EIF4A3‐IN‐1 and vehicle‐treated HepG2, Hep3B and SNU‐387 cells by the Alamar Blue assay at 24, 48 and 72 h; (B) number of colonies formed in EIF4A3‐IN‐1 treated cells compared to vehicle‐treated cells. Representative images of colonies formed after 10 days are depicted; (C) mean tumoursphere size of in EIF4A3‐IN‐1 treated cells compared to vehicle‐treated cells. Representative images of tumourspheres formed after 10 days are depicted; (D) cell proliferation was determined in pEIF4A3‐transfected HepG2 cells in comparison with mock cells by the Alamar Blue assay at 24, 48 and 72 h; (E) number of colonies formed in pEIF4A3‐transfected cells compared to mock cells. Representative images of colonies formed after 10 days are depicted; (F) mean tumoursphere size of in pEIF4A3‐transfected cells compared to mock cells. Representative images of tumourspheres formed after 10 days are depicted. Data are presented as mean ± standard error of the mean (SEM) from n = 3–5 independent experiments. Asterisks (*p < .05; ***p < .001) indicate statistically significant differences versus scramble‐treated controls. Dashes (#p < .05; ##p < .01; ###p < .001) indicate statistically significant differences versus vehicle‐treated controls
FIGURE 5
FIGURE 5
EIF4A3 associates with the expression and splicing of key hepatocellular carcinoma (HCC)‐related genes: (A) GSEA analysis performed by GenePattern in Reactome using the TCGA cohort classified by EIF4A3 expression levels in low and high EIF4A3 groups; (B) differentially expressed genes (DEGs) in EIF4A3‐silenced HepG2 cells obtained from RNAseq data (FDR < .05); (C) splicing event types in EIF4A3‐silenced HepG2 cells obtained from RNAseq data (FDR < .05); (D) the Venn diagram of DEGs and differentially spliced genes (DSGs) in EIF4A3‐silenced HepG2 cells (FDR < .05); (E) STRING analysis of the 55 genes with differential expression and splicing pattern in EIF4A3‐silenced HepG2 cells (FDR < .05)
FIGURE 6
FIGURE 6
EIF4A3 modulates FGFR4 expression and splicing and reduces functional signalling of FGF19/FGFR4: (A) FGFR4 expression levels determined by qPCR in EIF4A3‐silenced cells (HepG2 and Hep3B) compared with scramble‐treated controls; (B) working hypothesis showing the implication of EIF4A3 silencing on FGFR4 exon 2 skipping; (C) validation of FGFR4 exon 2 skipping event in HepG2 and Hep3B cells in response to EIF4A3 silencing by qPCR. PSI means per cent spliced in; (D) validation of FGFR4 exon 2 skipping event calculated by the expression rate of dEx2FGFR4 and full‐length FGFR4 in response to EIF4A3‐silencing in HepG2 and Hep3b cells by qPCR; (E) validation of FGFR4 exon 2 event skipping calculated by the expression rate of dEx2FGFR4 and full‐length FGFR4 in response to EIF4A3 silencing in Hep3B‐induced and scramble‐ or siEIF4A3‐treated xenograft tumours by qPCR; (F) Western‐blot of downstream signalling of FGFR4 in HepG2 and Hep3B cells in response to EIF4A3‐silencing alone or in combination with FGF19 exogenous treatment (100 nM). Relative protein level for pGSK3B, pERK, pAKT and pSRC, normalized to total protein, respectively, and all protein level were normalized by Ponceau. Data are presented as mean ± standard error of the mean (SEM) from n = 3–5 independent experiments. Asterisks (*p < .05; **p < .01; ***p < .001; ****p < .0001) indicate statistically significant differences
FIGURE 7
FIGURE 7
EIF4A3 silencing exerts its inhibitory actions by modulating FGFR4 splicing: (A) validation of EIF4A3 and FGFR4 expression in rescue experiments. EIF4A3 was silenced alone or in combination with FGFR4 overexpression in HepG2 and Hep3B cells, and the expression of both genes was validated in all the experimental conditions by qPCR; (B) cell proliferation determined in siEIF4A3‐treated, pFGFR4‐transfected and siEIF4A3‐treated/pFGFR4‐transfected, compared with scramble‐treated/mock HepG2 and Hep3B cells by Alamar Blue assay at 24, 48 and 72 h; (C) number of colonies formed in siEIF4A3‐treated, pFGFR4‐transfected and siEIF4A3‐treated/pFGFR4‐transfected, compared with scramble‐treated/mock HepG2 and Hep3B cells. Representative images of colonies formed after 10 days are depicted; (D) mean tumoursphere size of siEIF4A3‐treated, pFGFR4‐transfected and siEIF4A3‐treated/pFGFR4‐transfected, compared with scramble‐treated/mock HepG2 and Hep3B cells. Representative images of tumourspheres formed after 10 days are depicted; (E) number of colonies formed in siEIF4A3‐treated, BLU‐treated and siEIF4A3‐treated/BLU‐treated HepG2 and Hep3B cells compared to scramble‐ treated/control cells. Representative images of colonies formed after 10 days are depicted. Data are presented as mean ± standard error of the mean (SEM) from n = 3–5 independent experiments. Asterisks (*p < .05; **p < .01; ***p < .001; ****p < .0001) indicate statistically significant differences versus scramble‐treated or mock controls, whereas dashes (## p < .01; ### p < .001) indicate statistically significant differences versus vehicle‐treated controls

References

    1. Villanueva A. Hepatocellular carcinoma. N Engl J Med. 2019;380(15):1450‐1462. - PubMed
    1. Sung H, Ferlay J, Siegel RL, et al. Global cancer statistics 2020: GLOBOCAN estimates of incidence and mortality worldwide for 36 cancers in 185 countries. CA Cancer J Clin. 2021;71:209‐249. - PubMed
    1. Wang E, Aifantis I. RNA splicing and cancer. Trends Cancer. 2020;6(8):631‐644. - PubMed
    1. Lee SE, Alcedo KP, Kim HJ, Snider NT. Alternative splicing in hepatocellular carcinoma. Cell Mol Gastroenterol Hepatol. 2020;10(4):699‐712. - PMC - PubMed
    1. Castillo J, Goni S, Latasa MU, et al. Amphiregulin induces the alternative splicing of p73 into its oncogenic isoform DeltaEx2p73 in human hepatocellular tumors. Gastroenterology. 2009;137(5):1805‐1815.e1‐4. - PubMed

Publication types