Thyroid hormone elicits intergenerational epigenetic effects on adult social behavior and fetal brain expression of autism susceptibility genes
- PMID: 36419462
- PMCID: PMC9676973
- DOI: 10.3389/fnins.2022.1055116
Thyroid hormone elicits intergenerational epigenetic effects on adult social behavior and fetal brain expression of autism susceptibility genes
Abstract
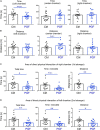
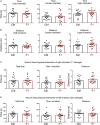
Genetic mutations identified in genome-wide association studies can only explain a small percentage of the cases of complex, highly heritable human conditions, including neurological and neurodevelopmental disorders. This suggests that intergenerational epigenetic effects, possibly triggered by environmental circumstances, may contribute to their etiology. We previously described altered DNA methylation signatures in the sperm of mice that experienced developmental overexposure to thyroid hormones as a result of a genetic defect in hormone clearance (DIO3 deficiency). Here we studied fetal brain gene expression and adult social behavior in genetically normal F2 generation descendants of overexposed mice. The brain of F2 generation E13.5 fetuses exhibited abnormal expression of genes associated with autism in humans, including Auts2, Disc1, Ldlr, Per2, Shank3, Oxtr, Igf1, Foxg1, Cd38, Grid2, Nrxn3, and Reln. These abnormal gene expression profiles differed depending on the sex of the exposed ancestor. In the three-chamber social box test, adult F2 generation males manifested significantly decreased interest in social interaction and social novelty, as revealed by decrease total time, distance traveled and time immobile in the area of interaction with novel strangers. F1 generation mice, compared to appropriate controls also exhibited altered profiles in fetal brain gene expression, although these profiles were substantially different to those in the F2 generation. Likewise adult F1 generation mice showed some abnormalities in social behavior that were sexually dimorphic and milder than those in F2 generation mice. Our results indicate that developmental overexposure to thyroid hormone causes intergenerational epigenetic effects impacting social behavior and the expression of autism-related genes during early brain development. Our results open the possibility that altered thyroid hormone states, by eliciting changes in the epigenetic information of the germ line, contribute to the susceptibility and the missing-but heriTables-etiology of complex neurodevelopmental conditions characterized by social deficits, including autism and schizophrenia.
Keywords: autism; fetal brain; social behavior; thyroid hormone; transgenerational epigenetic.
Copyright © 2022 Martinez, Stohn, Mutina, Whitten and Hernandez.
Conflict of interest statement
The authors declare that the research was conducted in the absence of any commercial or financial relationships that could be construed as a potential conflict of interest.
Figures


Similar articles
-
Transgenerational epigenetic self-memory of Dio3 dosage is associated with Meg3 methylation and altered growth trajectories and neonatal hormones.Epigenetics. 2024 Dec;19(1):2376948. doi: 10.1080/15592294.2024.2376948. Epub 2024 Jul 11. Epigenetics. 2024. PMID: 38991122 Free PMC article.
-
Epigenetic developmental programming and intergenerational effects of thyroid hormones.Vitam Horm. 2023;122:23-49. doi: 10.1016/bs.vh.2023.01.003. Epub 2023 Feb 9. Vitam Horm. 2023. PMID: 36863795 Free PMC article. Review.
-
Thyroid hormone influences brain gene expression programs and behaviors in later generations by altering germ line epigenetic information.Mol Psychiatry. 2020 May;25(5):939-950. doi: 10.1038/s41380-018-0281-4. Epub 2018 Oct 24. Mol Psychiatry. 2020. PMID: 30356120 Free PMC article.
-
Intergenerational impact of paternal lifetime exposures to both folic acid deficiency and supplementation on reproductive outcomes and imprinted gene methylation.Mol Hum Reprod. 2017 Jul 1;23(7):461-477. doi: 10.1093/molehr/gax029. Mol Hum Reprod. 2017. PMID: 28535307 Free PMC article.
-
The genetics of autism.Pediatrics. 2004 May;113(5):e472-86. doi: 10.1542/peds.113.5.e472. Pediatrics. 2004. PMID: 15121991 Review.
Cited by
-
Transgenerational epigenetic self-memory of Dio3 dosage is associated with Meg3 methylation and altered growth trajectories and neonatal hormones.Epigenetics. 2024 Dec;19(1):2376948. doi: 10.1080/15592294.2024.2376948. Epub 2024 Jul 11. Epigenetics. 2024. PMID: 38991122 Free PMC article.
-
Paternal developmental thyrotoxicosis disrupts neonatal leptin leading to increased adiposity and altered physiology of the melanocortin system.Front Endocrinol (Lausanne). 2023 Jul 25;14:1210414. doi: 10.3389/fendo.2023.1210414. eCollection 2023. Front Endocrinol (Lausanne). 2023. PMID: 37560296 Free PMC article.
-
Mom genes and dad genes: genomic imprinting in the regulation of social behaviors.Epigenomics. 2025 Jun;17(8):555-573. doi: 10.1080/17501911.2025.2491294. Epub 2025 Apr 18. Epigenomics. 2025. PMID: 40249667 Review.
-
Epigenetic developmental programming and intergenerational effects of thyroid hormones.Vitam Horm. 2023;122:23-49. doi: 10.1016/bs.vh.2023.01.003. Epub 2023 Feb 9. Vitam Horm. 2023. PMID: 36863795 Free PMC article. Review.
-
Abnormal DNA methylation within HPA-axis genes years after paediatric critical illness.Clin Epigenetics. 2024 Feb 23;16(1):31. doi: 10.1186/s13148-024-01640-y. Clin Epigenetics. 2024. PMID: 38395991 Free PMC article.
References
-
- Andersen S. L., Laurberg P., Wu C. S., Olsen J. (2014). Attention deficit hyperactivity disorder and autism spectrum disorder in children born to mothers with thyroid dysfunction: A Danish nationwide cohort study. BJOG 121 1365–1374. - PubMed
-
- Anselmo J., Cao D., Karrison T., Weiss R. E., Refetoff S. (2004). Fetal loss associated with excess thyroid hormone exposure. JAMA 292 691–695. - PubMed
Grants and funding
LinkOut - more resources
Full Text Sources
Molecular Biology Databases
Research Materials
Miscellaneous

