. 2022 Oct 27:27:452-463.
doi: 10.1016/j.omtm.2022.10.013. eCollection 2022 Dec 8.

Brain transplantation of genetically corrected Sanfilippo type B neural stem cells induces partial cross-correction of the disease

Affiliations

Brain transplantation of genetically corrected Sanfilippo type B neural stem cells induces partial cross-correction of the disease

Yewande Pearse et al. Mol Ther Methods Clin Dev. .

Abstract

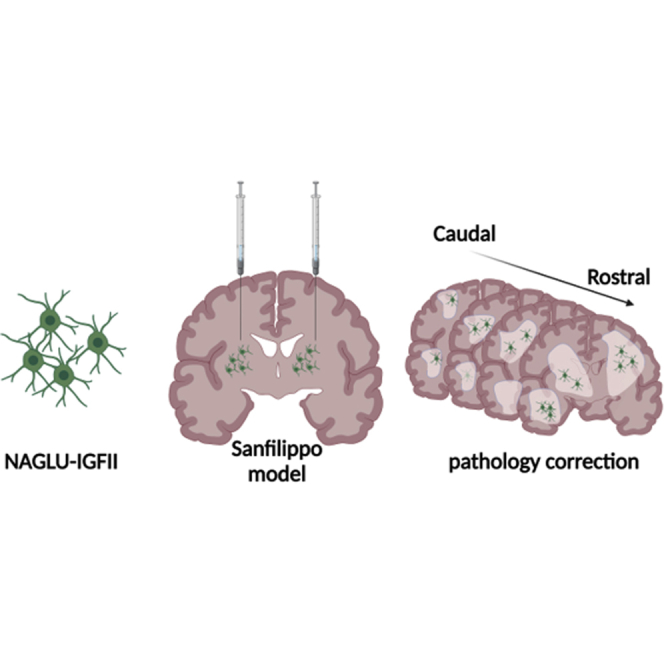
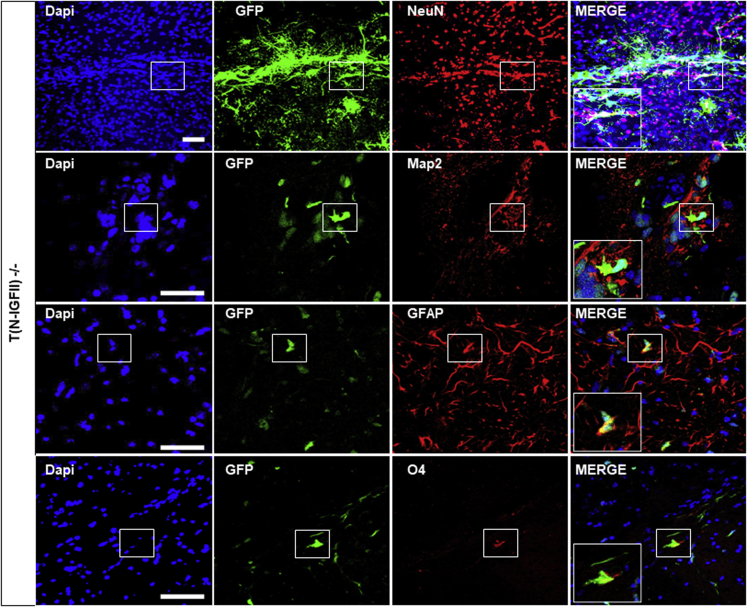
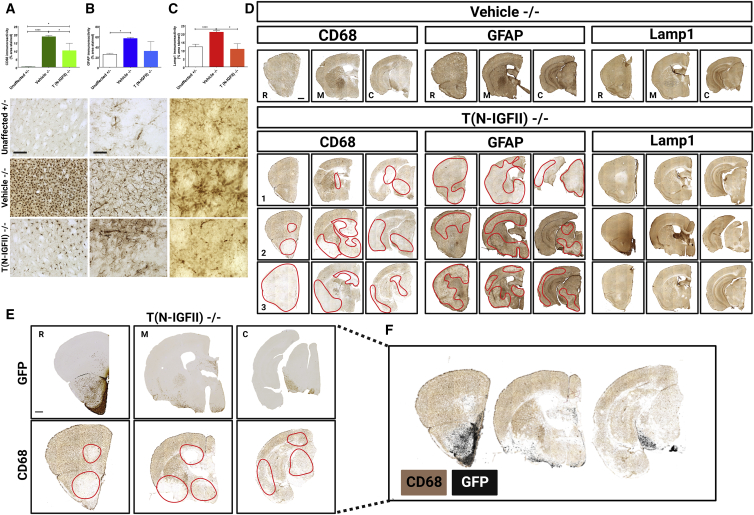
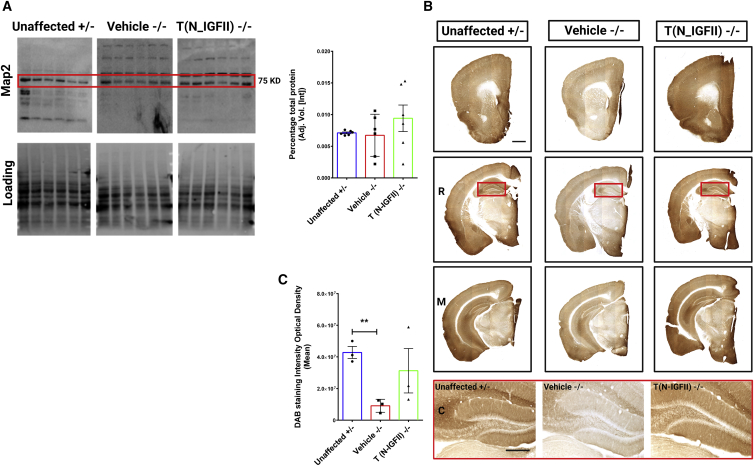
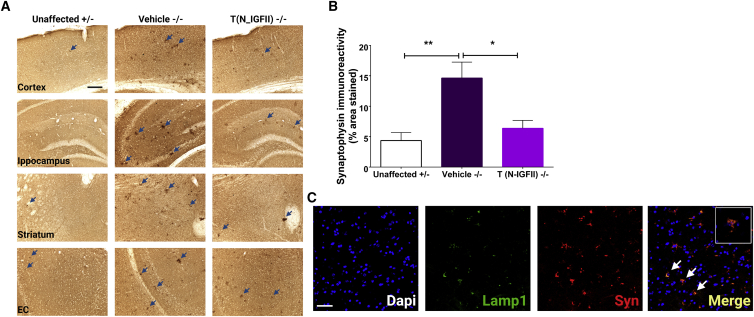
Sanfilippo syndrome type B (mucopolysaccharidosis type IIIB) is a recessive genetic disorder that severely affects the brain due to a deficiency in the enzyme α-N-acetylglucosaminidase (NAGLU), leading to intra-lysosomal accumulation of partially degraded heparan sulfate. There are no effective treatments for this disorder. In this project, we carried out an ex vivo correction of neural stem cells derived from Naglu -/- mice (iNSCs) induced pluripotent stem cells (iPSC) using a modified enzyme in which human NAGLU is fused to an insulin-like growth factor II receptor binding peptide in order to improve enzyme uptake. After brain transplantation of corrected iNSCs into Naglu -/- mice and long-term evaluation of their impact, we successfully detected NAGLU-IGFII activity in all transplanted animals. We found decreased lysosomal accumulation and reduced astrocytosis and microglial activation throughout transplanted brains. We also identified a novel neuropathological phenotype in untreated Naglu -/- brains with decreased levels of the neuronal marker Map2 and accumulation of synaptophysin-positive aggregates. Upon transplantation, we restored levels of Map2 expression and significantly reduced formation of synaptophysin-positive aggregates. Our findings suggest that genetically engineered iNSCs can be used to effectively deliver the missing enzyme to the brain and treat Sanfilippo type B-associated neuropathology.

Keywords: LSD; MPS; Sanfilippo type B; cell therapy; neural progenitor cells.


Conflict of interest statement

The authors declare no competing interest.

Figures

None
Graphical abstract
Figure 1
Figure 1
NAGLU-IGFII-corrected iNSC (N-IGFII-iNSCs) engraftment and cell fate 9 months after transplantation Immunofluorescence staining of corrected N-IGFII-iNSCs in Naglu−/− brain slices (40-μm) positive for green fluorescent protein (GFP) (green). GFP-positive N-IGFII-iNSCs co-localized with Map2, NeuN, GFAP and oligodendrocyte marker O4. Nuclear staining with DAPI (blue) was overlaid. Scale bars represent 50 μm.
Figure 2
Figure 2
Engraftment and enzyme activity evaluation after 9 months post-transplantation (A) Schematic illustration of a sagittal brain section (lateral 0.24 mm bregma) adapted from The Mouse Brain in Sterotaxic Coordinates (second edition) by Paxinos and Franklin. Black, spotted, striped, and plain white bars above schematic diagram correspond to specific regions of analysis along the rostrocaudal axis shown in (C). (B) Histogram showing total percentage area (%) (sum) GFP staining in each engrafted animal plotted along the x axis (12 animals in total). (C) Histogram showing GFP percentage area stained in three representative animals (#4763, #4871, #4872) for each individual section through the rostrocaudal axis, at the level of the olfactory bulb (black bars), cerebral cortex through to the beginning of the hippocampus (spots), thalamus (stripes), and midbrain (plain white). (D) Enzymatic activity of NAGLU-IGFII (N-IGFII) shown in units per milligram of protein, performed on brain lysates (mean average of the four sections depicted in F) following injections with N-IGFII-iNSCs in all 12 animals, using the NAGLU enzymatic activity in Naglu−/−mice as a background signal. Broken red line shows protein level at 100% of the carrier level; solid line shows 10% of the carrier level. (E) Correlation between level of engraftment and enzymatic activity of NAGLU-IGFII (R = 0.83) in transplanted animals. (F) Schematic diagram depicting how the brains were divided for each animal. Brains were dissected sagittally along the midline first, and then right hemisphere was further sectioned into four slices as shown. The black dots represent the approximate intraparenchymal injection sites. (G) Graph showing the percentage (Log10) of carrier-level enzymatic activity of NAGLU-IGFII in four segments (depicted in F) along the rostrocaudal axis in 12 engrafted brains. Brain segments 1 and 2 (1 + 2), and 5 and 6 (5 + 6) were pooled. Red dotted line represents carrier level (Log10), solid colored lines represent each engrafted brain. Values are shown as mean ± SEM of enzyme activity measured in each slice (n = 12).
Figure 3
Figure 3
Correction of neuropathology and storage accumulation in Naglu−/− mice treated with NAGLU-IGFII-corrected iNSC (N-IGFII-iNSCs) at 9 months Histograms (A–C) showing the percentage area of CD68 (B) and GFAP (C) immunoreactivity, and mean intensity of LAMP1 (D) immunoreactivity in every one-in-twelve sections, including all regions within the forebrain, for each group measured. ∗p ≤ 0.05, ∗∗∗p ≤ 0.001 ∗∗∗∗p ≤ 0.0001; two-tailed, unpaired parametric t test. Values are shown as mean ± SEM (n = 3 mice per group). Representative images taken within the striatum (below). (D) Low magnification of representative bright-field images of coronal sections for representative vehicle-treated (Vehicle −/−) mice compared with three representatives N-IGFII treated (T (N-IGFII)−/−) mice to show the level of variation of pathology correction. Sections were taken at three levels along the rostrocaudal axis: rostral (R; at the level of the isocortex and olfactory areas), middle (M; at the level where the fimbria of the hippocampus appears), and caudal (C; at the level of the midbrain) of mice from engrafted Naglu−/− mice, and immunohistochemically stained for CD68 (first block), GFAP (second block), and LAMP1 (third block). 1–3 represent three different Naglu−/− mice injected with N-IGFII-iNSCs to demonstrate variation in CD68, GFAP, and LAMP1 immunoreactivity within the same treatment group. Red broken lines outline the areas where CD68 and GFAP immunoreactivity is reduced. (E) Representative adjacent sections from an engrafted Naglu−/− mouse immunohistochemically stained for GFP (top, color image) and CD68 (bottom, color image) taken at the rostral, medial, and caudal part of the brain. Red squares highlight the part that contains GFP staining and reduced CD68 staining, respectively. (F) Areas where CD68 staining was absent (no pixels) were modified to appear transparent and positioned on top of the corresponding GFP-stained section (black) as an overlay. Post-acquisition processing was applied to all images and included adjustments to brightness and contrast and RGB curves using Adobe Photoshop CS6 to improve visibility and consistency in color tone. Scale bars represent 200 μm (A-C), 1,000 μm (D).
Figure 4
Figure 4
Correction of Map2 downregulation in Naglu−/− mice at 9 months (A) Map2 protein levels in whole-brain (n = 6 for each group) measured by western blot and quantification in heterozygous control mice (Unaffected) and Naglu−/− mice injected with vehicle (Vehicle −/−) or N-IGFII-iNSCs (T (N-IGFII)−/−). Red square shows the expected Map2 band size. (B) Representative bright-field images of 40-μm-thick half-brain coronal sections from immunohistochemically stained for Map2 in animal groups as in (A). Panels depicted by R, M, C show sections taken at three levels along the rostrocaudal axis: rostral (R; at the level of the isocortex and olfactory areas), middle (M; at the level where the fimbria of the hippocampus appears), and caudal (C; at the level of the midbrain). Panel highlighted in red box below shows high magnification images of hippocampus depicted for each group. Post-acquisition processing was applied equally to all images and included adjustments to brightness and contrast and RGB curves using Adobe Photoshop CS6 to improve visibility and consistency in color tone. Scale bars represent 1,000 μm (top) and 200 μm (bottom). (C) Histograms show the optical density (DAB staining intensity optical density) of Map2 immunohistochemical staining in the hippocampus of animal groups in (A). ∗∗p ≤ 0.01, two-tailed, unpaired parametric t test. Values are shown as mean ± SEM (n = 3 mice per group).
Figure 5
Figure 5
Correction of synaptophysin aggregation in Naglu−/− mice at 9 months (A) Representative bright-field images of 40-μm-thick half-brain coronal sections from Naglu+/− mice (Unaffected) and Naglu−/− mice injected with saline (Vehicle −/−) or N-IGFII-iNSCs (T (N-IGFII) −/−) immunohistochemically stained for synaptophysin. High magnification images, panel below, show synaptophysin-positive aggregates (blue arrows) in the cortex, hippocampus, striatum, and entorhinal cortex (EC) of all treatment groups. Post-acquisition processing was applied equally to all images and included adjustments to brightness and contrast and RGB curves using Adobe Photoshop CS6 to improve visibility and consistency in color tone. Scale bars represent 1,000 μm low magnification, 200 μm higher magnification. (B) Histograms showing the percentage area of synaptophysin immunoreactivity in every one-in-twelve sections including all regions within the forebrain for each group measured. ∗p ≤ 0.0146, ∗∗p ≤ 0.0037; two-tailed, unpaired parametric t test. Values are shown as mean ± SEM (n = 3 mice per group). (C) Immunofluorescence staining showing co-localization (yellow) of LAMP1 (green) and synaptophysin (red) in 40-μm-thick half-brain coronal sections from Naglu−/− mice injected with vehicle (Vehicle −/−). Scale bars represent 50 μm.

Similar articles

Cited by

References

    1. Valstar M.J., Ruijter G.J.G., van Diggelen O.P., Poorthuis B.J., Wijburg F.A. Sanfilippo syndrome: a mini-review. J. Inherit. Metab. Dis. 2008;31:240–252. doi: 10.1007/s10545-008-0838-5. - DOI - PubMed
    1. Iozzo R.V., Schaefer L. Proteoglycan form and function: a comprehensive nomenclature of proteoglycans. Matrix Biol. 2015;42:11–55. doi: 10.1016/j.matbio.2015.02.003. - DOI - PMC - PubMed
    1. McGlynn R., Dobrenis K., Walkley S.U. Differential subcellular localization of cholesterol, gangliosides, and glycosaminoglycans in murine models of mucopolysaccharide storage disorders. J. Comp. Neurol. 2004;480:415–426. doi: 10.1002/cne.20355. - DOI - PubMed
    1. Settembre C., Fraldi A., Jahreiss L., Spampanato C., Venturi C., Medina D., de Pablo R., Tacchetti C., Rubinsztein D.C., Ballabio A. A block of autophagy in lysosomal storage disorders. Hum. Mol. Genet. 2008;17:119–129. doi: 10.1093/hmg/ddm289. - DOI - PubMed
    1. Fraldi A., Annunziata F., Lombardi A., Kaiser H.J., Medina D.L., Spampanato C., Fedele A.O., Polishchuk R., Sorrentino N.C., Simons K., et al. Lysosomal fusion and SNARE function are impaired by cholesterol accumulation in lysosomal storage disorders. EMBO J. 2010;29:3607–3620. doi: 10.1038/emboj.2010.237. - DOI - PMC - PubMed

LinkOut - more resources