. 2022 Nov 1:27:431-449.
doi: 10.1016/j.omtm.2022.10.016. eCollection 2022 Dec 8.

Population-wide gene disruption in the murine lung epithelium via AAV-mediated delivery of CRISPR-Cas9 components

Affiliations

Population-wide gene disruption in the murine lung epithelium via AAV-mediated delivery of CRISPR-Cas9 components

Honglin Chen et al. Mol Ther Methods Clin Dev. .

Abstract

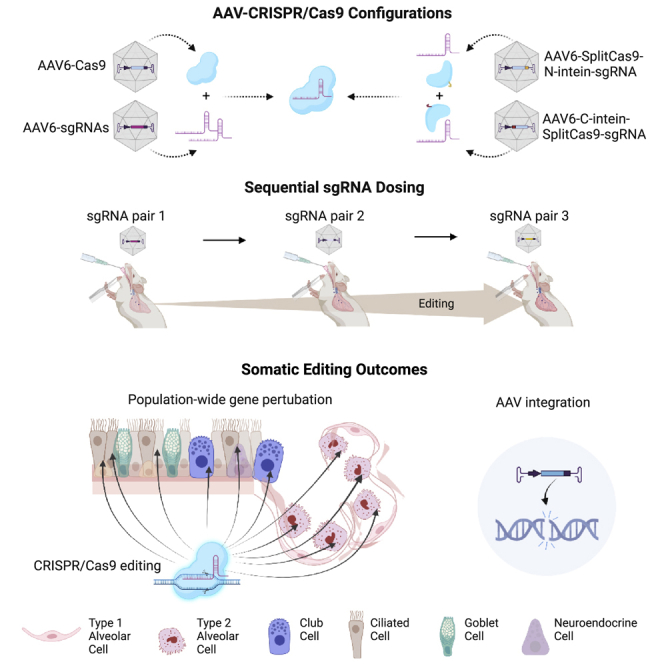
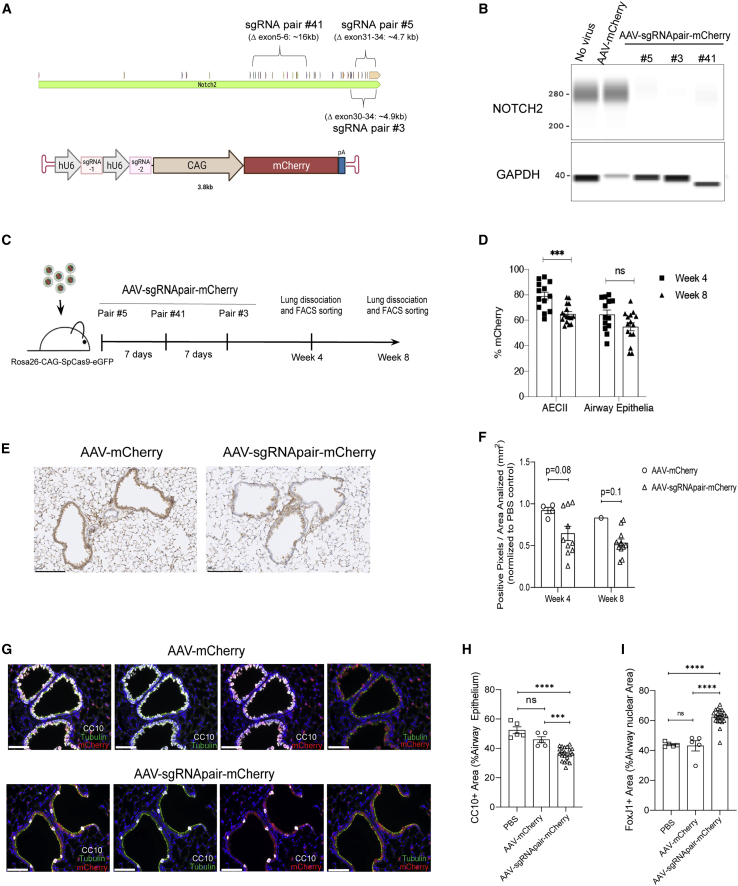
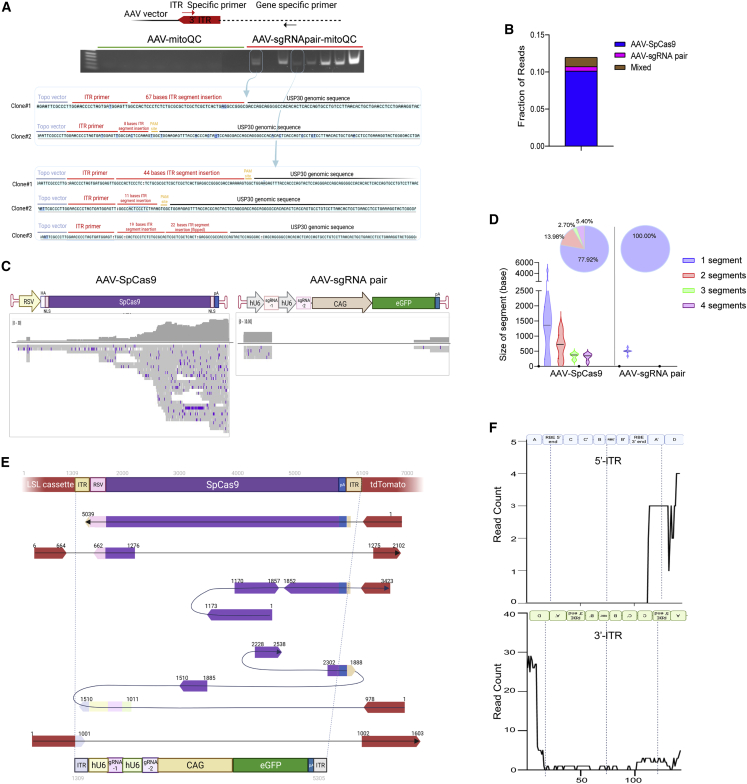
With the aim of expediting drug target discovery and validation for respiratory diseases, we developed an optimized method for in situ somatic gene disruption in murine lung epithelial cells via AAV6-mediated CRISPR-Cas9 delivery. Efficient gene editing was observed in lung type II alveolar epithelial cells and distal airway cells following assessment of single- or dual-guide AAV vector formats, Cas9 variants, and a sequential dosing strategy with combinatorial guide RNA expression cassettes. In particular, we were able to demonstrate population-wide gene disruption within distinct epithelial cell types for separate targets in Cas9 transgenic animals, with minimal to no associated inflammation. We also observed and characterized AAV vector integration events that occurred within directed double-stranded DNA break sites in lung cells, highlighting a complicating factor with AAV-mediated delivery of DNA nucleases. Taken together, we demonstrate a uniquely effective approach for somatic engineering of the murine lung, which will greatly facilitate the modeling of disease and therapeutic intervention.

Keywords: AAV; CRISPR; Cas9; adeno-associated virus; disease modeling; gene editing; genome integration; inflammatory response; lung epithelium; viral delivery.


Conflict of interest statement

During the course of these studies, all authors were full-time employees of Genentech, Inc., and potential shareholders of Roche. No other disclosures were reported.

Figures

None
Graphical abstract
Figure 1
Figure 1
Profiling AAV6 transduction in murine lung (A) Quantification of GFP expression within cells dosed with increasing titers of AAV6-CAG-GFP. IF staining of GFP and various cell markers were performed on paraffin-embedded lung tissue harvested at week 1 after delivery of AAV6-CAG-GFP. Lung sections containing five lung lobes were quantified for each animal. n = 5. Error bars represent SEM. (B) Representative IF images showing GFP stained in green, mCherry in red, cell markers (SPC, CC10, and acetyl-alpha tubulin, respectively) in white, and nuclei (DAPI) in blue on paraffin-embedded lung sections. Animals were co-transduced with AAV6-CAG-GFP and AAV6-CAG-mCherry at 4 × 1012 vg/virus/mouse. Lung tissues were harvested at week 1 after infection. Scale bars, 500 μm. The yellow box shows the zoomed-in region. Scale bars, 50 μm (inset). (C) Quantification of the colocalization of GFP, mCherry, and cell markers. IF staining of GFP, mCherry, and various cell markers was performed on paraffin-embedded lung tissue harvested at week 1 after co-transduction of AAV reporter viruses (GFP and mCherry). Lung sections containing five lung lobes were quantified for each animal. n = 5. Error bars represent SEM. (D) The composition of lung cell types presented in GFP– versus GFP+ samples as shown in the pie charts. (E) The percentage of each lung cell type presented in GFP– versus GFP+ samples.
Figure 2
Figure 2
Somatic editing in Rosa26-LSL-tdTomato mice by dual AAV delivery of Cas9 and sgRNA pair (A) Schematic of somatic editing outcomes. Upon the delivery of AAV vectors, CRISPR-Cas9-mediated genome editing can lead to the formation of indels and deletion of the LSL cassette, which leads to tdTomato expression. (B) Two dual vector designs (configurations 1 and 2) to deliver the CRISPR/SpCas9 components. The genetic components were colored and labeled. The size of each vector was listed under the vector. (C) Indel analysis of sgRNA pair 1 in animals received one dose of AAV-SpCas9/sgRNA pair or AAV-split Cas9/sgRNA pair. %Indels formation at the two on-target sites (left panel: left sgRNA; right panel: right sgRNA) was examined in the sorted AECII and airway epithelial cells at week 3 after intubation of AAV at 2 × 1012 vg/mouse (n = 5–6). Each dot represents one animal. Error bars represent SEM. ∗p < 0.05; n.s., not significant. (D) Representative IF images of tdTomato and GFP staining of paraffin-embedded lung tissues collected at week 3 after the first round of AAV intubation. GFP stained in green, tdTomato stained in red. Cell nuclei stained by DAPI in blue. Scale bars, 200 μm. (E) Quantification of %tdTomato expression in sorted AECII and airway epithelial cells at week 3 after the intubation of the AAV-SpCas9/sgRNA pair or the AAV-SplitCas9/sgRNA pair. Data determined by two methods are shown: upper panel, FACS analysis. %tdTomato expression was quantified in AECII lineage marker-positive cells and integrin β4-positive cells, respectively. n = 4–6; lower panel, IF staining. %tdTomato expression was quantified in cells stained positive for SPC (AECII marker) and CC10 (club cell marker), respectively. n = 3. Each dot represents one animal. Error bars represent SEM. ∗p < 0.05, ∗∗p < 0.01, ∗∗∗p < 0.001. (F) Quantification of %GFP and %tdTomato/GFP double expression in sorted AECII and distal airway epithelial cells at week 3 after the first round of AAV intubation. Data determined by two methods are shown: upper panel, FACS analysis. %tdTomato expression was quantified in AECII lineage marker-positive cells and integrin β4-positive cells, respectively. n = 6–7; lower panel, IF staining. %tdTomato expression was quantified in cells stained positive for SPC (AECII marker) and CC10 (club cell marker), respectively. n = 3–6. Each dot represents one animal. ∗p < 0.05; n.s., not significant. (G) ddPCR analysis of the ITR region of the AAV vectors. The genome copy per cell was analyzed for AECII and distal airway epithelial cells sorted from the animals in (D). n = 8–10. Each dot represents one animal. Error bars represent SEM. ∗p < 0.05, ∗∗p < 0.01, ∗∗∗p < 0.001; n.s., not significant.
Figure 3
Figure 3
Highly efficient USP30 depletion on a populational level in murine lung epithelium (A) Schematic of Usp30 genomic targeting sites by the sgRNA pairs (upper panel) and the AAV vector design carrying dual sgRNA cassettes and a mitoQC fluorescent reporter (lower panel). (B) The sgRNA pairs effectively downregulated USP30 protein expression in MLE-12-SpCas9 cells. Cells were infected by a single AAV at a multiplicity of infection (MOI) of 1 × 106 vg or three AAVs combined (each at an MOI of 1 × 106 vg). Proteins were extracted from the pooled cell population (without selection) at day 7 after infection and subject to western blot analysis. (C) Schematic of animal study design. Three rounds of AAV at 2 × 1012 vg/mouse/round were delivered to Rosa26-CAG-SpCas9-mKate2 transgenic mice with 7 days apart. Animals were taken down at weeks 5 and 8 after the first round of AAV delivery for analysis. (D) AAV transduction efficiency in cell types of interest as measured by %mitoQC expression. FACS analysis of %mitoQC expression at week 5 (n = 9) and week 8 (n = 8) after the first round of AAV delivery in AECII and distal airway epithelial cells. Each dot presents one animal. Error bars represent SEM. ∗∗∗p < 0.001; n.s., not significant. (E) USP30 protein downregulation in sorted AECII at week 8 after the first round of AAV delivery. GAPDH served as the housekeeping control. The digital images of the capillary electrophoresis immunoblotting of USP30 and GAPDH are shown. (F) Quantification of USP30 protein expression shown in (E). ImageJ was used to quantify the total pixel signal of USP30 and GAPDH. The pixel signal of USP30 was normalized to that of GAPDH. n = 10–15. Each dot presents one animal. Error bars represent SEM. ∗∗p < 0.01.
Figure 4
Figure 4
CRISPR/SpCas9-mediated NOTCH2 knockdown led to efficient trans-differentiation of club cells into ciliated cells (A) Schematic of Notch2 genomic targeting sites by sgRNA pairs (upper panel) and the AAV vector design carrying the paired sgRNA cassette and an mCherry reporter (lower panel). (B) The sgRNA pairs effectively downregulated NOTCH2 expression in MLE-12-SpCas9 cells. Cells were infected by a single AAV at an MOI of 1 × 106 or three AAVs combined (each at an MOI = 1 × 106). Proteins were extracted from the pooled cell population (without selection) on day 7 after infection and subjected to capillary protein analysis. (C) Schematic of animal study design. Three sequential doses of AAV-Notch2-sgRNA pairs at 4 × 1012 vg/mouse/round were delivered to Rosa26-CAG-SpCas9-eGFP transgenic mice at 7-day intervals. Animals were taken down for analysis at weeks 4 or 8 after the first round of infection. (D) AAV transduction efficiency in cell types of interest as measured by %mCherry expression. FACS analysis of %mCherry expression at week 4 (n = 13) and week 8 (n = 16) after the first round of sgRNA pair delivery in AECII and distal airway epithelial cells. Each dot represents one animal. Error bars represent SEM. ∗∗∗p < 0.001; n.s., not significant. (E) Representative NOTCH2 IHC staining of the paraffin-embedded lung tissue from the control group (left picture) and treatment group (right picture) at week 4 time point. Scale bars, 200 μm. (F) Quantification of NOTCH2 expression by IHC at weeks 4 and 8 time points. Data represented the NOTCH2 protein level of the whole lung tissue (not specific to AECII, club, and ciliated cells). Data were normalized to the PBS control animals. Each dot represents one animal. Error bars represent SEM. p values are indicated. (G) Representative IF images of club and ciliated cells at the week 4 time point. Club cells stained in white (CC10: a cell marker for club cells); ciliated cells stained in green (acetylated alpha-tubulin: a cell marker for ciliated cells). mCherry stained red. mCherry expression was an indicator of AAV-infected cells. Cell nuclei stained by DAPI in blue. Scale bars, 200 μm. (H) Quantification of club cells as stained by the cell marker CC10 (CC10+ area). Data were pooled from weeks 4 and 8 time points. Each dot represents one animal. Error bars represent SEM. ∗∗∗p < 0.001, ∗∗∗∗p < 0.0001; n.s., not significant. (I) Quantification of ciliated cells as stained by the nuclear marker FoxJ1 (FoxJ1+ area). Data was pooled from weeks 4 and 8 time points. Each dot represents one animal. Error bars represent SEM. ∗∗∗∗p < 0.0001; n.s., not significant.
Figure 5
Figure 5
Characterization of AAV integration at the CRISPR-Cas9 on-target site (A) PCR analysis of ITR-genomic fusion events in sorted AECII from animals treated with three doses of AAV or AAV-sgRNA pair targeting Usp30 (Figure 3C). Upper panel: schematic of primer design; middle panel: PCR amplification of ITR-genomic fusion events as shown in 2% agarose gel. Lower panel: representative individual AAV ITR integration clones by TOPO cloning of the amplified PCR products (indicated by arrows) were shown. The integrated ITR segments were underscored by red lines. The Usp30 genomic sequence was underscored by black lines. The CRISPR-Cas9 PAM site was underscored by orange lines. The Topo vector sequence was underscored by blue lines. (B) Quantification of ONT reads mapped to the tdTomato genomic locus that were also mapped to the AAV vector genome. (C) Integrated genomic view of the sequence alignments to the reference AAV vector genome. The upper track showed the position of genetic elements within each AAV vector genome; the lower track showed the coverage and read alignments. (D) Characterization of the integrated vector segments. Top panel: pie chart showed the composition of vector segments. Lower panel: violin plot showed the size distribution of the integrated vector segments. (E) Representative examples of AAV vector genome integration events. The reference sequence is composed of the genomic locus with AAV-SpCas9 (top) or AAV-LSL-sgRNA pair (bottom) vector inserted within the CRISPR-Cas9 on-target site. The genomic sequence is colored red. AAV vectors are annotated with different genetic components in distinct colors. Each AAV-genomic fusion read is plotted under the reference genome in the corresponding alignment position and orientation. The sequence of the fusion read is indicated by a line labeled with nucleotide positions. Rearrangement events were visualized in the order of appearance and connected by curved links. (F) Coverage analysis of ITR segments presented in ITR-tdTomato fusion junctions. The data were plotted based on all integration events from both AAV-SpCas9 and AAV-LSL-sgRNA pair vectors.

References

    1. Gao G.-P., Alvira M.R., Wang L., Calcedo R., Johnston J., Wilson J.M. Novel adeno-associated viruses from rhesus monkeys as vectors for human gene therapy. Proc. Natl. Acad. Sci. USA. 2002;99:11854–11859. doi: 10.1073/pnas.182412299. - DOI - PMC - PubMed
    1. Gao G., Vandenberghe L.H., Alvira M.R., Lu Y., Calcedo R., Zhou X., Wilson J.M. Clades of adeno-associated viruses are widely disseminated in human tissues. J. Virol. 2004;78:6381–6388. doi: 10.1128/jvi.78.12.6381-6388.2004. - DOI - PMC - PubMed
    1. Inagaki K., Fuess S., Storm T.A., Gibson G.A., Mctiernan C.F., Kay M.A., Nakai H. Robust systemic transduction with AAV9 vectors in mice: efficient global cardiac gene transfer superior to that of AAV8. Mol. Ther. 2006;14:45–53. doi: 10.1016/j.ymthe.2006.03.014. - DOI - PMC - PubMed
    1. Pacak C.A., Mah C.S., Thattaliyath B.D., Conlon T.J., Lewis M.A., Cloutier D.E., Zolotukhin I., Tarantal A.F., Byrne B.J. Recombinant adeno-associated virus serotype 9 leads to preferential cardiac transduction in vivo. Circ. Res. 2006;99:e3–e9. doi: 10.1161/01.res.0000237661.18885.f6. - DOI - PubMed
    1. Kurosaki F., Uchibori R., Mato N., Sehara Y., Saga Y., Urabe M., Mizukami H., Sugiyama Y., Kume A. Optimization of adeno-associated virus vector-mediated gene transfer to the respiratory tract. Gene Ther. 2017;24:290–297. doi: 10.1038/gt.2017.19. - DOI - PubMed

LinkOut - more resources