

A Mobile Phone Application for Assessing Daily Variation in Pain Location and Pain Intensity in Patients with Urologic Chronic Pelvic Pain Syndrome: A MAPP Network Study
- PMID: 36419906
- PMCID: PMC9662822
- DOI: 10.1097/UPJ.0000000000000203
A Mobile Phone Application for Assessing Daily Variation in Pain Location and Pain Intensity in Patients with Urologic Chronic Pelvic Pain Syndrome: A MAPP Network Study
Abstract
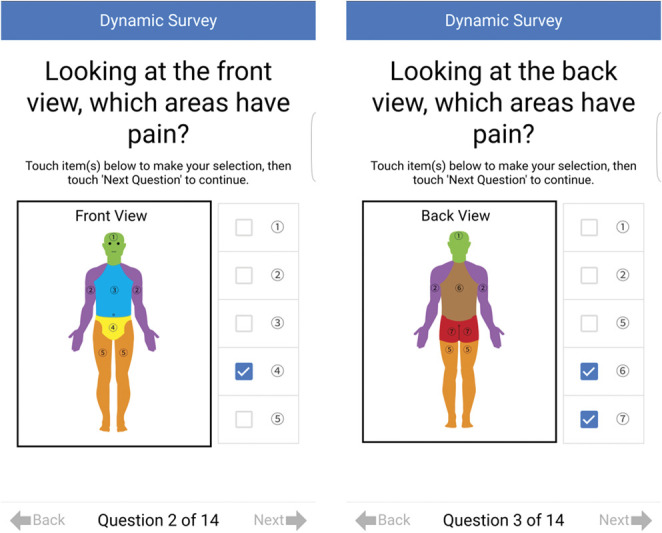
Introduction: We created and tested a mobile app that facilitates the ecological momentary assessment of pain intensity and pain location and identifies heterogeneous patient pain phenotypes.
Methods: A mobile app was created with patient, clinician and researcher input. A sample of 20 participants with urologic chronic pelvic pain syndrome were then asked to complete a 14-day pain assessment using the app. Data were analyzed to assess compliance, usability and the ability for the app to capture variation in pain intensity and pain location. Ecological momentary assessment pain data were then compared to end-of-week pain summary questions to determine construct validity.
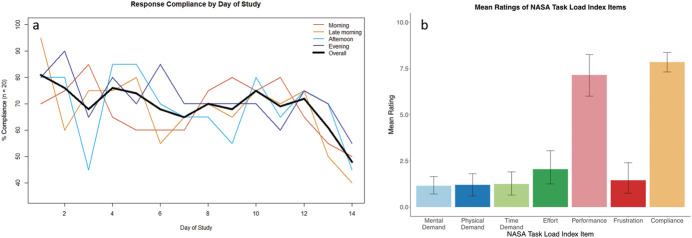
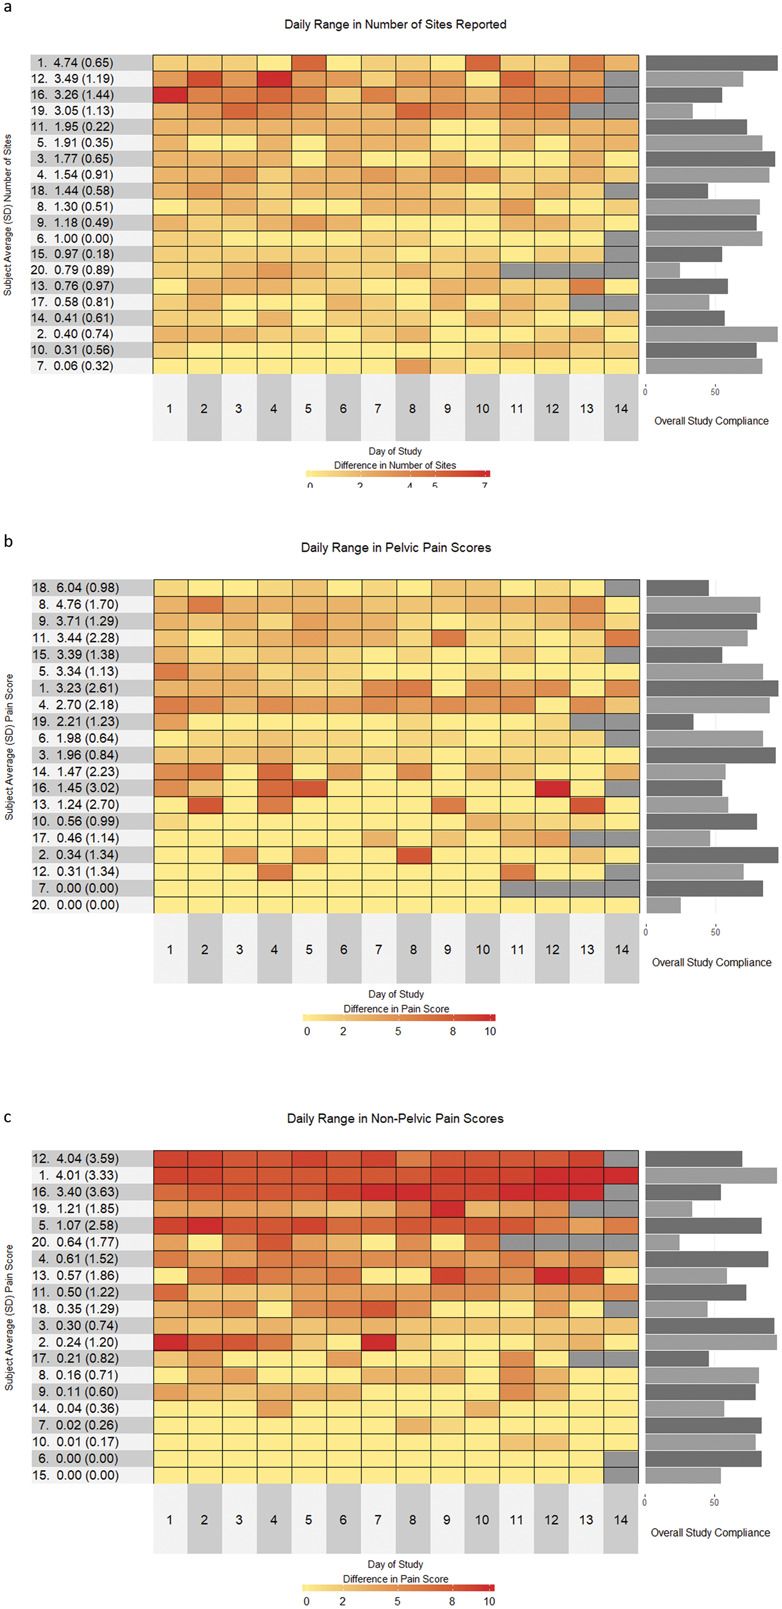
Results: Mean compliance was 70±8%, higher earlier in the study period (p <0.0005) and better in older individuals (p <0.0001). During the 14-day assessment, 90% of participants reported daily variation in pelvic pain intensity (SD 0.64-3.02; out of 10), 95% reported variation in their nonpelvic pain (SD 0.17-3.63; out of 10) and 100% reported variations in number of sites with pain (SD 0.22-1.44; out of 7). Pelvic pain and nonpelvic pain intensity, as determined by cumulative app scores, were associated with patient reported end-of-week scores; worst pain (r pelvic =0.67; r nonpelvic =0.53) and average pain (r pelvic =0.78; r nonpelvic =0.73).
Conclusions: The easy-to-use app captured unique patterns of pain not fully captured by traditional end-of-day/week summary questions or by traditional in-office assessments. Mobile apps for assessing chronic conditions will become increasingly important as telehealth becomes more commonplace.
Keywords: data collection; ecological momentary assessment; mobile applications; prostatitis.
© 2021 by American Urological Association Education and Research, Inc.
Figures
Similar articles
-
Ecological momentary assessment of pelvic pain and urinary urgency variability in urologic chronic pelvic pain syndrome and their association with illness impact and quality of life: Findings from the multidisciplinary approach to the study of chronic pelvic pain symptom patterns study.Neurourol Urodyn. 2024 Apr;43(4):893-901. doi: 10.1002/nau.25363. Epub 2024 Jan 22. Neurourol Urodyn. 2024. PMID: 38247366 Free PMC article.
-
User-Centered Development of a Mobile App for Biopsychosocial Pain Assessment in Adults: Usability, Reliability, and Validity Study.JMIR Mhealth Uhealth. 2021 May 14;9(5):e25316. doi: 10.2196/25316. JMIR Mhealth Uhealth. 2021. PMID: 33988515 Free PMC article.
-
Mood and Stress Evaluation of Adult Patients With Moyamoya Disease in Korea: Ecological Momentary Assessment Method Using a Mobile Phone App.JMIR Mhealth Uhealth. 2020 May 25;8(5):e17034. doi: 10.2196/17034. JMIR Mhealth Uhealth. 2020. PMID: 32449687 Free PMC article.
-
Possible Application of Ecological Momentary Assessment to Older Adults' Daily Depressive Mood: Integrative Literature Review.JMIR Ment Health. 2020 Jun 2;7(6):e13247. doi: 10.2196/13247. JMIR Ment Health. 2020. PMID: 32484442 Free PMC article. Review.
-
Mobile Apps to Reduce Tobacco, Alcohol, and Illicit Drug Use: Systematic Review of the First Decade.J Med Internet Res. 2020 Nov 24;22(11):e17156. doi: 10.2196/17156. J Med Internet Res. 2020. PMID: 33231555 Free PMC article.
Cited by
-
Symptomatic and functional recovery after transurethral resection of bladder tumor: Data from ecological momentary symptom assessment.Urol Oncol. 2024 Apr;42(4):117.e1-117.e10. doi: 10.1016/j.urolonc.2023.12.007. Epub 2024 Feb 17. Urol Oncol. 2024. PMID: 38369443 Free PMC article.
-
Associations Between Urological Chronic Pelvic Pain Syndrome Symptom Flares, Illness Impact, and Health Care Seeking Activity: Findings From the Multidisciplinary Approach to the Study of Chronic Pelvic Pain Symptom Patterns Study.J Urol. 2023 Jan 11:101097JU0000000000003155. doi: 10.1097/JU.0000000000003155. Online ahead of print. J Urol. 2023. PMID: 36630590 Free PMC article.
-
Validation of a simple body map to measure widespread pain in urologic chronic pelvic pain syndrome: A MAPP Research Network study.Neurourol Urodyn. 2024 Mar;43(3):727-737. doi: 10.1002/nau.25400. Epub 2024 Jan 25. Neurourol Urodyn. 2024. PMID: 38270336 Free PMC article.
-
Ecological momentary assessment of pelvic pain and urinary urgency variability in urologic chronic pelvic pain syndrome and their association with illness impact and quality of life: Findings from the multidisciplinary approach to the study of chronic pelvic pain symptom patterns study.Neurourol Urodyn. 2024 Apr;43(4):893-901. doi: 10.1002/nau.25363. Epub 2024 Jan 22. Neurourol Urodyn. 2024. PMID: 38247366 Free PMC article.
References
Grants and funding
LinkOut - more resources
Full Text Sources
