. 2022 Nov 7:13:1041764.
doi: 10.3389/fpls.2022.1041764. eCollection 2022.

Regulation of Na+/H+ exchangers, Na+/K+ transporters, and lignin biosynthesis genes, along with lignin accumulation, sodium extrusion, and antioxidant defense, confers salt tolerance in alfalfa

Affiliations

Regulation of Na+/H+ exchangers, Na+/K+ transporters, and lignin biosynthesis genes, along with lignin accumulation, sodium extrusion, and antioxidant defense, confers salt tolerance in alfalfa

Md Atikur Rahman et al. Front Plant Sci. .

Abstract

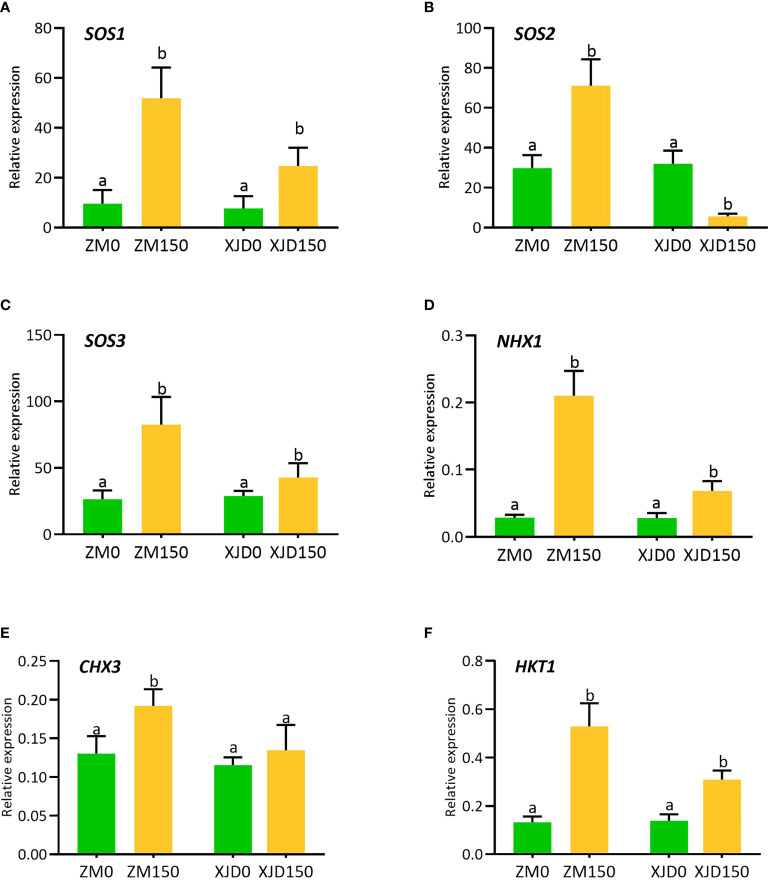
Accumulation of high sodium (Na+) leads to disruption of metabolic processes and decline in plant growth and productivity. Therefore, this study was undertaken to clarify how Na+/H+ exchangers and Na+/K+ transporter genes contribute to Na+ homeostasis and the substantial involvement of lignin biosynthesis genes in salt tolerance in alfalfa (Medicago sativa L.), which is poorly understood. In this study, high Na+ exhibited a substantial reduction of morphophysiological indices and induced oxidative stress indicators in Xingjiang Daye (XJD; sensitive genotype), while Zhongmu (ZM; tolerant genotype) remained unaffected. The higher accumulation of Na+ and the lower accumulation of K+ and K+/(Na+ + K+) ratio were found in roots and shoots of XJD compared with ZM under salt stress. The ZM genotype showed a high expression of SOS1 (salt overly sensitive 1), NHX1 (sodium/hydrogen exchanger 1), and HKT1 (high-affinity potassium transporter 1), which were involved in K+ accumulation and excess Na+ extrusion from the cells compared with XJD. The lignin accumulation was higher in the salt-adapted ZM genotype than the sensitive XJD genotype. Consequently, several lignin biosynthesis-related genes including 4CL2, CCoAOMT, COMT, CCR, C4H, PAL1, and PRX1 exhibited higher mRNA expression in salt-tolerant ZM compared with XJD. Moreover, antioxidant enzyme (catalase, superoxide dismutase, ascorbate peroxidase, and glutathione reductase) activity was higher in ZM relative to XJD. This result suggests that high antioxidant provided the defense against oxidative damages in ZM, whereas low enzyme activity with high Na+ triggered the oxidative damage in XJD. These findings together illustrate the ion exchanger, antiporter, and lignin biosysthetic genes involving mechanistic insights into differential salt tolerance in alfalfa.

Keywords: abiotic stress; antioxidant defense; ion exchanger; phenylpropanoid; salinity stress; sodium transporter.


Conflict of interest statement

The authors declare that the research was conducted in the absence of any commercial or financial relationships that could be construed as a potential conflict of interest.

Figures

Figure 1
Figure 1
The variation of morphological and physiological indices in two contrasting alfalfa genotypes in response to salt stress. Different plant phenotypes (A), SPAD score (B), Fv/Fm (C), RWC% (D), Root DW (E), and Shoot DW (F), changes in Zhongmu (ZM) and Xingjiang Daye (XJD) under salt stress. The numeric zero (0) indicates salt-untreated (control) plant, while the numeric 150 indicates 150 mM salt treatment. Different letters above the column bar indicate significant differences among the means ± SD of treatments (n = 3). Data were analyzed by ANOVA and Tukey’s tests at p ≤ 0.05 significant level.
Figure 2
Figure 2
Accumulation of superoxide radical ( O2 ) and hydrogen peroxide (H2O2) in two contrasting alfalfa roots in response to salt stress. Visualization of fluorescence of O2 -specific probe dihydroethidium (DHE) (A) and H2O2-specific probe 2,7-dichlorofluorescein diacetate (DCF-DA) in root tips (B). Fluorescence intensity of O2 (C), and H2O2 (D). The O2 and H2O2 are automatically measured by florescent microscope (CLS-01-00076, Logos Biosystem, Inc., South Korea). Pictures of stained roots were taken at 20× magnification. Scale bar = 100 μm. Different letters above the column bar indicate significant differences among the means ± SD of treatments (n = 3). Data were analyzed by ANOVA and Tukey’s tests at p ≤ 0.05 significant level.
Figure 3
Figure 3
Elemental concentration in two contrasting alfalfa under salt stress. The Na+ in roots (A), Na+ in shoots (B), K+ in roots (C), K+ in shoots (D), K+/(Na+ + K+) ratio in roots (E), and K+/(Na+ + K+) ratio in shoots (F), in Zhongmu (ZM) and Xingjiang Daye (XJD) under salt stress. The numeric zero (0) indicates salt-untreated (control) plant, while the numeric 150 indicates 150 mM salt treatment. Different letters above the column bar indicate significant differences among the means ± SD of treatments (n = 3). Data were analyzed by ANOVA and Tukey’s tests at p ≤ 0.05 significant level.
Figure 4
Figure 4
Lignin accumulation in two contrasting alfalfa under salt stress. Regulation of lignin in roots (A), stems (B), and leaves (C) of Zhongmu (ZM) and Xingjiang Daye (XJD) under salt stress. The numeric zero (0) indicates salt-untreated (control) plant, while the numeric 150 indicates 150 mM salt treatment. Different letters above the column bar indicate significant differences among the means ± SD of treatments (n = 3). Data were analyzed by ANOVA and Tukey’s tests at p ≤ 0.05 significant level.
Figure 5
Figure 5
Transcript levels of Na+/H+ exchanger and Na+/K+ transporter genes involved in Na+ extrusion, K+ uptake, and translocation in two contrasting alfalfa under salt stress. Relative expression of SOS1 (A), SOS2 (B), SOS3 (C), NHX1 (D), CHX3 (E), and HKT1 (F) in roots of Zhongmu (ZM) and Xingjiang Daye (XJD) under salt stress. MsActin gene was used to normalize the transcript abundance. The numeric zero (0) indicates salt-untreated (control) plant, while the numeric 150 indicates 150 mM salt treatment. Different letters above the column bar indicate significant differences among the means ± SD of treatments (n = 3). Data were analyzed by ANOVA and Tukey’s tests at p ≤ 0.05 significant level.
Figure 6
Figure 6
Transcript levels of various genes involved in lignin biosynthesis pathways as influenced by salt stress in two contrasting alfalfa. Relative expression of 4CL2 (A), HCT (B), CCoAOMT (C), CAD (D), COMT (E), CCR (F), C4H (G), PAL1 (H), and PRX1 (I) in roots of Zhongmu (ZM) and Xingjiang Daye (XJD) under salt stress. MsActin gene was used to normalize the transcript abundance. The numeric zero (0) indicates salt-untreated (control) plant, while the numeric 150 indicates 150 mM salt treatment. Different letters above the column bar indicate significant differences among the means ± SD of treatments (n = 3). Data were analyzed by ANOVA and Tukey’s tests at p ≤ 0.05 significant level.
Figure 7
Figure 7
The phenylpropanoid (PP) and lignin-specific pathways as influenced by salt stress in alfalfa genotypes. Blue color indicates the genes were upregulated in Zhongmu (ZM) and/or Xingjiang Daye (XJD) under salt stress. The genes that did not show significant changes in expression are indicated in black color. PAL, phenylalanine ammonia-lyase; C4H, cinnamate 4-hydroxylase; 4CL, 4-coumarate CoA ligase; CHS, chalcone synthase; HCT, hydroxycinnamoyl CoA:shikimate/quinate hydroxycinnamoyl transferase; CCoAOMT, caffeoyl CoA 3-O-methyltransferase; F5H, ferulate 5-hydroxylase; COMT, caffeic acid O-methyl transferase; CCR, cinnamoyl CoA reductase; CAD, cinnamyl alcohol dehydrogenase; PRX, peroxidase.
Figure 8
Figure 8
Regulation of osmolytes and antioxidant enzymes in two contrasting alfalfa under salt stress. Regulation of proline (A), soluble sugar (B), SOD (C), CAT (D), APX (E), and GR (F) in Zhongmu (ZM) and Xingjiang Daye (XJD) under salt stress. The numeric zero (0) indicates salt-untreated (control) plant, while the numeric 150 indicates 150 mM salt treatment. Different letters above the column bar indicate significant differences among the means ± SD of treatments (n = 3). Data were analyzed by ANOVA and Tukey’s tests at p ≤ 0.05 significant level.

References

    1. Ali A., Maggio A., Bressan R. A., Yun D. J. (2019). Role and functional differences of HKT1-type transporters in plants under salt stress. Int. J. Mol. Sci. 20 (5), 1059. doi: 10.3390/ijms20051059 - DOI - PMC - PubMed
    1. Almeida D. M., Oliveira M. M., Saibo N. J. M. (2017). Regulation of na+ and k+ homeostasis in plants: Towards improved salt stress tolerance in crop plants. Genet. Mol. Biol. 40, 326–345. doi: 10.1590/1678-4685-gmb-2016-0106 - DOI - PMC - PubMed
    1. Arif Y., Singh P., Siddiqui H., Bajguz A., Hayat S. (2020). Salinity induced physiological and biochemical changes in plants: An omic approach towards salt stress tolerance. Plant Physiol. Biochem. 156, 64–77. doi: 10.1016/j.plaphy.2020.08.042 - DOI - PubMed
    1. Bates L. S., Waldren R. P., Teare I. D. (1973). Rapid determination of free proline for water-stress studies. Plant Soil 39 (1), 205–207. doi: 10.1007/BF00018060 - DOI
    1. Betzen B. M., Smart C. M., Maricle K. L., MariCle B. R. (2019). Effects of increasing salinity on photosynthesis and plant water potential in kansas salt marsh species. Transac. Kansas Acad. Sci. 122(1-2), 49–58, 10. doi: 10.1660/062.122.0105 - DOI