

Evaluation of single-cell RNA-seq clustering algorithms on cancer tumor datasets
- PMID: 36420149
- PMCID: PMC9677128
- DOI: 10.1016/j.csbj.2022.10.029
Evaluation of single-cell RNA-seq clustering algorithms on cancer tumor datasets
Abstract
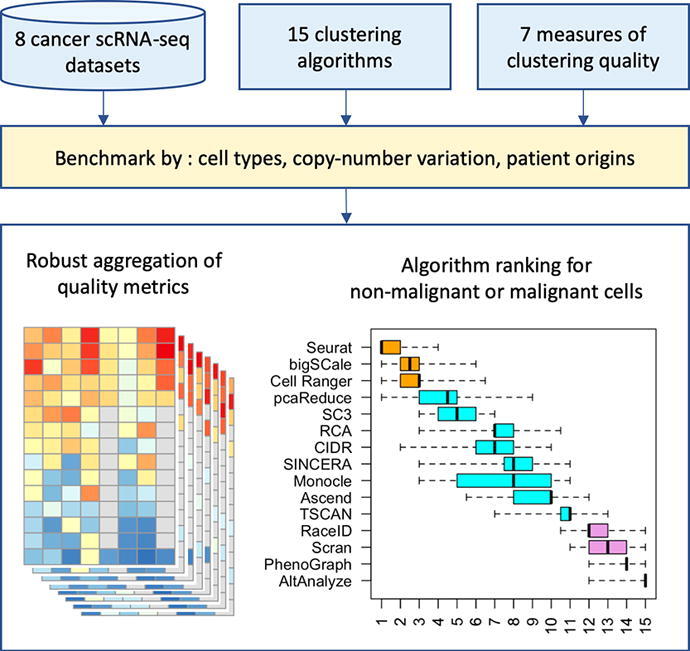
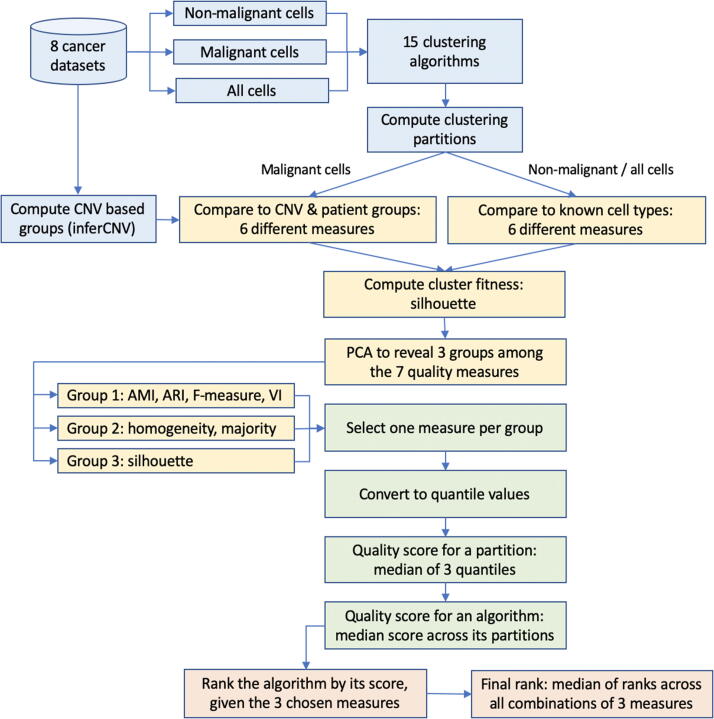
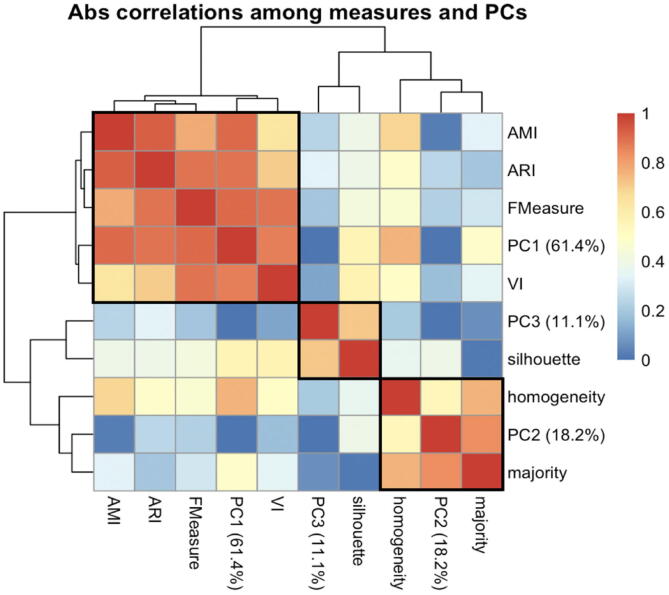
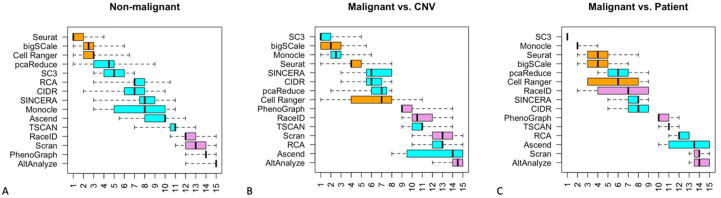
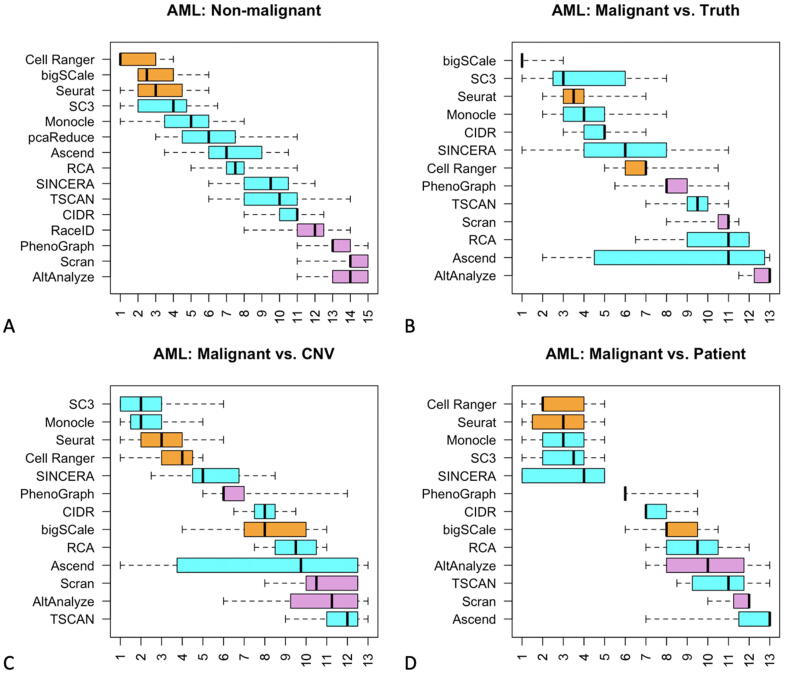
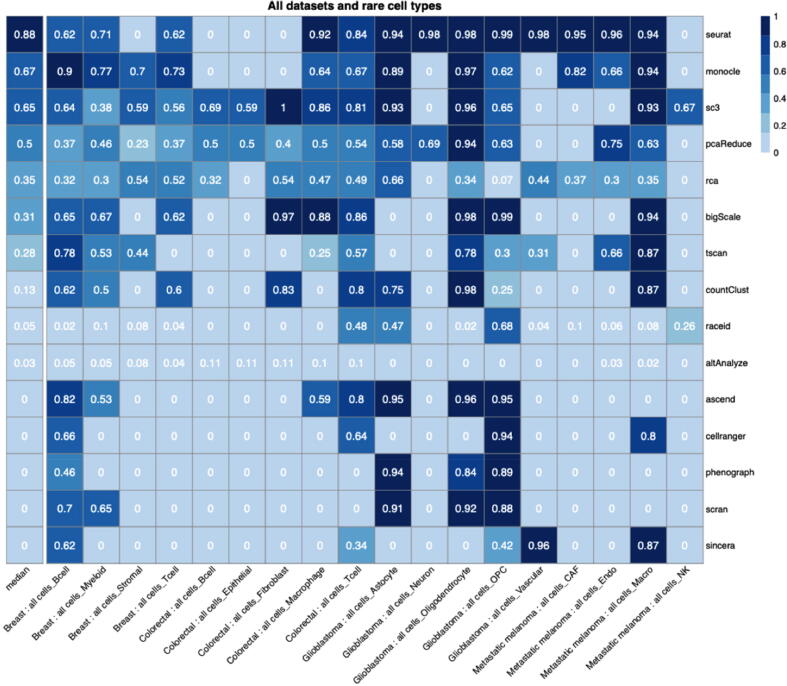
Tumors are complex biological entities that comprise cell types of different origins, with different mutational profiles and different patterns of transcriptional dysregulation. The exploration of data related to cancer biology requires careful analytical methods to reflect the heterogeneity of cell populations in cancer samples. Single-cell techniques are now able to capture the transcriptional profiles of individual cells. However, the complexity of RNA-seq data, especially in cancer samples, makes it challenging to cluster single-cell profiles into groups that reflect the underlying cell types. We have developed a framework for a systematic examination of single-cell RNA-seq clustering algorithms for cancer data, which uses a range of well-established metrics to generate a unified quality score and algorithm ranking. To demonstrate this framework, we examined clustering performance of 15 different single-cell RNA-seq clustering algorithms on eight different cancer datasets. Our results suggest that the single-cell RNA-seq clustering algorithms fall into distinct groups by performance, with the highest clustering quality on non-malignant cells achieved by three algorithms: Seurat, bigSCale and Cell Ranger. However, for malignant cells, two additional algorithms often reach a better performance, namely Monocle and SC3. Their ability to detect known rare cell types was also among the best, along with Seurat. Our approach and results can be used by a broad audience of practitioners who analyze single-cell transcriptomic data in cancer research.
Keywords: Automated algorithms; Cancer; Clustering; Framework; Single-Cell RNA-seq.
© 2022 Published by Elsevier B.V. on behalf of Research Network of Computational and Structural Biotechnology.
Conflict of interest statement
The authors declare that they have no known competing financial interests or personal relationships that could have appeared to influence the work reported in this paper.
Figures

Similar articles
-
Impact of data preprocessing on cell-type clustering based on single-cell RNA-seq data.BMC Bioinformatics. 2020 Oct 7;21(1):440. doi: 10.1186/s12859-020-03797-8. BMC Bioinformatics. 2020. PMID: 33028196 Free PMC article.
-
Impact of similarity metrics on single-cell RNA-seq data clustering.Brief Bioinform. 2019 Nov 27;20(6):2316-2326. doi: 10.1093/bib/bby076. Brief Bioinform. 2019. PMID: 30137247
-
Autoencoder-based cluster ensembles for single-cell RNA-seq data analysis.BMC Bioinformatics. 2019 Dec 24;20(Suppl 19):660. doi: 10.1186/s12859-019-3179-5. BMC Bioinformatics. 2019. PMID: 31870278 Free PMC article.
-
A systematic performance evaluation of clustering methods for single-cell RNA-seq data.F1000Res. 2018 Jul 26;7:1141. doi: 10.12688/f1000research.15666.3. eCollection 2018. F1000Res. 2018. PMID: 30271584 Free PMC article.
-
Evaluating the performance of dropout imputation and clustering methods for single-cell RNA sequencing data.Comput Biol Med. 2022 Jul;146:105697. doi: 10.1016/j.compbiomed.2022.105697. Epub 2022 Jun 8. Comput Biol Med. 2022. PMID: 35697529 Review.
Cited by
-
Data-driven selection of analysis decisions in single-cell RNA-seq trajectory inference.bioRxiv [Preprint]. 2023 Dec 19:2023.12.18.572214. doi: 10.1101/2023.12.18.572214. bioRxiv. 2023. Update in: Brief Bioinform. 2024 Mar 27;25(3):bbae216. doi: 10.1093/bib/bbae216. PMID: 38187768 Free PMC article. Updated. Preprint.
-
Serial single-cell RNA sequencing unveils drug resistance and metastatic traits in stage IV breast cancer.NPJ Precis Oncol. 2024 Oct 3;8(1):222. doi: 10.1038/s41698-024-00723-6. NPJ Precis Oncol. 2024. PMID: 39363009 Free PMC article.
-
A method for in silico exploration of potential glioblastoma multiforme attractors using single-cell RNA sequencing.Sci Rep. 2024 Oct 29;14(1):26003. doi: 10.1038/s41598-024-74985-2. Sci Rep. 2024. PMID: 39472601 Free PMC article.
References
-
- Hanahan D., Weinberg R.A. Hallmarks of cancer: the next generation. Cell. 2011;144:646–674. - PubMed
LinkOut - more resources
Full Text Sources