. 2022 Nov 4:13:1039765.
doi: 10.3389/fimmu.2022.1039765. eCollection 2022.

Distinction of early complement classical and lectin pathway activation via quantification of C1s/C1-INH and MASP-1/C1-INH complexes using novel ELISAs

Collaborators, Affiliations

Distinction of early complement classical and lectin pathway activation via quantification of C1s/C1-INH and MASP-1/C1-INH complexes using novel ELISAs

Lisa Hurler et al. Front Immunol. .

Erratum in

Abstract

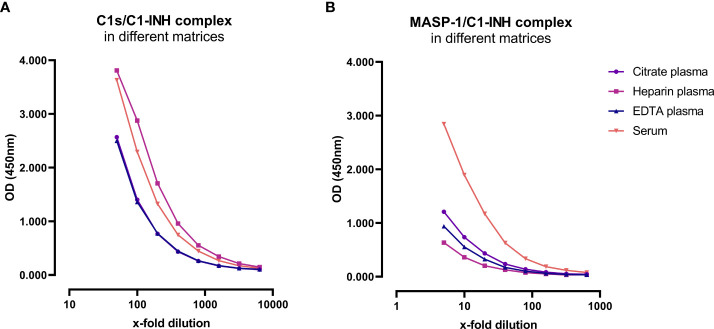
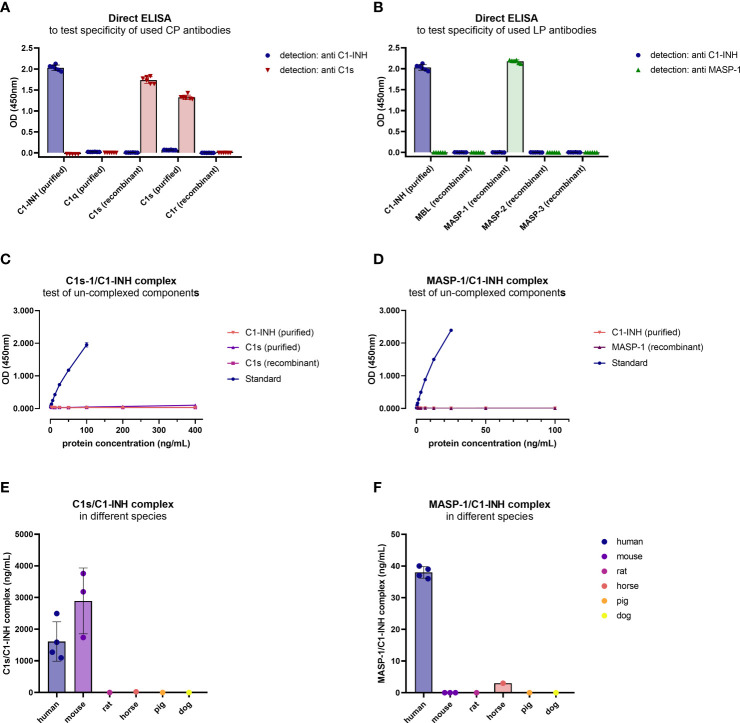
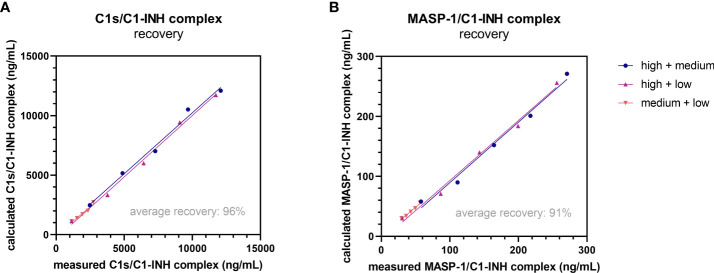
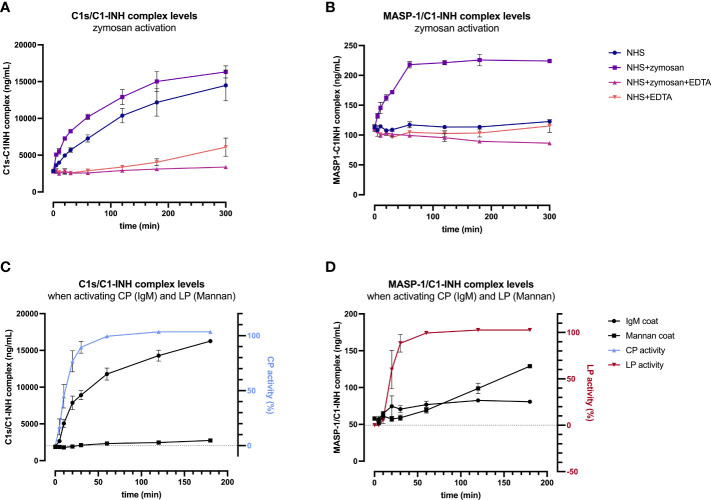
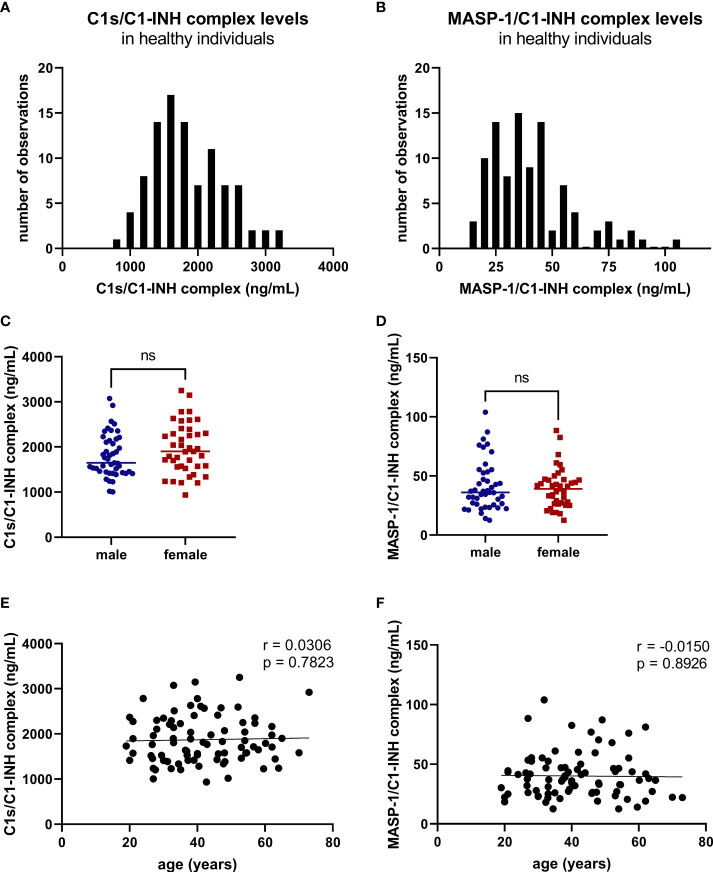
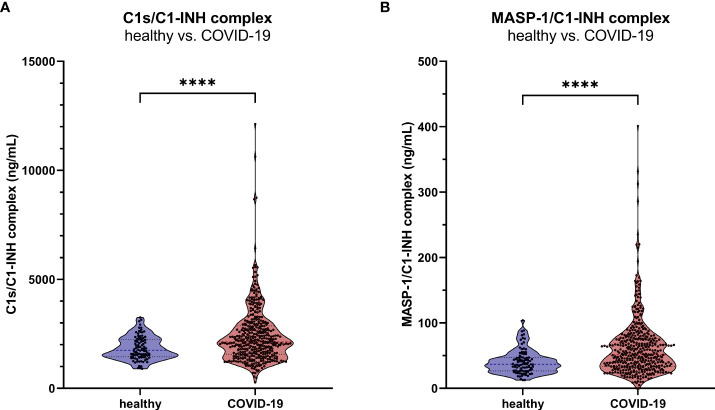
The most commonly used markers to assess complement activation are split products that are produced through activation of all three pathways and are located downstream of C3. In contrast, C4d derives from the cleavage of C4 and indicates either classical (CP) or lectin pathway (LP) activation. Although C4d is perfectly able to distinguish between CP/LP and alternative pathway (AP) activation, no well-established markers are available to differentiate between early CP and LP activation. Active enzymes of both pathways (C1s/C1r for the CP, MASP-1/MASP-2 for the LP) are regulated by C1 esterase inhibitor (C1-INH) through the formation of covalent complexes. Aim of this study was to develop validated immunoassays detecting C1s/C1-INH and MASP-1/C1-INH complex levels. Measurement of the complexes reveals information about the involvement of the respective pathways in complement-mediated diseases. Two sandwich ELISAs detecting C1s/C1-INH and MASP-1/C1-INH complex were developed and tested thoroughly, and it was investigated whether C1s/C1-INH and MASP-1/C1-INH complexes could serve as markers for either early CP or LP activation. In addition, a reference range for these complexes in healthy adults was defined, and the assays were clinically validated utilizing samples of 414 COVID-19 patients and 96 healthy controls. The immunoassays can reliably measure C1s/C1-INH and MASP-1/C1-INH complex concentrations in EDTA plasma from healthy and diseased individuals. Both complex levels are increased in serum when activated with zymosan, making them suitable markers for early classical and early lectin pathway activation. Furthermore, measurements of C1-INH complexes in 96 healthy adults showed normally distributed C1s/C1-INH complex levels with a physiological concentration of 1846 ± 1060 ng/mL (mean ± 2SD) and right-skewed distribution of MASP-1/C1-INH complex levels with a median concentration of 36.9 (13.18 - 87.89) ng/mL (2.5-97.5 percentile range), while levels of both complexes were increased in COVID-19 patients (p<0.0001). The newly developed assays measure C1-INH complex levels in an accurate way. C1s/C1-INH and MASP-1/C1-INH complexes are suitable markers to assess early classical and lectin pathway activation. An initial reference range was set and first studies showed that these markers have added value for investigating and unraveling complement activation in human disease.

Keywords: C1-INH complexes; C1s/C1-INH complex; MASP-1/C1-INH complex; assay development and validation; classical pathway activation; early complement activation; lectin pathway activation.


Conflict of interest statement

ET, BB, RB and WB are employees of Hycult Biotech. The remaining authors declare that the research was conducted in the absence of any commercial or financial relationships that could be construed as a potential conflict of interest.

Figures

Figure 1
Figure 1
Overview of Classical and Lectin Pathway activation, regulation by C1-INH and proposed mechanism of complex formation. Middle panel: Activation of the classical and the lectin pathway (1). Recognition of triggering compound by the respective recognition molecules (C1q for classical pathway; MBL, ficolins or collectins for lectin pathway) and binding thereof to the activating compounds/structures. (2) Zymogen autoactivation of the first serine protease after structural changes of the associated recognition molecules upon binding to activating structures. (3) Catalytically activation of the second serine proteases by the activated first serine proteases. (4) Cleavage of C2 and C4 by activated serine proteases. (5) Formation of the classical C3 convertase, consisting of C4b and C2b [updated nomenclature according to (3)]. (6) Downstream complement activation going along with the release of several complement activation/split products. (7) Formation of the Terminal Complement Complex (TCC) or the Membrane Attack Complex (MAC complex), when formed on a membrane, and lysis or cell clearance. Left and right panel: Regulation of classical and lectin pathway activation by C1-INH and proposed theory of complex formation. (A) Binding of the pattern recognition molecule to an activating surface, resulting in conformational changes in the respective protein complexes. (B) Activation of serine proteases, allowing downstream complement activation. (C) Regulation of pathway activation by C1-INH through covalent binding to active sites of the serine proteases, blocking protease function and further activation of the respective pathways. (D) Dissociation of the complexes upon binding of C1-INH and release of C1-INH complexes as well as free pattern recognition molecules into the circulation. The figure was created with BioRender.com.
Figure 2
Figure 2
C1-INH complex standards purified in buffer and in EDTA plasma and exemplary standard curves. Parallelism of the C1-INH complexes is shown either purified in buffer (red) or in EDTA plasma (blue) for concentrations ranging from 1.6-100 ng/mL C1s/C1-INH complex (A) and 0.4-25 ng/mL MASP-1/C1-INH complex (B). Representative results of a C1s/C1-INH complex standard curve (C), ranging from 0 to 100 ng/mL; and a MASP-1/C1-INH complex standard curve (D), ranging from 0 to 25 ng/mL. The coefficient of determination was obtained using non-linear regression (One-site binding, Hyperbola). OD, optical density; R2, coefficient of determination; nm, nanometer; EDTA, Ethylenediaminetetraacetic acid.
Figure 3
Figure 3
C1-INH complex concentrations in different matrices. Exemplary results of Citrate plasma (purple), Heparin plasma (pink), EDTA plasma (blue) and serum samples (red) from a single individual are plotted in a dilution range from 50x-6400x for the C1s/C1-INH complex (A) and in a dilution range from 5x-640x for the MASP-1/C1-INH complex (B). Influence of matrices on C1-INH complex concentrations was investigated in two individuals, while results of one individual each are shown here as an example. OD, optical density; EDTA, Ethylenediaminetetraacetic acid; nm, nanometer.
Figure 4
Figure 4
Cross-reactivity of antibodies and new immunoassays. (A, B) Binding of antibodies to proteins of the respective pathways was tested in a direct ELISA. For classical pathway proteins, detection was done with either the C1-INH or C1s antibody, while for lectin pathway proteins detection was done with the C1-INH and MASP-1 antibodies also used during assay development. Conditions were tested in duplicates, while the experiment was performed in triplicates. (C, D) Cross-reactivity of un-complexed complement components was tested using either purified or recombinant proteins of the complex, dependent on availability. While C1s (purified and recombinant) and C1-INH (purified) were tested in the C1s/C1-INH complex assay (C), MASP-1 (recombinant) and C1-INH (purified) were measured in the MASP-1/C1-INH assay (D). (E, F) Cross-reactivity of serum samples from animal origin was investigated in the assays using human EDTA plasma samples (n=4) as a reference, murine serum (n=3), rat serum (n=1), horse serum (n=1), pig serum (n=1) and dog serum (n=1) (E: C1s/C1-INH complex, F: MASP-1/C1-INH complex). Animal samples were measured 10x less diluted compared to human samples. OD, optical density; nm, nanometer.
Figure 5
Figure 5
Recovery of complexes in EDTA plasma. Recovery of the C1s/C1-INH complex (A) and MASP-1/C1-INH complex (B) was investigated by mixing EDTA plasma samples of three individuals with low, middle and high complex concentration in different ratios (100 + 0, 75 + 25, 50 + 50, 25 + 75, 0 + 100). After 30 min of incubation, C1-INH complex concentrations were determined in the respective assays and recovery (difference between expected and observed C1-INH complex concentration) was calculated according to the equation stated in the Material and Methods section. EDTA, ethylenediaminetetraacetic acid; min, minutes.
Figure 6
Figure 6
Validation of C1-INH complexes as activation markers: zymosan-initiated (A, B) and pathway-specific (C, D) complex formation over time. For zymosan-activation (A, B), normal human serum was incubated either alone or with zymosan, EDTA, or a mix thereof, for up to 5 hours at 37 °C. Samples were taken at several time points and concentrations of C1s/C1-INH complex (A) and MASP-1/C1-INH complex (B) were determined using the new immunoassays. Plotted values show C1-INH complex concentrations (mean ± SD) of two independent activation experiments performed in duplicates each, while effects of added compounds (zymosan, EDTA) and incubation time on C1-INH complex levels were analyzed with a two-way ANOVA with Tukey’s multiple comparisons test. For the C1s/C1-INH complex, a statistically significant effect was seen for the zymosan-treated sample for both, the incubation time (p<0.0001) as well as the treatment (NHS+zymosan vs. NHS: p=0.0399, NHS+zymosan vs. NHS+zymosan+EDTA: p<0.0001, NHS+zymosan vs. NHS+EDTA: p<0.0001). For the MASP-1/C1-INH complex, the zymosan-treated sample did also show statistically significant effects for the incubation time (p<0.0001) as well as the treatment (NHS+zymosan vs. all other treatments tested: p<0.0001). For pathway-specific activation (C, D), normal human serum was incubated on wells coated with either IgM (CP) or mannan (LP), for up to 3 hours at 37 °C. After incubation, C1-INH complex levels were determined in the supernatant (C: C1s/C1-INH complex; D: MASP-1/C1-INH complex), while C9 neoepitope formation was measured on the respective wells (WIESLAB® Complement System kits). Plotted values show mean concentrations of C1-INH complexes (mean ± SD) and normalized CP and LP activity (as measured by C9 neoepitope formation using positive and negative controls provided in the kits) of three independent experiments. NHS, normal human serum; EDTA, ethylenediaminetetraaceticacid; SD, standard deviation; min, minutes; IgM, immunoglobulin M; TCC, terminal complement complex.
Figure 7
Figure 7
Benchtop stability of C1-INH complexes in EDTA plasma and Citrate plasma (A–D) and freeze-thaw stability of complexes in EDTA plasma and in purified form (E, F). For benchtop testing (panels A–D), samples were stored at room temperature (red graphs) or on ice (blue graphs) for different time intervals (10 min-16 h). Afterwards concentrations of either C1s/C1-INH complex (A: EDTA plasma, C: Citrate plasma) or MASP-1/C1-INH complex (B: EDTA plasma, D: Citrate plasma) were measured in the samples. C1-INH concentrations of the 10 min samples were set as 100% and the amount of complexes at other time points was calculated in relation to the 10 min sample. Differences to the 10 min sample were calculated using one sample t-test (* p<0.05, *** p<0.001, non-significant results are not marked). Due to natural variation in biomarker measurements, acceptable concentrations ranged from 80-120% compared to the concentration in the respective 10 min sample. For analysis of freeze-thaw stability (panels E, F), aliquots of either purified C1-INH complex (plotted in red) or two independent EDTA plasma samples (plotted in blue and pink) were exposed to 0 to 4 freeze-thaw cycles and concentrations of C1s/C1-INH complex (E) and MASP-1/C1-INH complex (F) were determined in the respective sandwich ELISAs. Due to natural variation when measuring biomarkers, acceptable complex concentrations ranged from 80-120% of the original concentration (0 freeze thaw cycles) and the accepted range is marked in grey on the figures. min, minutes; h, hours; EDTA, ethylenediaminetetraacetic acid.
Figure 8
Figure 8
C1-INH complex levels in healthy adult individuals. C1-INH complex concentrations were measured in 96 healthy adult individuals, using the new immunoassays. Distributions of C1s/C1-INH complex (A) and MASP-1/C1-INH complex concentrations (B) are shown in histograms. Concentrations in healthy adults were furthermore stratified according to gender (C: C1s/C1-INH complex, D: MASP-1/C1-INH complex) and age (E: C1s/C1-INH complex, F: MASP-1/C1-INH complex). No significant differences between males (n=50) and females (n=46) were observed when comparing the groups using Mann-Whitney test. ns, not significant; r, correlation coefficient.
Figure 9
Figure 9
C1-INH complex levels in adult COVID-19 patients. The new immunoassays were clinically validated by the measurement of C1s/C1-INH complex (A) and MASP-1/C1-INH complex levels (B) in 414 COVID-19 patients as well as in 96 healthy controls. P values for the pair-wise group comparisons (healthy vs. COVID-19) were calculated by the Mann-Whitney test (**** p<0.0001).

References

    1. Flierman R, Daha MR. The clearance of apoptotic cells by complement. Immunobiology (2007) 212(4-5):363–70. doi: 10.1016/j.imbio.2006.11.005 - DOI - PubMed
    1. Dunkelberger JR, Song WC. Complement and its role in innate and adaptive immune responses. Cell Res (2010) 20(1):34–50. doi: 10.1038/cr.2009.139 - DOI - PubMed
    1. Bohlson SS, Garred P, Kemper C, Tenner AJ. Complement nomenclature-deconvoluted. Front Immunol (2019) 10:1308. doi: 10.3389/fimmu.2019.01308 - DOI - PMC - PubMed
    1. McGrath FD, Brouwer MC, Arlaud GJ, Daha MR, Hack CE, Roos A. Evidence that complement protein C1q interacts with c-reactive protein through its globular head region. J Immunol (2006) 176(5):2950–7. doi: 10.4049/jimmunol.176.5.2950 - DOI - PubMed
    1. Roy N, Ohtani K, Hidaka Y, Amano Y, Matsuda Y, Mori K, et al. . Three pentraxins c-reactive protein, serum amyloid p component and pentraxin 3 mediate complement activation using collectin CL-P1. Biochim Biophys Acta Gen Subj. (2017) 1861(2):1–14. doi: 10.1016/j.bbagen.2016.11.023 - DOI - PubMed

Publication types

Substances