. 2022 Dec;36(12):e22655.
doi: 10.1096/fj.202201276R.

Studying the trafficking of labeled trodusquemine and its application as nerve marker for light-sheet and expansion microscopy

Affiliations

Studying the trafficking of labeled trodusquemine and its application as nerve marker for light-sheet and expansion microscopy

Claudia Capitini et al. FASEB J. 2022 Dec.

Abstract

Trodusquemine is an aminosterol with a variety of biological and pharmacological functions, such as acting as an antimicrobial, stimulating body weight loss and interfering with the toxicity of proteins involved in the development of Alzheimer's and Parkinson's diseases. The mechanisms of interaction of aminosterols with cells are, however, still largely uncharacterized. Here, by using fluorescently labeled trodusquemine (TRO-A594 and TRO-ATTO565), we show that trodusquemine binds initially to the plasma membrane of living cells, that the binding affinity is dependent on cholesterol, and that trodusquemine is then internalized and mainly targeted to lysosomes after internalization. We also found that TRO-A594 is able to strongly and selectively bind to myelinated fibers in fixed mouse brain slices, and that it is a marker compatible with tissue clearing and light-sheet fluorescence microscopy or expansion microscopy. In conclusion, this work contributes to further characterize the biology of aminosterols and provides a new tool for nerve labeling suitable for the most advanced microscopy techniques.

Keywords: intracellular trafficking; lipid membrane; nerve fiber staining; neurodegeneration; optical imaging; squalamine.


Figures

FIGURE 1
FIGURE 1
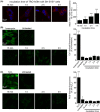
TRO‐A594 accumulation in SH‐SY5Y neuroblastoma cells over time. (A) Representative confocal scanning microscope images of SH‐SY5Y cells incubated for different times with 5 μM TRO‐A594. Red, TRO‐A594; blue, Hoechst. The images were analyzed at median planes parallel to the coverslip. n > 50 cells, from three independent experiments; error bars, SD; Student's t‐test, **p < .01; ***p < .001 with respect to the immediately preceding incubation time. (B and C) Representative confocal images of SH‐SY5Y cells showing (B) cytosolic free Ca2+ (green) and (C) intracellular ROS levels (green) after incubation for different times with 5 μM trodusquemine. Ionomycin and H2O2 were used as a positive control for Ca2+ and ROS analysis, respectively. n > 50 cells, from three independent experiments; error bars, SD; Bonferroni test, ***p < .001 with respect to (B) ionomycin and (C) H2O2.
FIGURE 2
FIGURE 2
Pulse‐chase of TRO‐A594 in SH‐SY5Y neuroblastoma cells. (A) Representative confocal images of SH‐SY5Y cells incubated with 5 μM TRO‐A594 for 15 min, washed and then imaged at different times after the beginning of incubation. Red, TRO‐A594; blue, Hoechst. The images were analyzed at median planes parallel to the coverslip. (B) Quantitative analysis of plasma membrane (blue bars), and cytoplasmic (light blue bars) trodusquemine‐derived fluorescence. n > 50 cells, from three independent experiments; error bars, SD; Student's t‐test, **p < .01; ***p < .001 with respect to the immediately preceding incubation time for each compartmental analysis.
FIGURE 3
FIGURE 3
Colocalization of TRO‐A594 with cytoplasmic organelles. (A) Representative confocal images of SH‐SY5Y cells incubated with 5 μM TRO‐A594 for 15 min. The cells were then washed and the confocal acquisitions were made at 2 h. To label mitochondria, cells were treated with MitoTracker™ Green FM for 15 min before confocal acquisition. To label early endosomes, Golgi apparatus and lysosome cells had been transiently transfected 24 h earlier with GFP‐EEA1 wt, mEmerald‐TGNP‐N‐10, and LAMP1‐mGFP plasmids, respectively. As a positive control, cells overexpressing the GFP‐EEA1 were fixed and immunolabeled with anti‐Rab5 antibody coupled to secondary Alexa 568 antibody. (B and C) Histograms reporting (B) the mean cell Pearson's and (C) the Manders' colocalization coefficients (M1, fraction of subcellular compartment overlapping with TRO‐A594; M2, fraction of TRO‐A594 overlapping with the subcellular compartment). The analysis was performed at median planes of 40–45 cells after subtracting background, in two different experiments. Error bars, SD.
FIGURE 4
FIGURE 4
Effect of cholesterol depletion on TRO‐A594 binding affinity. Representative confocal images of SH‐SY5Y cells treated for 48 h with or without 10 μM Simvastatin (SIM), and then incubated with 5 μM TRO‐A594 for 15 min before confocal image acquisition. Blue and red fluorescence intensities indicate nuclei labeled with the dye Hoechst and trodusquemine, respectively. The images were analyzed at median planes parallel to the coverslip. n > 50 cells, from three independent experiments; error bars, SD; Student's t‐test, **p < .01 with respect to TRO‐A594 only.
FIGURE 5
FIGURE 5
TRO‐A594 as marker of mouse nerve fibers. (A) Representative confocal images of fixed mouse brain slices treated with 0.5 μM Alexa Fluor® 594 (dye only, corresponding to the concentration used in 5 μM TRO‐A594) and 5 μM TRO‐A594 for 15 min, 2, and 24 h. The histograms show the quantitative values of TRO‐A594 fluorescence associated with nerve fibers (left) and the signal‐to‐noise ratio (right). Error bars, SD. Objective lens 60×/NA 1.4; excitation light 405 and 561 nm. (B) Confocal image of TRO‐A594‐stained fiber bundles and single fibers after 24 h incubation. The magnified image shows a sectioned fiber stained with TRO‐A594. The graph reports the intensity fluorescence analysis of the sectioned fiber. Objective lens 60×/NA 1.4; excitation light 405 and 561 nm. (C and D) Confocal images of (C) TRO‐ATTO565‐stained fiber bundles and single fibers (red) and (D) their overlay with anti‐MBP and secondary Alexa 488 staining (green). A colocalization analysis of TRO‐ATTO565 with MBP was carried out and the mean Pearson's and Manders' colocalization coefficients (M1, fraction of MBP overlapping with TRO‐ATTO565; M2, fraction of TRO‐ATTO565 overlapping with MBP) ± SD are reported in the figure.
FIGURE 6
FIGURE 6
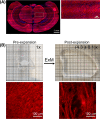
Compatibility of TRO‐A594 with light sheet and expansion microscopy. (A) LSFM downsampled reconstruction of 10‐μm thick mouse brain slice treated with 5 μM TRO‐A594 for 24 h. The magnified image shows the different orientation of fiber bundles labeled with TRO‐A594. Objective lens 12×, NA 0.53; excitation light 405 and 568 nm. (B) Confocal images of pre‐ and post‐expansion mouse brain slices treated with 5 μM TRO‐A594 for 24 h, and the corresponding hydrogels with the expansion factor quantification. Objective lens 20×, NA 0.9; excitation light 405 and 568 nm.

References

    1. Moore KS, Wehrli S, Roder H, et al. Squalamine: An aminosterol antibiotic from the shark. Proc Natl Acad Sci U S A. 1993;90:8058‐8062. - PMC - PubMed
    1. Rao MN, Shinnar AE, Noecker LA, et al. Aminosterols from the dogfish shark Squalus acanthias. J Nat Prod. 2000;63:631‐635. - PubMed
    1. Wehrli SL, Moore KS, Roder H, Durell S, Zasloff M. Structure of the novel steroidal antibiotic squalamine determined by two‐dimensional NMR spectroscopy. Steroids. 1993;58:370‐378. - PubMed
    1. Sills AK, Williams JI, Tyler BM, et al. Squalamine inhibits angiogenesis and solid tumor growth in vivo and perturbs embryonic vasculature. Cancer Res. 1998;58:2784‐2792. - PubMed
    1. Higgins RD, Sanders RJ, Yan Y, Zasloff M, Williams JI. Squalamine improves retinal neovascularization. Investig Ophthalmol Vis Sci. 2000;41:1507‐1512. - PubMed

Publication types

LinkOut - more resources