. 2022 Nov 17;9(11):702.
doi: 10.3390/bioengineering9110702.

Addition of ROCK Inhibitors Alleviates Prostaglandin-Induced Inhibition of Adipogenesis in 3T3L-1 Spheroids

Affiliations

Addition of ROCK Inhibitors Alleviates Prostaglandin-Induced Inhibition of Adipogenesis in 3T3L-1 Spheroids

Yosuke Ida et al. Bioengineering (Basel). .

Abstract

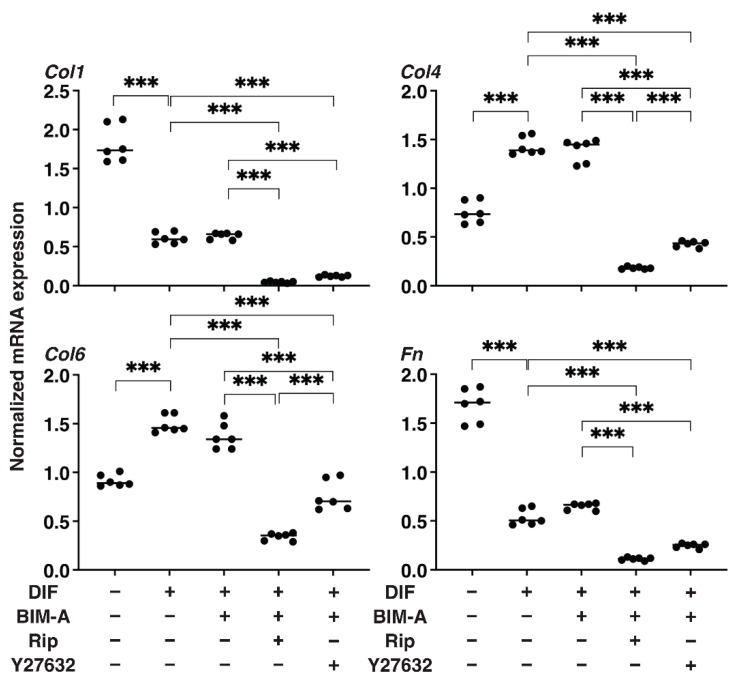
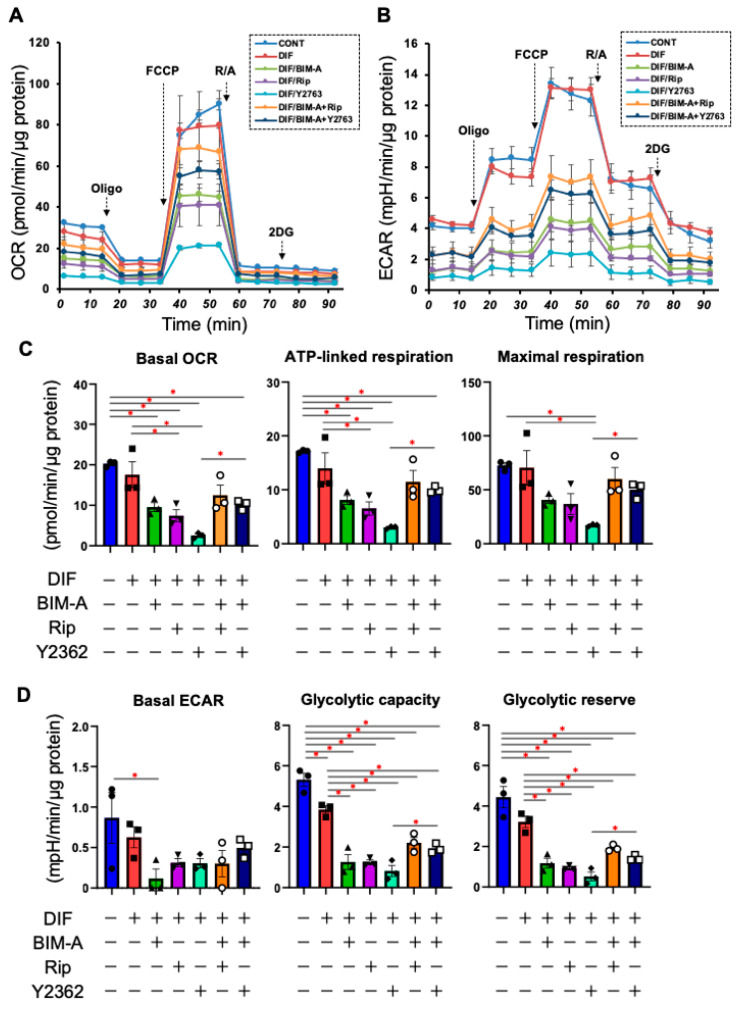
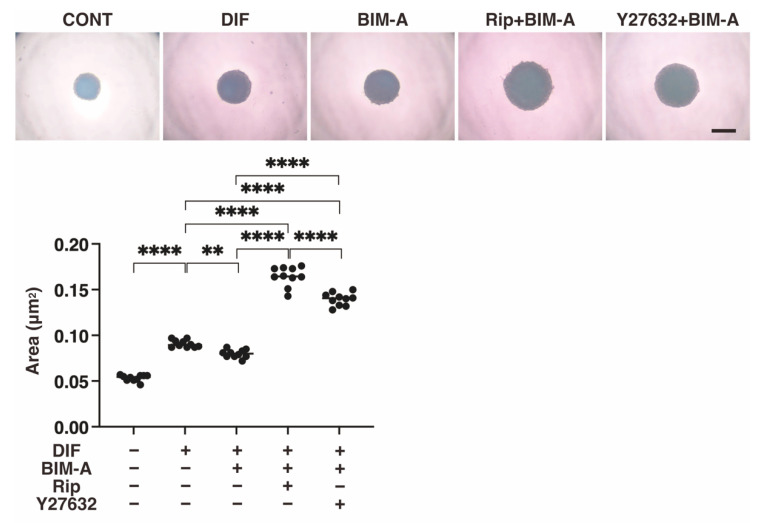
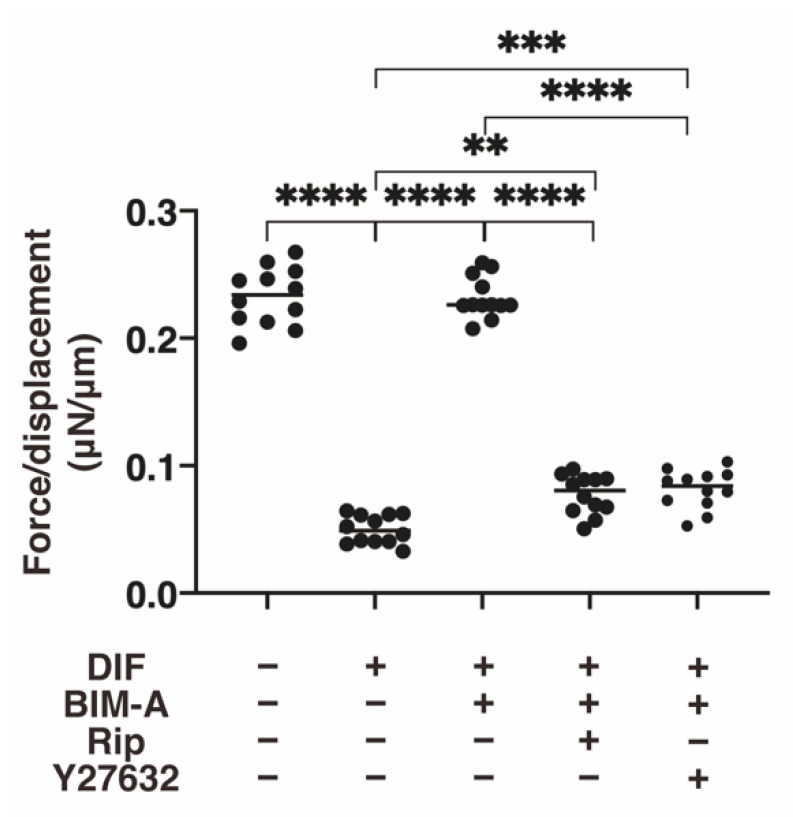
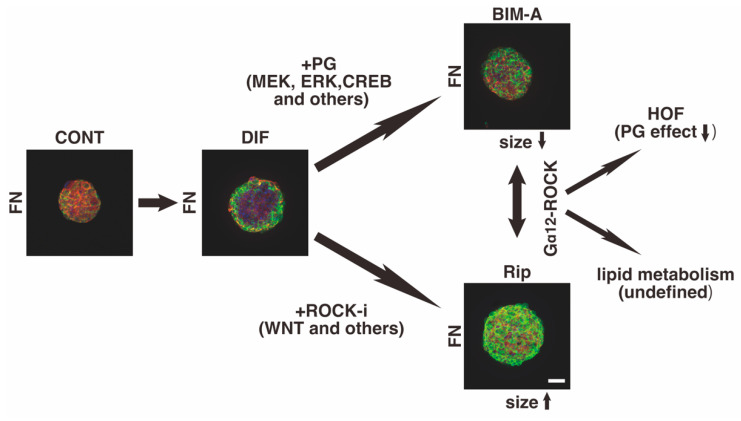
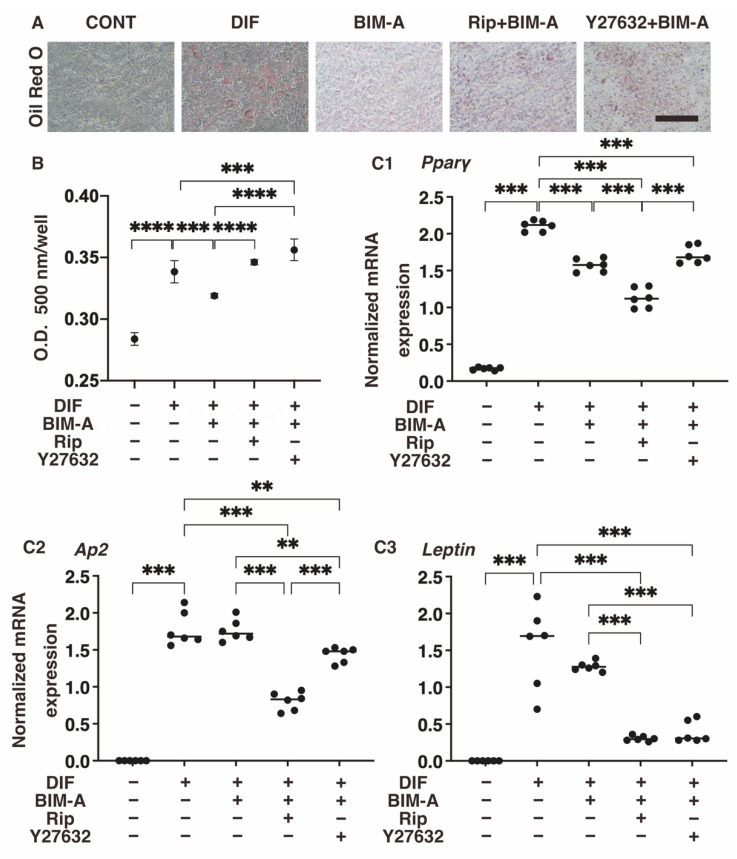
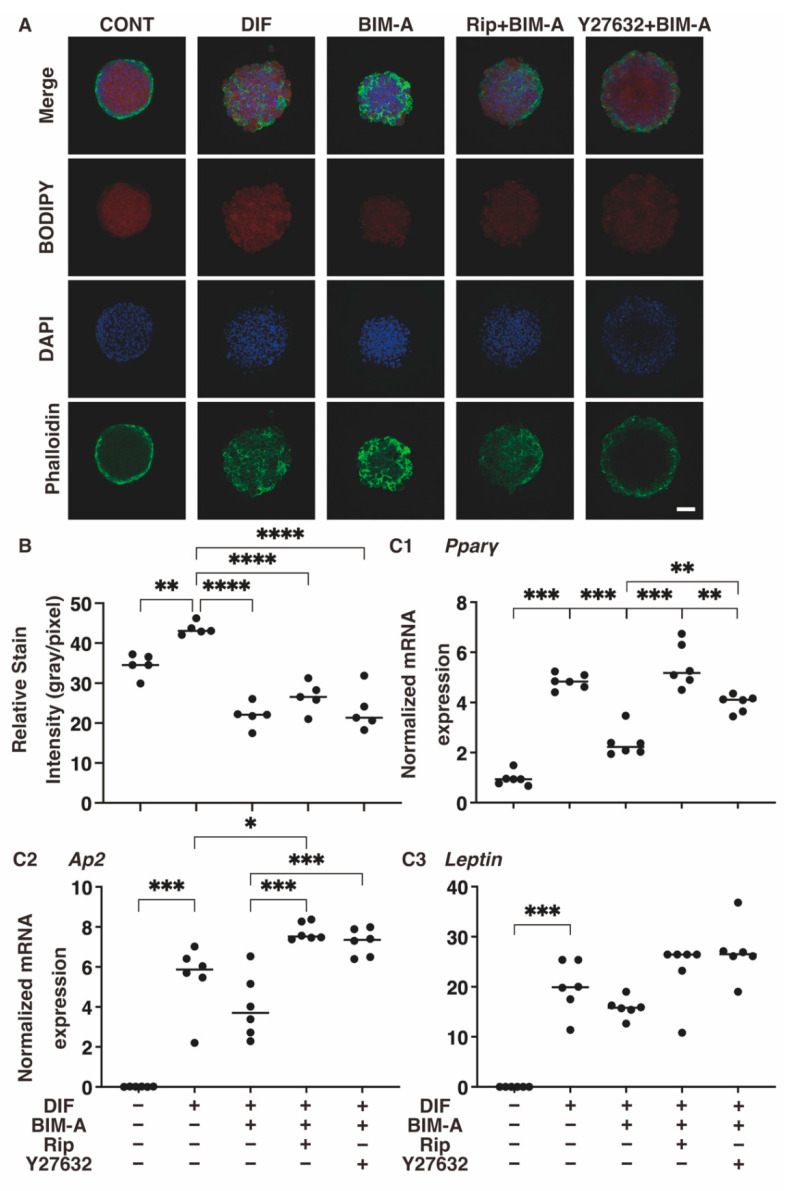
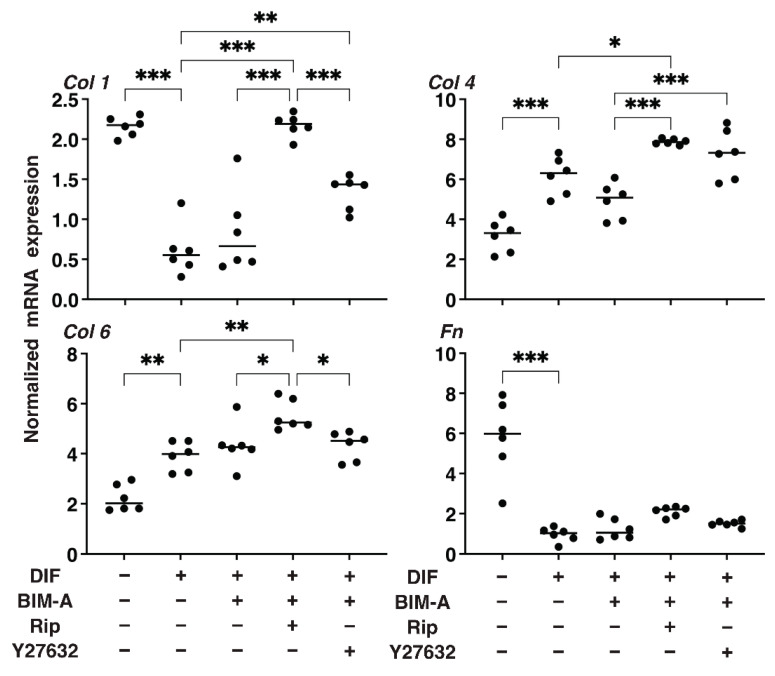
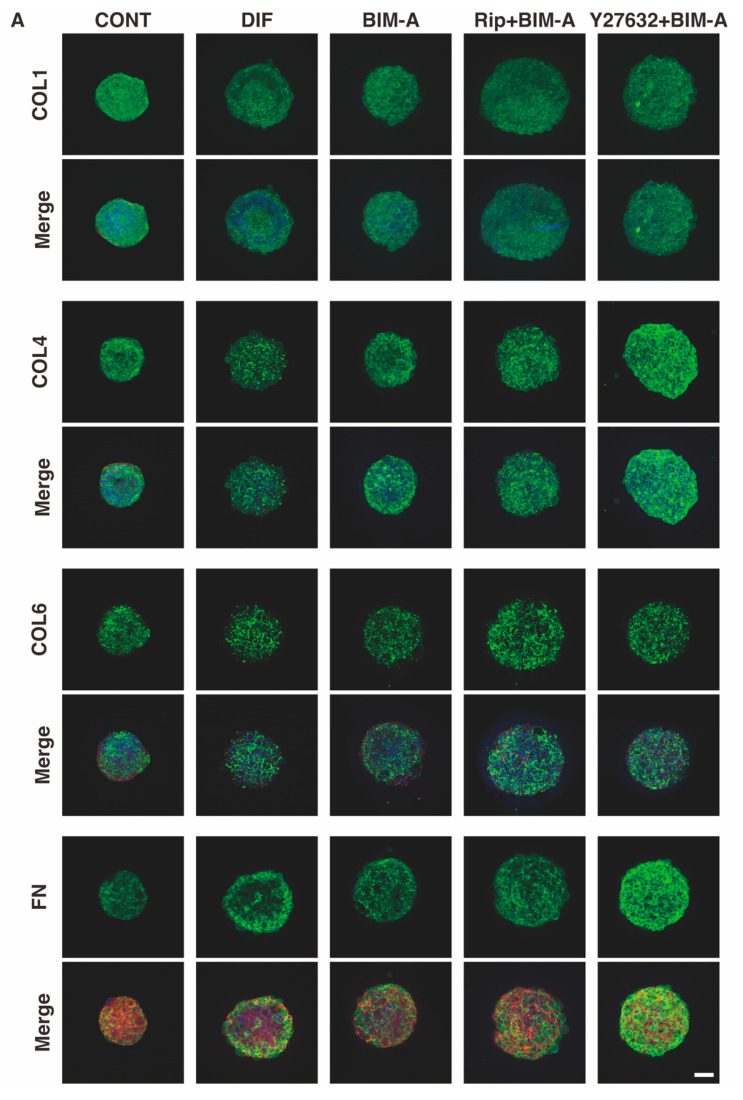
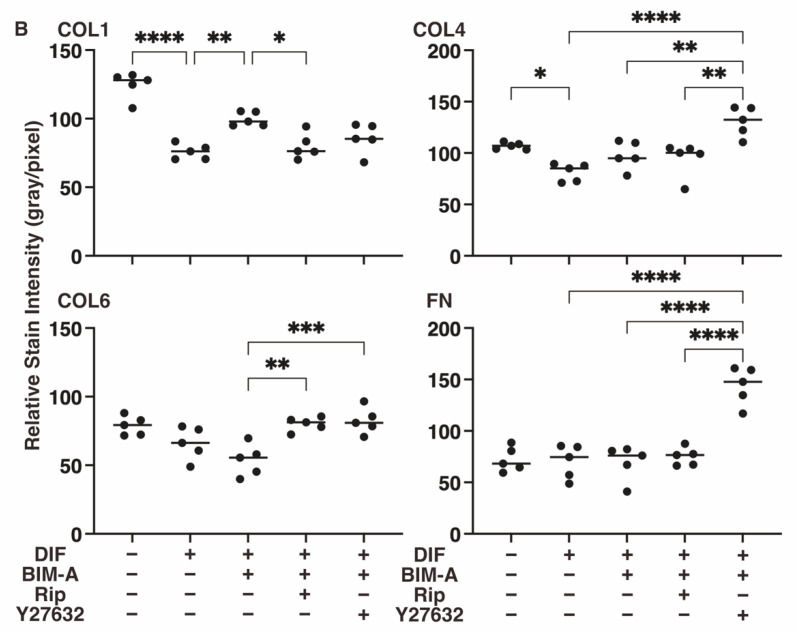
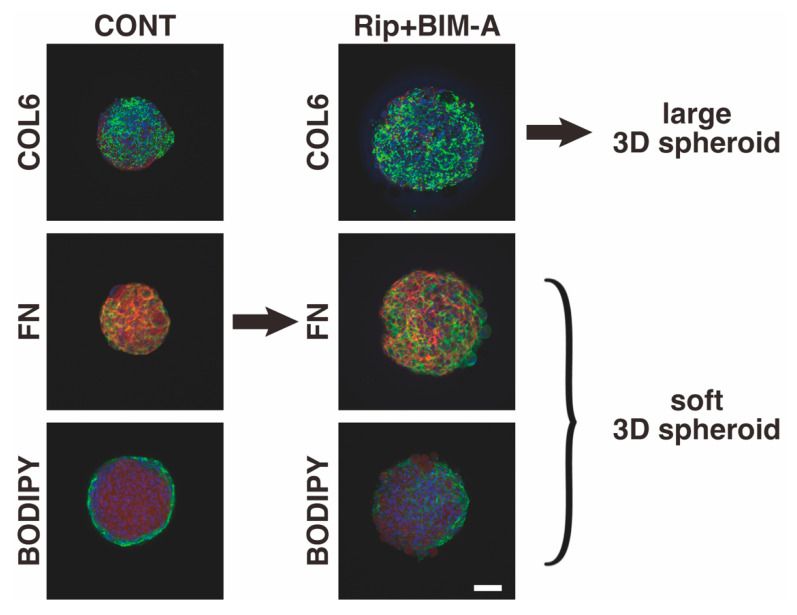
To elucidate the additive effects of the ROCK inhibitors (ROCK-i), ripasudil (Rip) and Y27632 on bimatoprost acid (BIM-A), a prostaglandin analog (PG), on adipose tissue, two- and three-dimensional (2D or 3D) cultures of 3T3-L1 cells, the most well characterized cells in the field of lipid research, were used. The cells were subjected to a variety of analyses including lipid staining, real-time cellular metabolic analysis, the mRNA expressions of genes related to adipogenesis and extracellular matrices (ECMs) as well as the sizes and physical properties of the 3D spheroids by a micro-squeezer. BIM-A induced strong inhibitory effects on most of the adipogenesis-related changes in the 2D and 3D cultured 3T3-L1 cells, including (1) the enlargement and softening of the 3D spheroids, (2) a dramatic enhancement in lipid staining and the expression of adipogenesis-related genes, and (3) a decrease in mitochondrial and glycolytic metabolic function. By adding ROCK-i to the BIM-A, most of these BIM-A-induced effects were cancelled. The collective findings reported herein suggest that ROCK-i eliminated the PG-induced suppression of adipogenesis in the 3T3-L1 cells, accompanied by the formation of enlarged 3D spheroids. Such effects of adding ROCK-i to a PG in preadipocytes on cellular properties appear to be associated with the suppression of PG-induced adverse effects, and provide additional insight into our understanding of lipid-related research.

Keywords: 3-dimensional (3D) tissue culture; 3T3-L1 cell; ROCK; ROCK inhibitor; Rho-kinase; upper eyelid sulcus (DUES) deepening.


Conflict of interest statement

The authors declare no conflict of interest.

Figures

Figure 3
Figure 3
Additional effects of ROCK-i on BIM-A on the mRNA expression of ECMs of 2D planar cultured 3T3-L1 cells. The 2D planar cultures of 3T3-L1 cells were cultured under several conditions: preadipocytes of 3T3-L1 cells or their adipogenic differentiation (DIF) with or without the combination of 100 nM BIM-A (BIM-A) and ROCK-i (10 µM Ripasudil (Rip) or 10 µM Y27632). These specimens were subjected to qPCR analysis to estimate the mRNA expression of major ECMs (Col: collagen, Fn: fibronectin). All experiments were performed in triplicate using fresh preparations, each consisting of 5 samples. Data are presented as the arithmetic means ± the standard error of the mean (SEM). *** p < 0.005 (ANOVA followed by Tukey’s multiple comparison test).
Figure 4
Figure 4
Additional effects of ROCK-i on BIM-A on the real-time cellular metabolic analysis of 2D planar cultured 3T3-L1 cells. The 3T3-L1 cells were 2D-cultured under several conditions: preadipocytes of 3T3-L1 cells (CONT) and their adipogenic differentiation (DIF) in the presence or absence of 100 nM BIM-A (BIM-A) and/or ROCK-i (10 µM Ripasudil (Rip) or 10 µM Y27632) were examined via real-time metabolic function analysis using a Seahorse XFe96 Bioanalyzer. The oxygen consumption rate (OCR, panel (A)) and extracellular acidification rate (ECAR, panel (B)) were measured, and thereafter, they were further measured after subsequent supplementation with oligomycin (a complex V inhibitor), FCCP (a protonophore), and rotenone/antimycin A (complex I/III inhibitors) and 2DG (a hexokinase inhibitor). The main parameters of the cellular metabolic analysis are shown in panels (C,D), respectively. Basal OCR was calculated by subtracting the OCR with rotenone/antimycin A from the OCR at baseline. ATP-linked respiration was analyzed by subtracting the OCR with oligomycin from the OCR at baseline. Maximal respiration was calculated by subtracting the OCR with rotenone/antimycin A from the OCR with FCCP. The basal ECAR was calculated by subtracting the ECAR with 2DG from the ECAR at baseline. Glycolytic capacity was calculated by subtracting the ECAR with 2DG from the ECAR with oligomycin. The glycolytic reserve was calculated by subtracting the ECAR at baseline from the ECAR with oligomycin. All experiments were performed in triplicate using fresh preparations (n = 3). Data are presented as the mean ± the standard error of the mean (SEM). * p < 0.05 (ANOVA followed by a Tukey’s multiple comparison test).
Figure 5
Figure 5
Additional effects of ROCK-i on BIM-A on the mean area sizes of the 3T3-L1 3D spheroids. The 3D spheroids of 3T3-L1 cells were cultured under several conditions: preadipocytes of 3T3-L1 cells (CONT) or their adipogenic differentiation (DIF) with or without the combination of 100 nM BIM-A (BIM-A) and ROCK-i (10 µM Ripasudil (Rip) or 10 µM Y27632). The mean area sizes (μm2) of the spheroids were measured and compared among experimental groups on Day 7. All experiments were performed in triplicate using fresh preparations, each consisting of 16 spheroids. Data are presented as the arithmetic means ± the standard error of the mean (SEM). ** p < 0.01, **** p < 0.001 (ANOVA followed by a Tukey’s multiple comparison test).
Figure 6
Figure 6
Additional effects of ROCK-i on BIM-A on physical stiffness during the adipogenesis of the 3T3-L1 3D spheroids. The 3D spheroids of 3T3-L1 cells were cultured under several conditions: preadipocytes of 3T3-L1 cells or their adipogenic differentiation (DIF) in the presence or absence of the combination of 100 nM BIM-A (BIM-A) and ROCK-i (10 µM Ripasudil (Rip) or 10 µM Y27632). The specimens collected on Day 7 were subjected to a physical solidity analysis. Among the above experimental conditions, the requiring force (μN) was measured and force/displacement (μN/μm) was potted (right panel). ** p < 0.01, *** p < 0.005, **** p < 0.001 (ANOVA followed by a Tukey’s multiple comparison test).
Figure 1
Figure 1
Hypothetical schema of PG and/or ROCK-i induced signaling toward 3D 3T3-L1 spheroids and experimental setups for the present study.
Figure 2
Figure 2
Additional effects of ROCK-i on BIM-A during the adipogenesis of 2D planar cultured 3T3-L1 cells. The 2D planar cultures of 3T3-L1 cells were cultured under several conditions: preadipocytes of 3T3-L1 cells (CONT) or their adipogenic differentiation (DIF) with or without the combination of 100 nM BIM-A (BIM-A) and ROCK-i (10 µM Ripasudil (Rip) or 10 µM Y27632). These specimens were subjected to analysis by Oil Red O lipid staining (panel (A); representative phase contrast images, scale bar: 100 μm, and panel (B); their staining intensities, O.D.) and qPCR of the master adipogenesis gene, Pparγ (panel (C1C3)). All experiments were performed in triplicate using fresh preparations, each consisting of 5 specimens. Data are presented as the arithmetic means ± the standard error of the mean (SEM). ** p < 0.01, *** p < 0.005, **** p < 0.001 (ANOVA followed by a Tukey’s multiple comparison test).
Figure 7
Figure 7
Additional effects of ROCK-i on BIM-A during the adipogenesis of 3T3-L1 3D spheroids. The 3D spheroids of 3T3-L1 cells were prepared under several conditions: preadipocytes of 3T3-L1 cells (CONT) or their adipogenic differentiation (DIF) with or without the combination of 100 nM BIM-A (BIM-A) and ROCK-i (10 µM Ripasudil (Rip) or 10 µM Y27632). These were immunostained by DAPI (blue), phalloidin (green) and BODIPY (red). Merge and BODIPY images are shown in panel (A) (scale bar: 100 μm) and their staining intensities (gray/pixel) were plotted (panel (B)). The mRNA expressions of adipogenesis-related genes, including Pparγ and Leptin, under the above conditions were plotted in panel (C1C3). All experiments were performed in duplicate using fresh preparations, each consisting of 16 spheroids. Data are presented as the arithmetic means ± the standard error of the mean (SEM). * p < 0.05, ** p < 0.01, *** p < 0.005, **** p < 0.001 (ANOVA followed by a Tukey’s multiple comparison test).
Figure 8
Figure 8
Additional effects of ROCK-i on BIM-A on the ECM-related mRNA expression of 3T3-L1 3D spheroids. The 3D spheroids of 3T3-L1 cells were cultured under several conditions: preadipocytes of 3T3-L1 cells or their adipogenic differentiation (DIF) in the presence or absence of the combination of 100 nM BIM-A (BIM-A) and ROCK-i (10 µM Ripasudil (Rip) or 10 µM Y27632). The specimens collected on Day 7 were subjected to a qPCR analysis to estimate the mRNA expression of ECMs (Col: collagen, Fn: fibronectin). All experiments were performed in duplicate using fresh preparations, each of which consisted of 16 spheroids. Data are presented as the arithmetic means ± the standard error of the mean (SEM). * p < 0.05, ** p < 0.01, *** p < 0.005 (ANOVA followed by a Tukey’s multiple comparison test).
Figure 9
Figure 9
Representative confocal images showing the expression of ECMs in 3D 3T3-L1 spheroids under several sets of conditions. (A) On Day 7, the 3D cultures of spheroids of 3T3-L1 preadipocytes as the control (CONT), and their adipogenic differentiation in the absence (DIF) or presence of 100 nM bimatoprost free acid (BIM-A) and/or 10 μM ROCK-i (Rip or Y27632), were immunostained with specific antibodies of ECMs designated by the green color. Scale bar: 100 μm. (B) The staining intensities of the ECMs of the spheroids that were stained as above are plotted. All experiments were performed in duplicate using fresh preparations consisting of 5 spheroids each. Data are presented as the arithmetic mean ± the standard error of the mean (SEM). * p < 0.05, ** p < 0.01, *** p < 0.005, **** p < 0.001 (ANOVA followed by a Tukey’s multiple comparison test).
Figure 9
Figure 9
Representative confocal images showing the expression of ECMs in 3D 3T3-L1 spheroids under several sets of conditions. (A) On Day 7, the 3D cultures of spheroids of 3T3-L1 preadipocytes as the control (CONT), and their adipogenic differentiation in the absence (DIF) or presence of 100 nM bimatoprost free acid (BIM-A) and/or 10 μM ROCK-i (Rip or Y27632), were immunostained with specific antibodies of ECMs designated by the green color. Scale bar: 100 μm. (B) The staining intensities of the ECMs of the spheroids that were stained as above are plotted. All experiments were performed in duplicate using fresh preparations consisting of 5 spheroids each. Data are presented as the arithmetic mean ± the standard error of the mean (SEM). * p < 0.05, ** p < 0.01, *** p < 0.005, **** p < 0.001 (ANOVA followed by a Tukey’s multiple comparison test).
Figure 10
Figure 10
Hypothetical model of the mechanism responsible for inducing huge-sized and soft 3D spheroids caused by the addition of Rip to BIM-A.

Similar articles

Cited by

References

    1. Cornier M.A., Dabelea D., Hernandez T.L., Lindstrom R.C., Steig A.J., Stob N.R., Van Pelt R.E., Wang H., Eckel R.H. The metabolic syndrome. Endocr. Rev. 2008;29:777–822. doi: 10.1210/er.2008-0024. - DOI - PMC - PubMed
    1. Pi-Sunyer X. The medical risks of obesity. Postgrad. Med. 2009;121:21–33. doi: 10.3810/pgm.2009.11.2074. - DOI - PMC - PubMed
    1. Spiegelman B.M., Flier J.S. Obesity and the regulation of energy balance. Cell. 2001;104:531–543. doi: 10.1016/S0092-8674(01)00240-9. - DOI - PubMed
    1. Fujimori K., Yano M., Ueno T. Synergistic suppression of early phase of adipogenesis by microsomal PGE synthase-1 (PTGES1)-produced PGE2 and aldo-keto reductase 1B3-produced PGF2α. PLoS ONE. 2012;7:e44698. doi: 10.1371/journal.pone.0044698. - DOI - PMC - PubMed
    1. Aubert J., Saint-Marc P., Belmonte N., Dani C., Négrel R., Ailhaud G. Prostacyclin IP receptor up-regulates the early expression of C/EBPbeta and C/EBPdelta in preadipose cells. Mol. Cell. Endocrinol. 2000;160:149–156. doi: 10.1016/S0303-7207(99)00210-5. - DOI - PubMed

LinkOut - more resources