. 2022 Nov 18;9(11):709.
doi: 10.3390/bioengineering9110709.

Automated Lung-Related Pneumonia and COVID-19 Detection Based on Novel Feature Extraction Framework and Vision Transformer Approaches Using Chest X-ray Images

Affiliations

Automated Lung-Related Pneumonia and COVID-19 Detection Based on Novel Feature Extraction Framework and Vision Transformer Approaches Using Chest X-ray Images

Chiagoziem C Ukwuoma et al. Bioengineering (Basel). .

Abstract

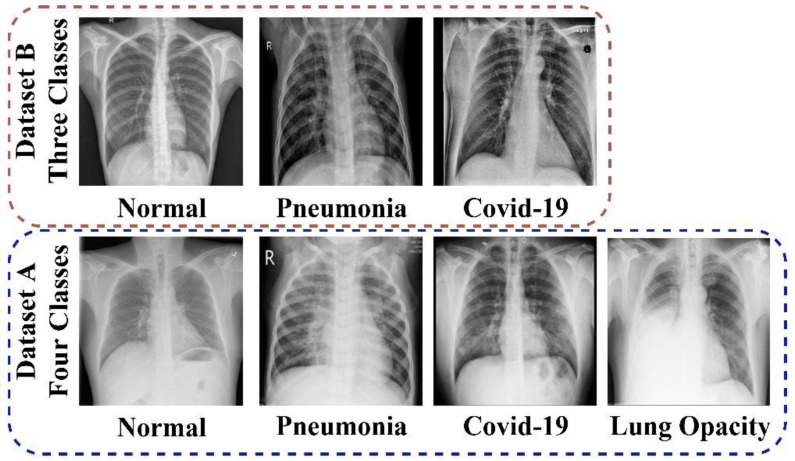
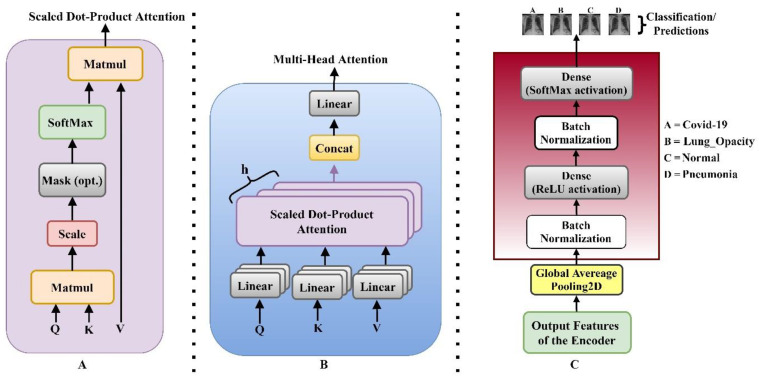
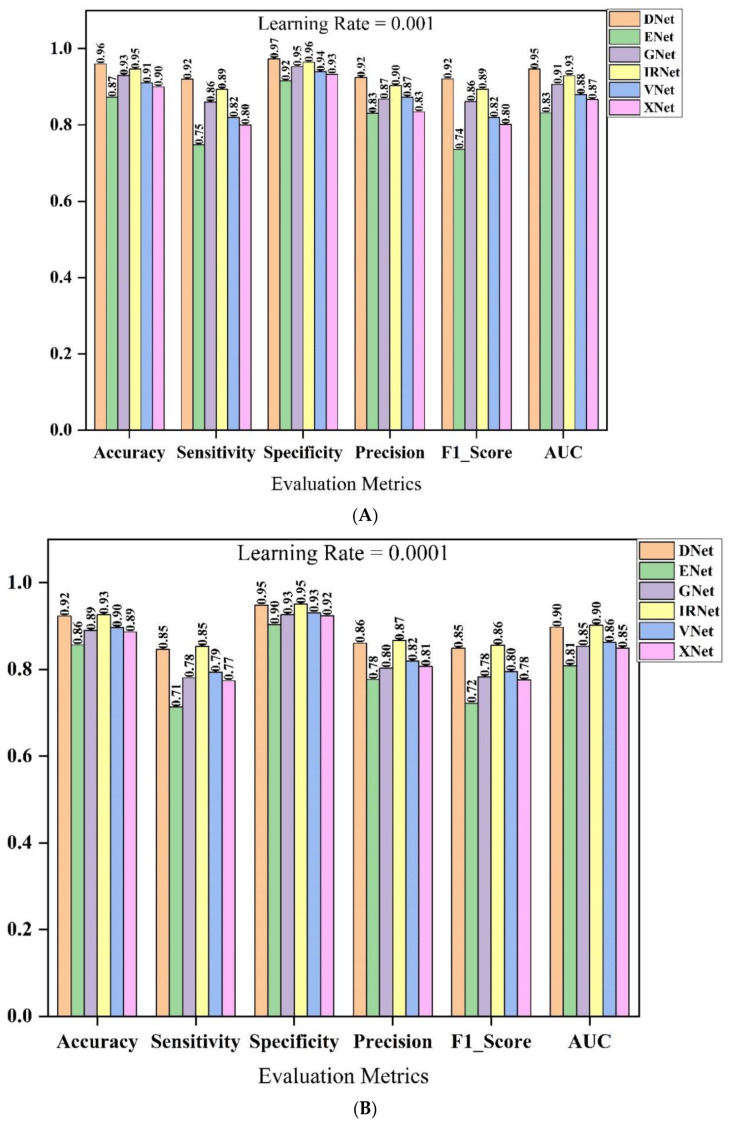
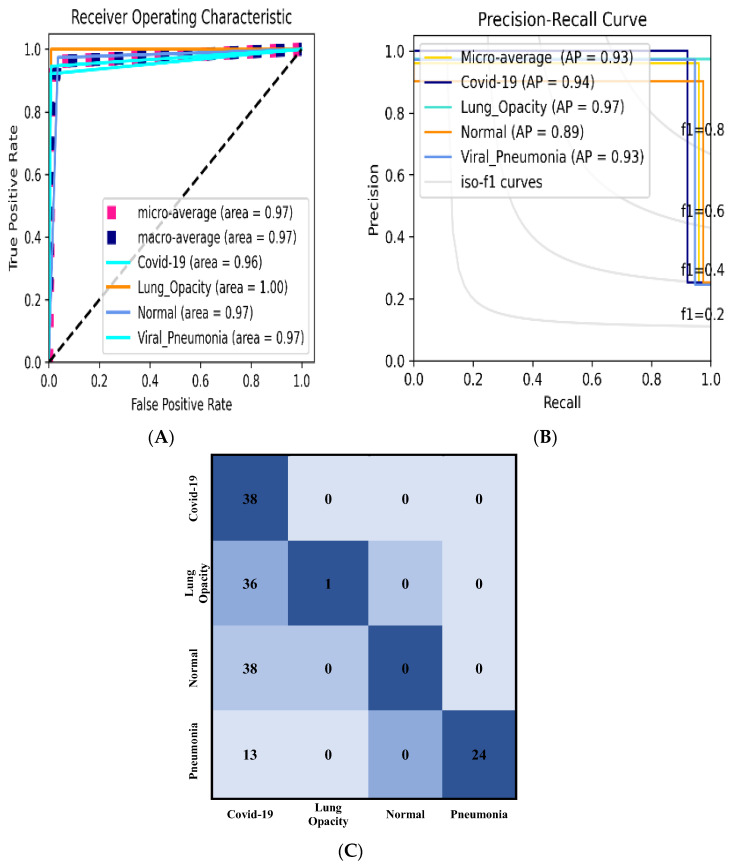
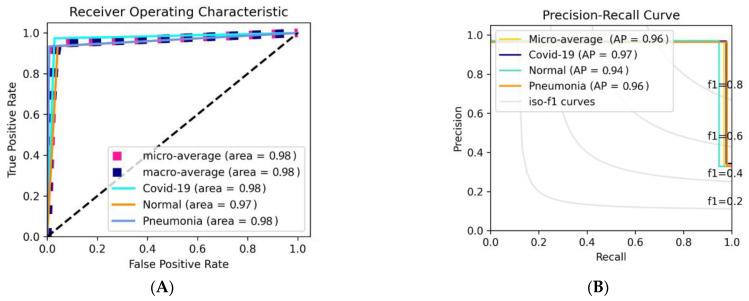
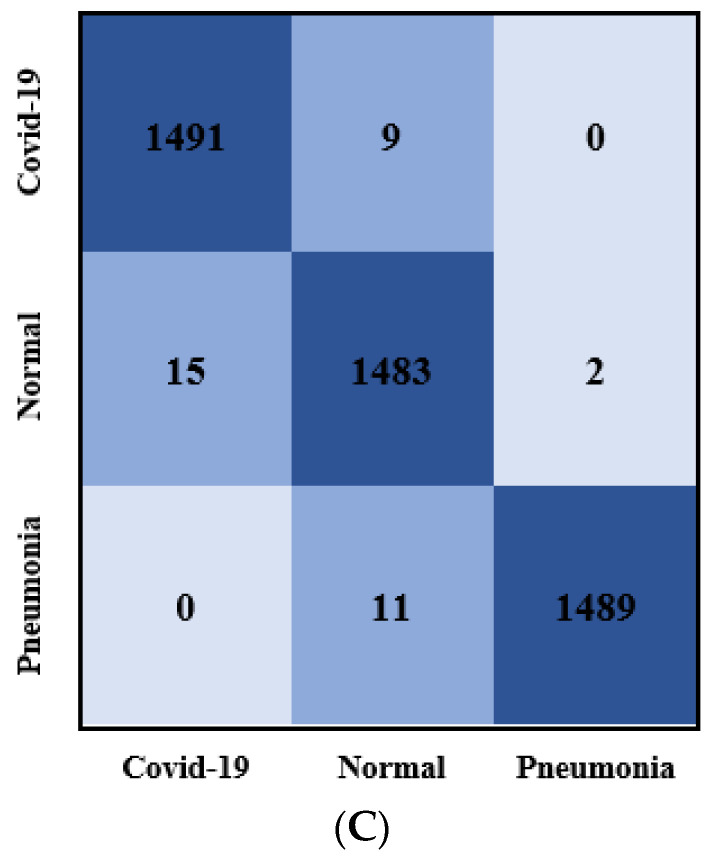
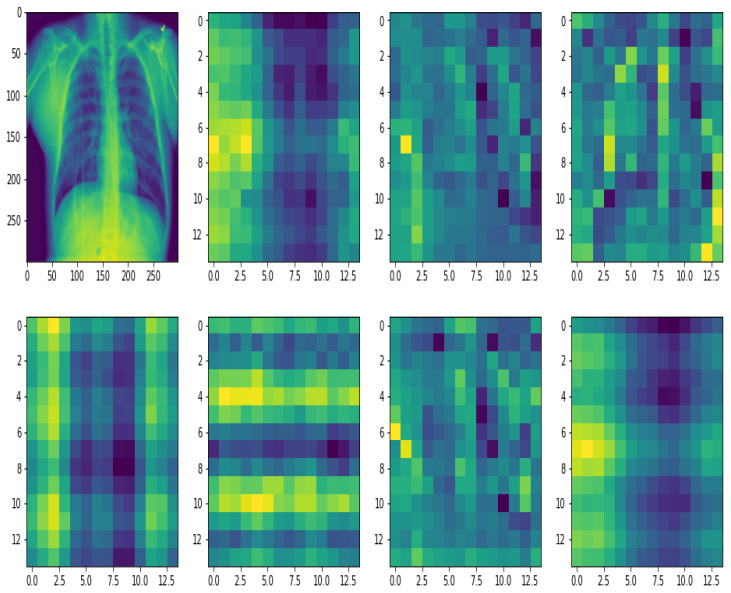
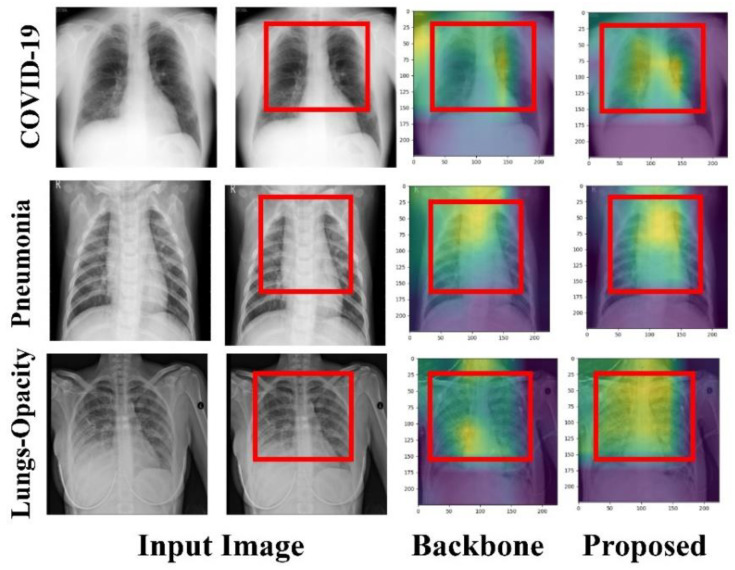
According to research, classifiers and detectors are less accurate when images are blurry, have low contrast, or have other flaws which raise questions about the machine learning model's ability to recognize items effectively. The chest X-ray image has proven to be the preferred image modality for medical imaging as it contains more information about a patient. Its interpretation is quite difficult, nevertheless. The goal of this research is to construct a reliable deep-learning model capable of producing high classification accuracy on chest x-ray images for lung diseases. To enable a thorough study of the chest X-ray image, the suggested framework first derived richer features using an ensemble technique, then a global second-order pooling is applied to further derive higher global features of the images. Furthermore, the images are then separated into patches and position embedding before analyzing the patches individually via a vision transformer approach. The proposed model yielded 96.01% sensitivity, 96.20% precision, and 98.00% accuracy for the COVID-19 Radiography Dataset while achieving 97.84% accuracy, 96.76% sensitivity and 96.80% precision, for the Covid-ChestX-ray-15k dataset. The experimental findings reveal that the presented models outperform traditional deep learning models and other state-of-the-art approaches provided in the literature.

Keywords: COVID-19; artificial intelligence; automatic detection; chest X-rays images; epidemic; feature extraction; lung disease; pneumonia.


Conflict of interest statement

All authors declare that they have no conflict of interest.

Figures

Figure 1
Figure 1
Sample of the employed dataset.
Figure 2
Figure 2
The proposed model organizational structure. The DenseNet201 (shown with 1), VGG16 (shown with 2), and GoogleNet architecture (shown with 3) serve as the network backbone to help in feature extraction. The fused features are passed via a global second-order pooling before being split into N patches and linear projection is employed to embed them. After adding position embedding, the sequence is supplied to an encoder, which then passes it to the classification/detection layer for prediction.
Figure 3
Figure 3
Illustrations of the implemented encoder. (A) Illustrates the Scaled dot-product attention (B) Multi-head Self-Attention network showing the several attention layers (Q, K, and V) running in parallel where (C) shows the implemented MLP block.
Figure 4
Figure 4
Mode of Feature extraction of the proposed study. From the network backbone up to the global second-order pooling layer.
Figure 5
Figure 5
Classification performance result of the pre-trained models for the backbone selection using the Data_A. (A) Pre-trained model selection using a learning rate of 10−4 and (B) Pre-trained model selection using a learning rate of 10−3. DNet stands for DenseNet201, ENet stands for EfficientNetB7, GNet stands for GoogleNet, IRNet stands for InceptionResNetV2, VNet stands for VGG16 and XNet stands for Xception, respectively.
Figure 6
Figure 6
The optimized setting results include (A) ROC and (B) PR curve of the 10−4 learning rate and categorical cross-entropy loss function, and (C) Hit rate diagram, based on Data_A.
Figure 7
Figure 7
The experimental results include (A) ROC and (B) PR curve, and (C) Confusion Metrics, based on Data_B.
Figure 7
Figure 7
The experimental results include (A) ROC and (B) PR curve, and (C) Confusion Metrics, based on Data_B.
Figure 8
Figure 8
The proposed model focuses on visual features of the input image that are semantic information important for classification.
Figure 9
Figure 9
A Grad-CAM-based visualization of the proposed model on the different input data samples. The proposed model focuses on visual features of the image that are semantic information important for classification.

Similar articles

Cited by

References

    1. Fong S.J., Dey N., Chaki J. SpringerBriefs in Applied Sciences and Technology. Springer; Singapore: 2021. An Introduction to COVID-19; pp. 1–22.
    1. Bakare O.O., Gokul A., Keyster M. Analytical Studies of Antimicrobial Peptides as Diagnostic Biomarkers for the Detection of Bacterial and Viral Pneumonia. Bioengineering. 2022;9:305. doi: 10.3390/bioengineering9070305. - DOI - PMC - PubMed
    1. Padda I., Khehra N., Jaferi U., Parmar M.S. The Neurological Complexities and Prognosis of COVID-19. SN Compr. Clin. Med. 2020;2:2025–2036. doi: 10.1007/s42399-020-00527-2. - DOI - PMC - PubMed
    1. Chen X., Laurent S., Onur O.A., Kleineberg N.N., Fink G.R., Schweitzer F., Warnke C. A systematic review of neurological symptoms and complications of COVID-19. J. Neurol. 2021;268:392–402. doi: 10.1007/s00415-020-10067-3. - DOI - PMC - PubMed
    1. Bentivegna E., Luciani M., Spuntarelli V., Speranza M.L., Guerritore L., Sentimentale A., Martelletti P. Extremely Severe Case of COVID-19 Pneumonia Recovered Despite Bad Prognostic Indicators: A Didactic Report. SN Compr. Clin. Med. 2020;2:1204–1207. doi: 10.1007/s42399-020-00383-0. - DOI - PMC - PubMed

LinkOut - more resources