. 2022 Nov 18;24(11):1689.
doi: 10.3390/e24111689.

Spike Spectra for Recurrences

Affiliations

Spike Spectra for Recurrences

K Hauke Kraemer et al. Entropy (Basel). .

Abstract

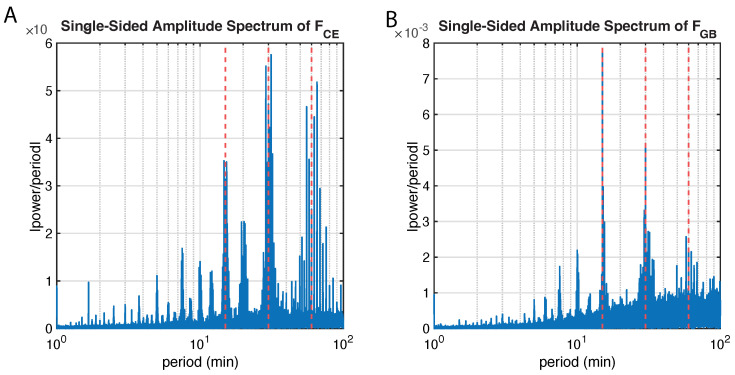
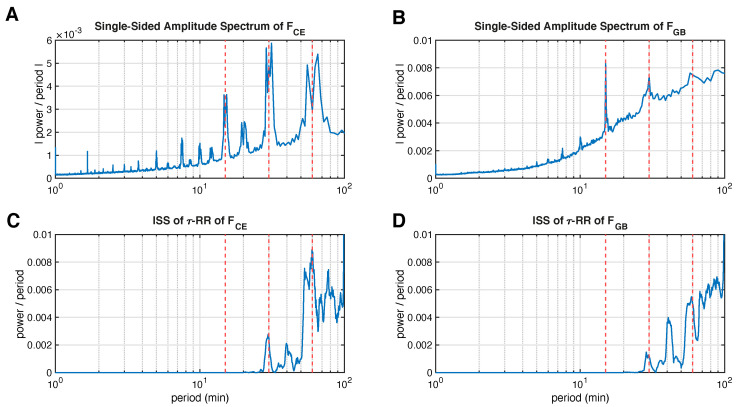
In recurrence analysis, the τ-recurrence rate encodes the periods of the cycles of the underlying high-dimensional time series. It, thus, plays a similar role to the autocorrelation for scalar time-series in encoding temporal correlations. However, its Fourier decomposition does not have a clean interpretation. Thus, there is no satisfactory analogue to the power spectrum in recurrence analysis. We introduce a novel method to decompose the τ-recurrence rate using an over-complete basis of Dirac combs together with sparsity regularization. We show that this decomposition, the inter-spike spectrum, naturally provides an analogue to the power spectrum for recurrence analysis in the sense that it reveals the dominant periodicities of the underlying time series. We show that the inter-spike spectrum correctly identifies patterns and transitions in the underlying system in a wide variety of examples and is robust to measurement noise.

Keywords: bifurcations; decomposition; frequency analysis; recurrence analysis.


Conflict of interest statement

The authors declare that they have no conflict of interest.

Figures

Figure A1
Figure A1
Subset of the frequency time series of (A) Central Europe (CE) [45] and (C) Great Britain (GB) [44] along with their autocorrelation functions in (B,D), respectively. The normalized autocorrelations in (B,D) were computed with the entire time series, whereas the subsets shown in (A,C) contain only 1441 samples.
Figure A2
Figure A2
Fourier spectra of the frequency entire time series from (A) Central Europe (CE), NCE=587,520 and (B) Great Britain (GB), NGB=1,581,120. A subset of the underlying time series is shown in Figure A1.
Figure A3
Figure A3
Same as in Figure 4, but here with 5% additive Gaussian white noise on each component x, y and z. (A) Trajectory of the system in a period-2 (parameter a=0.36), (B) in a period-3 (parameter a=0.41) and (C) in a chaotic regime (parameter a=0.428). (DF) The corresponding RPs, obtained by using a recurrence threshold corresponding to a 10% global recurrence rate for (D,E) and 5% for (F). (GI) τ-RRs of the shown RPs, (JL) the corresponding inter-spike spectra, and (MO) the Fourier power spectra. The appearance of the inter-spike spectra in (JL), and the Fourier spectra in (MO) are unaffected by the additive noise.
Figure A3
Figure A3
Same as in Figure 4, but here with 5% additive Gaussian white noise on each component x, y and z. (A) Trajectory of the system in a period-2 (parameter a=0.36), (B) in a period-3 (parameter a=0.41) and (C) in a chaotic regime (parameter a=0.428). (DF) The corresponding RPs, obtained by using a recurrence threshold corresponding to a 10% global recurrence rate for (D,E) and 5% for (F). (GI) τ-RRs of the shown RPs, (JL) the corresponding inter-spike spectra, and (MO) the Fourier power spectra. The appearance of the inter-spike spectra in (JL), and the Fourier spectra in (MO) are unaffected by the additive noise.
Figure A4
Figure A4
Wasserstein distances for the obtained inter-spike spectra of the τ-RRs for additive noise levels of up to 50% for the discussed Rössler dynamics, (A) period-2 limit-cycle, (B) period-3 limit-cycle and (C) chaos. For each noise level the obtained spectrum is compared to the noise-free spectrum (these are shown in Figure 4J–L for a regularization threshold corresponding to ρ=0.95) by computing its Wasserstein distance. Inter-spike spectra were obtained with a LASSO regression and three different regularization thresholds corresponding to ρ=0.9 (blue), ρ=0.95 (orange) and ρ=0.99 (green) accordance of τ-RRs and re-composed signals. Up to a noise level of 20% the distances are small and rather constant. The fluctuations depend on the chosen regularization threshold as well as on the underlying dynamics.
Figure A5
Figure A5
Pearson correlation coefficient ρs,s˜ between the input signal signal s and the re-composed signal s˜=XTβ^ as a function of the regularization parameter α for (A) LASSO and (B) sequentially thresholded least squares (STLS) regression (see also Section 2). The input time series is of length N=200 and stems from the τ-RR of Rössler system in regular dynamics.
Figure 1
Figure 1
Schematic illustration of a τ-recurrence-rate-based spectrum. (A) x-component time series of the Lorenz63-System (Equation (A1)) and (B) its corresponding Fourier power spectrum. (C) Reconstructed state space portrait from the time series shown in (A) using PECUZAL time-delay embedding [16]. (D) Subset of the recurrence plot and the corresponding τ-recurrence rate obtained from the state space trajectory in (C). (E) Fourier Power spectrum obtained from the τ-recurrence rate (subset shown in panel (D)) [15]. (D,E) show the results of a part of the time series, which is highlighted in pink in (A).
Figure 2
Figure 2
The transformation of a Dirac comb (series of Dirac delta functions) with a single inter-spike period Tis=100 (=^f=0.01) into the frequency domain. (A) Dirac Comb (DC) with equal amplitudes and (B) its FFT-based power spectral density. (C) Proposed inter-spike spectrum of the signal in (A) showing a single frequency, which corresponds to the inter-spike period Tis (f=0.01). (D) DC with randomly chosen amplitudes and same Tis as in (A), and (E) is its FFT-based power spectral density. (F) Proposed inter-spike spectrum of the signal in (D) showing a single frequency, which corresponds to the expected inter-spike period Tis (f=0.01). Inter-spike spectra were obtained with a LASSO regression and a regularization threshold corresponding to ρ=0.9 accordance of the signals in (A,D) and its re-composed signals (c.f. Section 2).
Figure 3
Figure 3
(A) Example of a full set of basis functions for an input signal of length N=4, aligned in the matrix X. Inter-spike periods Tis larger than N/2+1 lead to redundant basis functions (i.e., repeated lines in X, red sheared) or basis functions, which cannot be uniquely assigned to a certain inter-spike period (blue sheared). Tis for each row can be obtained by Equation (6). (B) The final set of unambiguous, but still linearly dependent, basis functions aligned in the matrix X.
Figure 4
Figure 4
Inter-spike spectra of the τ-RR of the Rössler system in three different dynamical regimes with parameters b=2, c=4. (A) Trajectory of the system in a period-2 (parameter a=0.36), (B) in a period-3 (parameter a=0.41) and (C) in a chaotic regime (parameter a=0.428). (DF) The corresponding RPs, obtained by using a recurrence threshold corresponding to a 10% global recurrence rate for (D,E) and 5% for (F). (GI) τ-RRs of the shown RPs. (JL) The proposed inter-spike spectra of the τ-RRs shown in panels (GI). Spectra were obtained with a LASSO regression and a regularization threshold corresponding to ρ=0.95 accordance of τ-RRs and re-composed signals. The distance ratio of the peaks reflect the limit cycle dynamic. (MO) Fourier power spectra of the τ-RRs shown in panels (GI).
Figure 5
Figure 5
Peak positions of the obtained inter-spike spectra of the τ-RRs for additive noise levels up to 50% for the discussed Rössler dynamics, (A) period-2 limit-cycle, (B) period-3 limit-cycle and (C) chaos. The size of the plotted markers scale with the detected peak height. The noise-free spectra are shown in Figure 4J–L and an example of these spectra with 5% additive noise is shown in Figure A3J–L. Spectra were obtained with a LASSO regression and a regularization threshold corresponding to ρ=0.95 accordance of τ-RRs and re-composed signals.
Figure 6
Figure 6
(A) Bifurcation diagram and Lyapunov exponent and of the Logistic map as a function of the control parameter r. (B) Number of significant peaks (α=0.05) in the inter-spike spectrum of the τ-RR and its Pearson correlation coefficient to the Lyapunov exponent shown in (A) (white noise surrogates). (C) Same as (B), but for iterative Amplitude Adjusted Fourier Transform (iAAFT) surrogates [26,27]. To obtain the inter-spike spectra, we used a LASSO regression and a regularization threshold corresponding to the ρ=0.95 accordance of τ-RRs and re-composed signals.
Figure 7
Figure 7
Averaged evolutionary Fourier power spectra of recorded power grid frequency time series of (A) Central Europe (CE) and (B) Great Britain (GB) (see Figure A1 in Appendix B). The corresponding averaged inter-spike spectra of the according τ-RRs, Equation (2), are shown in (C,D), respectively. Vertical red dashed lines correspond to 15, 30 and 60 min. For technical details on the calculation of the spectra shown, i.e, the preprocessing and window size being used, the reader is referred to Appendix B.
Figure 8
Figure 8
(A) Evolutionary Fourier power spectra of eccentricity time series. (B) Inter-spike spectrogram of the τ-recurrence rate of the eccentricity time series and (C) its Fourier spectrogram. Horizontal black dashed lines highlight the analytically expected orbital periods of 405, 124 and 95 kyrs. For comparability, in all cases the spectra aligned in the columns of the shown plots are normalized to probabilities (sum of unity for each power spectrum). For further computational details, please refer to the main text.

References

    1. Marwan N., Romano M.C., Thiel M., Kurths J. Recurrence Plots for the Analysis of Complex Systems. Phys. Rep. 2007;438:237–329. doi: 10.1016/j.physrep.2006.11.001. - DOI
    1. Marwan N. A Historical Review of Recurrence Plots. Eur. Phys. J. Spec. Top. 2008;164:3–12. doi: 10.1140/epjst/e2008-00829-1. - DOI
    1. Webber C.L., Jr., Marwan N. Recurrence Quantification Analysis—Theory and Best Practices. Springer; Cham, Switzerland: 2015. p. 421. - DOI
    1. Dummer B., Wieland S., Lindner B. Self-consistent determination of the spike-train power spectrum in a neural network with sparse connectivity. Front. Comput. Neurosci. 2014;8:104. doi: 10.3389/fncom.2014.00104. - DOI - PMC - PubMed
    1. Orcioni S., Paffi A., Apollonio F., Liberti M. Revealing Spectrum Features of Stochastic Neuron Spike Trains. Mathematics. 2020;8:1011. doi: 10.3390/math8061011. - DOI

LinkOut - more resources