. 2022 Nov 24:11:e76387.
doi: 10.7554/eLife.76387.

EROS is a selective chaperone regulating the phagocyte NADPH oxidase and purinergic signalling

Affiliations

EROS is a selective chaperone regulating the phagocyte NADPH oxidase and purinergic signalling

Lyra O Randzavola et al. Elife. .

Abstract

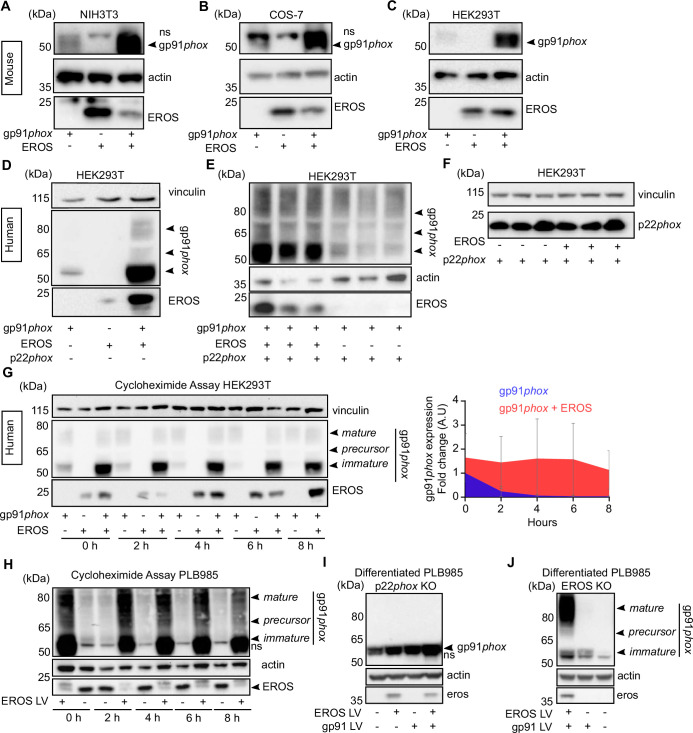
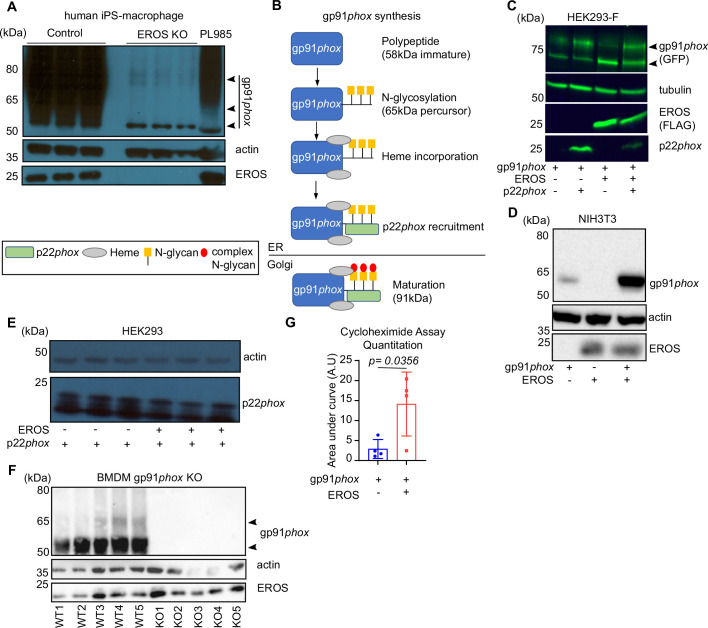
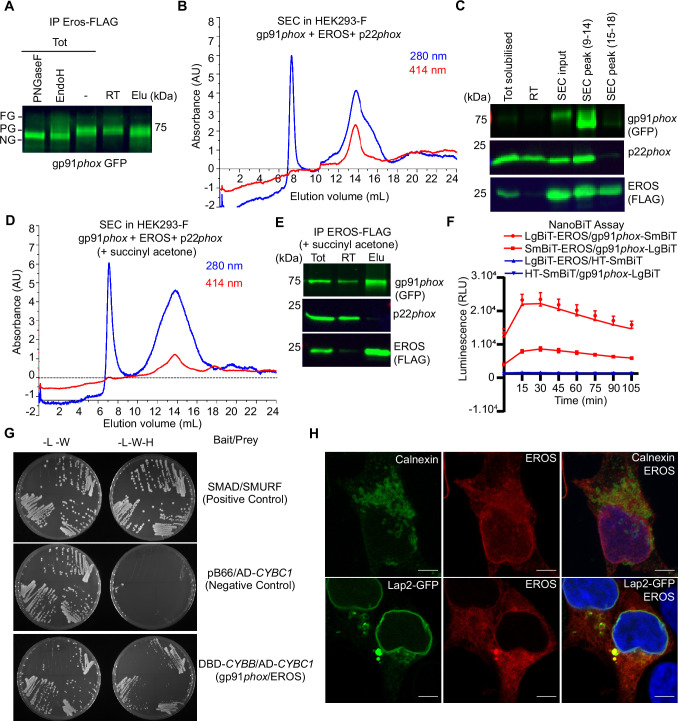
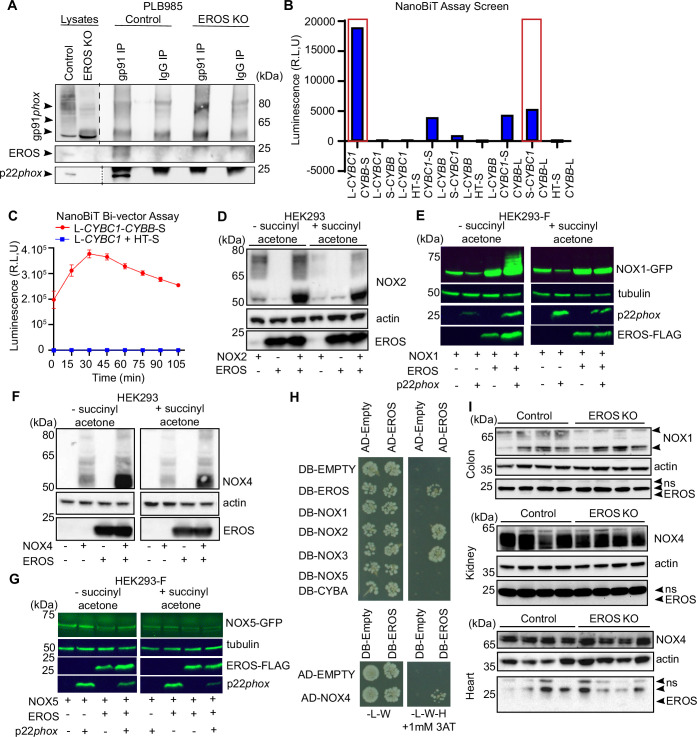
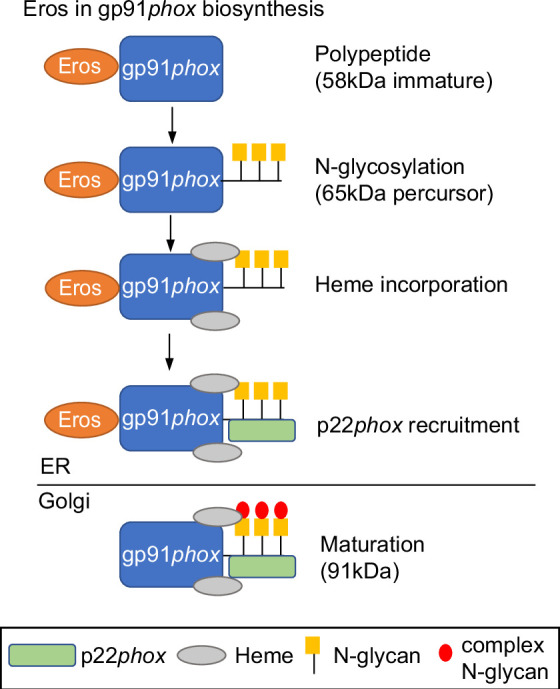
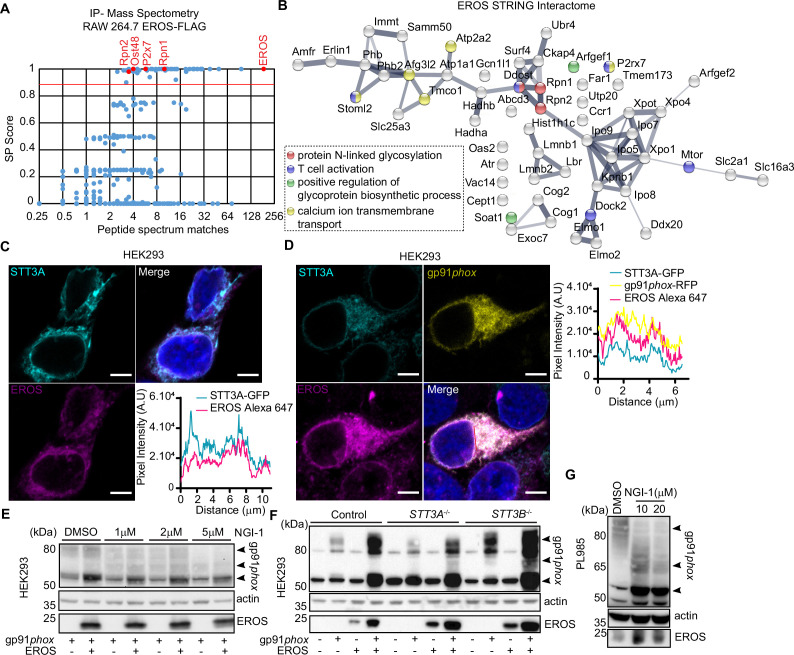
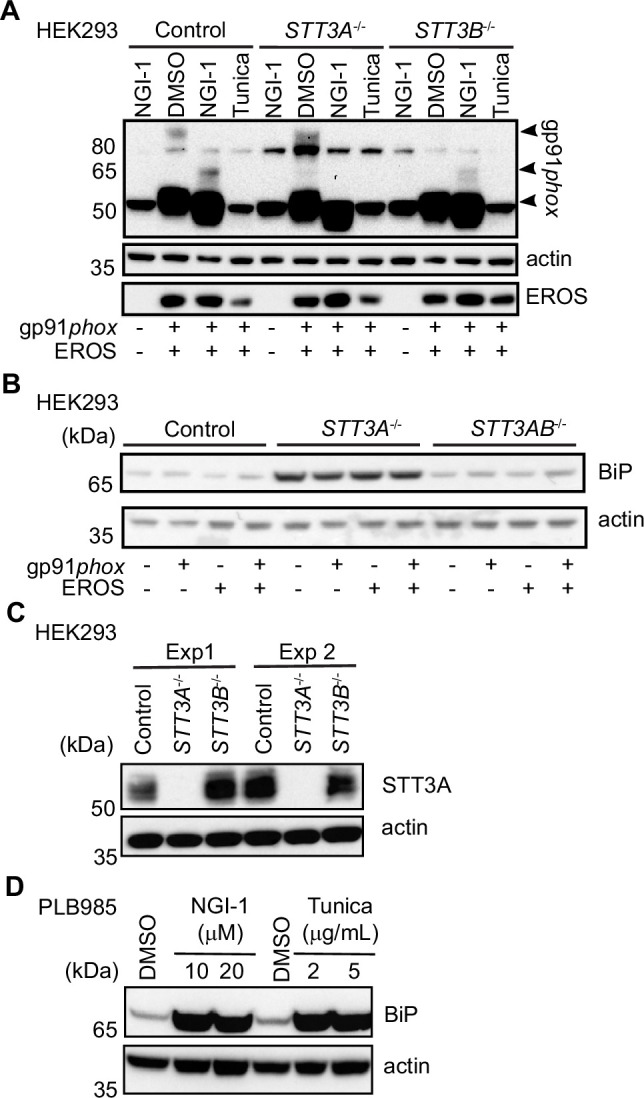
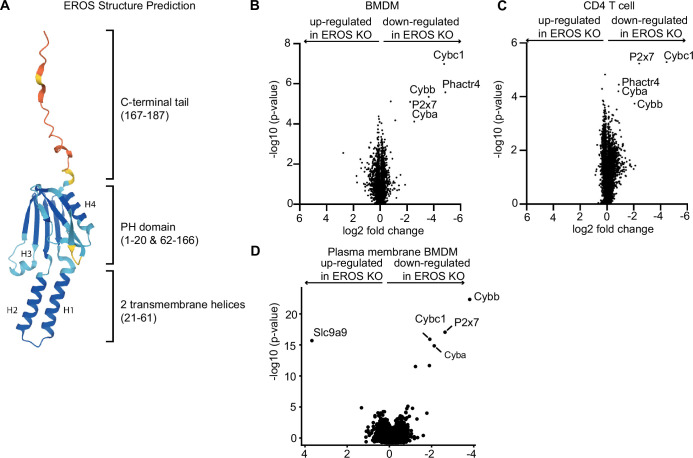
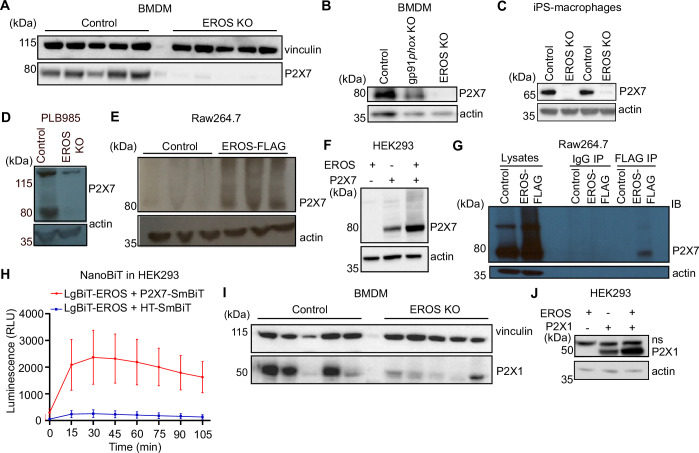
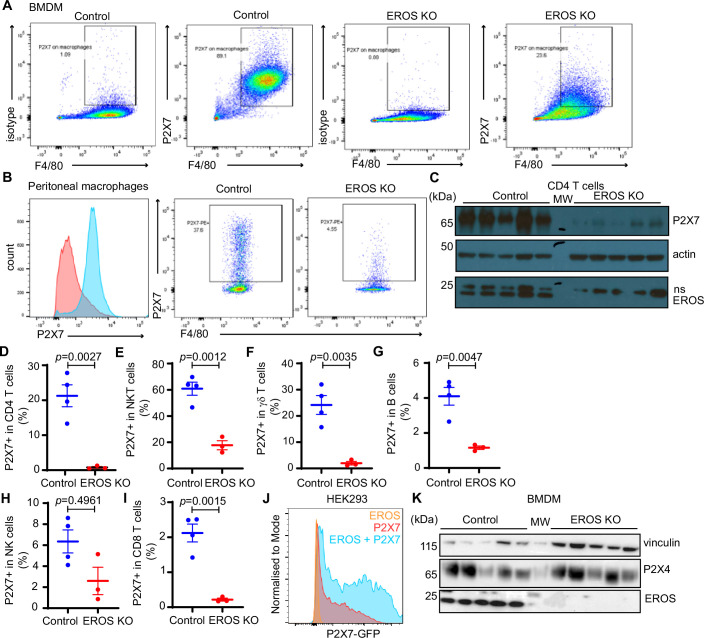
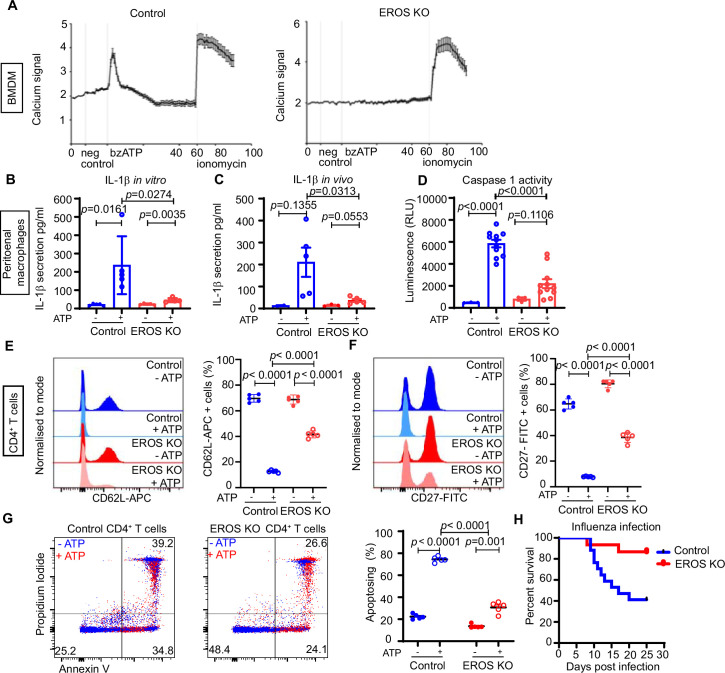
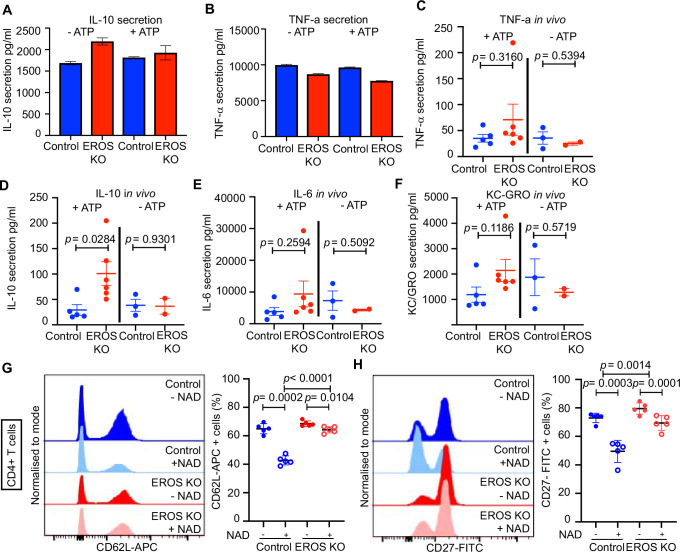
EROS (essential for reactive oxygen species) protein is indispensable for expression of gp91phox, the catalytic core of the phagocyte NADPH oxidase. EROS deficiency in humans is a novel cause of the severe immunodeficiency, chronic granulomatous disease, but its mechanism of action was unknown until now. We elucidate the role of EROS, showing it acts at the earliest stages of gp91phox maturation. It binds the immature 58 kDa gp91phox directly, preventing gp91phox degradation and allowing glycosylation via the oligosaccharyltransferase machinery and the incorporation of the heme prosthetic groups essential for catalysis. EROS also regulates the purine receptors P2X7 and P2X1 through direct interactions, and P2X7 is almost absent in EROS-deficient mouse and human primary cells. Accordingly, lack of murine EROS results in markedly abnormal P2X7 signalling, inflammasome activation, and T cell responses. The loss of both ROS and P2X7 signalling leads to resistance to influenza infection in mice. Our work identifies EROS as a highly selective chaperone for key proteins in innate and adaptive immunity and a rheostat for immunity to infection. It has profound implications for our understanding of immune physiology, ROS dysregulation, and possibly gene therapy.

Keywords: NADPH oxidase;; OST complex; P2X receptor; T cells; chaperone;; immunology; inflammasome; inflammation; mouse.


Conflict of interest statement

LR, PM, EG, ED, AS, GR, LY, MP, KS, CT, CB, KH, EN, MN, GW, JW, SS, JS, MM, CS, CK, SM, WR, GD, JG, PL, MC, JC, SC, AS, GS, AB, KS, FM, DT No competing interests declared

Figures

Figure 1.
Figure 1.. EROS stabilises the expression of gp91phox precursor.
(A–C) Mouse constructs encoding EROS and gp91phox were co-transfected into NIH3T3 (A), COS-7 (B), and HEK293T (C) cell lines. gp91phox expression was analysed by immunoblotting; arrow indicates gp91phox band; ns: non-specific band. (D–F) gp91phox and p22phox expression in HEK293T cells following transfection with the indicated human constructs. (G) Left panel: analysis of the stability of the different forms of gp91phox (indicated by the arrows) following transfection in HEK293T cells in the presence or absence of EROS and treatment with 10 μg/mL cycloheximide. Right panel: quantitation of the cycloheximide assay (mean of four independent experiments; error bars indicate SD) represented as a fold change of gp91phox in cells expressing gp91phox and EROS vectors relative to gp91phox vector alone at 0 hr and normalised to actin expression. Actin and vinculin were used as loading control. (H) Stability of endogenous gp91phox in PLB985 neutrophil-like cells overexpressing lentivirus (LV) EROS-GFP vector (MW ≈ 41 kDa) and treated with 10 μg/mL cycloheximide. (I–J) gp91phox expression following lentiviral transduction of EROS-GFP, gp91phox, or both in differentiated PL985 knockout (KO) for p22phox (I) or EROS (J). Data are representative of three independent experiments. See also Figure 1—figure supplement 1 and Figure 1—source data 1–4.
Figure 1—figure supplement 1.
Figure 1—figure supplement 1.. EROS specifically regulates gp91phox not p22phox expression.
(A) Expression of gp91phox in human induced pluripotent stem cells (iPS)-derived macrophage deficient for EROS (lanes are triplicate). (B) Diagram depicting the different stages of gp91phox biosynthesis and formation of the heterodimer with p22phox. (C) gp91phox expression upon co-expression of gp91phox-GFP and EROS-FLAG vectors compared to gp91phox GFP alone in non-adherent HEK293-F. (D) Abundance of the 58 kDa form of gp91phox in mouse NIH3T3 cells upon co-expression of gp91phox and EROS human constructs. (E) Expression of p22phox in HEK293 cells co-transfected with p22phox and EROS mouse constructs compared to p22phox vector alone (lanes are triplicate). (F) Expression level of EROS in bone marrow-derived macrophages (BMDM) from gp91phox knockout (KO) mice compared to control mice. Data are representative of three independent experiments. (G) Histogram derived from gp91phox stability curve (Figure 1H) in absence (blue) or presence (red) of EROS (four independent experiments; p-value was determined using unpaired Student’s t-test; error bars indicate SD). See also Figure 1—figure supplement 1—source data 1–3.
Figure 2.
Figure 2.. EROS regulates flavocytochrome b formation via direct binding to gp91phox.
(A–D) Immunoprecipitation (IP) and size-exclusion chromatography (SEC) analysis of protein complexes associated with EROS. (A) IP of EROS in HEK293-F cells expressing StrepII-FLAG-tagged EROS, gp91phox-GFP, and p22phox with Western blot for gp91phox. Lysates treated with peptide N-glycosidase F (PNGaseF) or endoglycosidase H (EndoH) served as reference; FG: fully glycosylated; PG: partially glycosylated; NG: non-glycosylated; Tot: total lysate; RT: run through; Elu: eluate. (B) SEC profile of EROS-IP eluate indicating protein (280 nm) and heme (414 nm) content. (C) Immunoblot analysis of gp91phox-GFP, EROS-FLAG, and endogenous p22phox in SEC fractions 9–14 and 15–18. (D) SEC profile of EROS eluate from HEK293-F cells expressing EROS-FLAG, gp91phox, and p22phox constructs and treated with heme biosynthesis inhibitor succinyl acetone (10 µg/ml). (E) IP of StrepII-FLAG-tagged EROS in HEK293-F treated with succinyl acetone. (F) Interaction between gp91phox and EROS assessed through luminescence production in live HEK293T cells expressing the indicated plasmids fused with the large (LgBIT) or small (SmBIT) fragment of the NanoLuc luciferase (see ‘Methods’). Halo Tag (HT)-SmBIT is the negative control; RLU: relative luminescence unit. (G) Yeast growth phenotypes obtained with the specified selective media using gp91phox bait plasmid and EROS prey plasmid. L: leucine; W: tryptophan; H: histidine; DBD: DNA binding domain of Gal4; AD: activation domain of Gal4 (see ‘Methods’). (H) EROS localisation in HEK293 cells transfected with EROS construct (top panel; 3D stack) or EROS and Lap2-GFP constructs (bottom panel; single plane), fixed, permeabilised, and labelled with anti-EROS and anti-calnexin antibodies. Scale bar = 5 μm. Data are representative of at least three independent experiments; error bars indicate SEM of triplicates. See also Figure 2—figure supplement 1 and Figure 2—source data 1–2.
Figure 2—figure supplement 1.
Figure 2—figure supplement 1.. EROS acts at the early stage of gp91phox biosynthesis.
(A) Interaction of endogenous gp91phox and EROS analysed by immunoprecipitation (IP) of gp91phox followed by immunoblot of EROS in PLB985 cells. Immunoblot with p22phox serves as positive control (dashed lines indicate different exposure time). (B) Luminescence production from the eight different combinations of gp91phox (CYBB) and EROS (CYBC1) tagged with the large (L: LgBiT) fragment or small (S: SmBiT) fragment of the luciferase compared to combination with the Halo-Tag SmBiT (HT-S) control vector in HEK293 cells. Red box indicates selected constructs pair. (C) Nanoluc Binary Technology (NanoBiT) assay in HEK293 cells using gp91phox (CYBB) and EROS (CYBC1) encoded in a single construct (L-CYBC1-CYBB-S; see ‘Methods’); L-CYBC1 co-transfected with HT-S is the negative control. (D) HEK293 transfected with the indicated constructs were treated (right panel) or not (left panel) with succinyl acetone prior to analysis of NOX2 (gp91phox) expression. (E–G) Effect of EROS on the abundance of NOX2 homologues NOX1 (E), NOX4 (F), and NOX5 (G) in HEK293 or HEK293-F transfected with the indicated tagged constructs and treated or not with succinyl acetone (10 µg/mL). (H) Yeast 2 Hybrid analysis of EROS direct binding to NOX proteins family. (I) Expression of nox1 and nox4 in the specified tissues taken from control and EROS knockout (KO) mice (n = 4 biological replicates). Data are representative of three independent experiments; error bars indicate SEM of triplicates. See also Figure 2—figure supplement 1—source data 1–5.
Figure 2—figure supplement 2.
Figure 2—figure supplement 2.. Diagram depicting the role of EROS in gp91phox biosynthesis and formation of the heterodimer with p22phox.
Figure 3.
Figure 3.. EROS interacts and colocalises with the oligosaccharyltransferase (OST) complex.
(A) EROS-FLAG affinity purification-mass spectrometry (AP-MS). Graph showing abundance (average number of peptide spectrum matches across four biological replicates) of all proteins identified in the FLAG AP-MS experiments (blue and red dots) versus their interactor specificity (SAINT probability score: SP). The red line marks the SP score cut-off (0.9) for high-confidence interacting proteins. Proteins (dots) above this cut-off (59) are deemed high-confidence interactors. The bait (EROS) and interacting proteins relevant to this study are shown in red. (B) Protein interaction network of the 59 high-confidence EROS-interacting proteins (SP >0.9). The protein interactions were derived from STRING. Coloured nodes represent proteins annotated with enriched Gene Ontology (GO) terms relevant to this study. (C, D) EROS and gp91phox localization, following fixation and labelling with anti-EROS antibody, in HEK293 cells expressing STT3A-GFP and EROS constructs (C) or STT3A-GFP, gp91phox-mRFP and EROS untagged constructs (D); scale bars = 5 μm. Graphs represent the intensity profile of STT3A-GFP and EROS signal or STT3A-GFP, gp91phox-mRFP, and EROS signal measured across the nuclear membrane (indicated in red line). (E) Expression of gp91phox in HEK293 cells transfected with the indicated constructs and treated with OST inhibitor (NGI-1) at the indicated concentration. (F) Expression of gp91phox in control and STT3A-/- or STT3B-/- HEK293 cells transfected with the indicated vectors. (G) Expression of gp91phox in PLB985 cell line treated with NGI-1 at the indicated concentration. Data are representative of three independent experiments. See also Figure 3—figure supplement 1 and Figure 3—source data 1–3.
Figure 3—figure supplement 1.
Figure 3—figure supplement 1.. Analysis of gp91phox expression and ER-stress marker in different cell lines.
(A) gp91phox expression in control, STT3A-/-, STT3B-/- HEK293 transfected with the indicated constructs and treated with 10 µM NGI-1 or 2 µg/mL tunicamycin. (B) Expression level of the ER-stress marker BiP in control and STT3A-/- or STT3B-/- HEK293 cells transfected with the indicated constructs. (C) Immunoblot control of STT3A expression in control and STT3A-/- or STT3B-/- HEK293 cells; Exp: experiment. (D) Expression level of BiP upon treatment of PLB985 cells with different concentrations of the glycosylation inhibitors NGI-1 or tunicamycin. Data are representative of at least two independent experiments. See also Figure 3—figure supplement 1—source data 1 and 2.
Figure 4.
Figure 4.. Mass spectrometry analysis of proteins modulated by EROS in immune cells identified the P2X7 purinergic receptor.
(A) Cartoon representation of the AlphaFold structure prediction of the top ranked model. The structure is coloured according to the model quality with dark blue representing residues with a predicted local Distance Difference Test (plDDT) score > 90, light blue plDDT > 70, yellow plDDT > 50, and red plDDT ≤ 50. (B–D) Volcano plot of proteins detected by Tandem Mass Tagging proteomics analysis of bone marrow-derived macrophages: BMDM (B) and CD4+ T lymphocytes (C) isolated from control and EROS knockout (KO) mice. (D) Volcano plot of proteins recovered by Plasma Membrane Profiling of macrophages isolated from control and EROS KO mice. The volcano plots display statistical significance (-log10 p-value) versus the log2 fold change from five biological replicates.
Figure 5.
Figure 5.. EROS regulates P2X7 protein abundance by direct interaction and independently of the nicotinamide adenine dinucleotide phosphate (NADPH) oxidase.
(A–D) P2X7 expression analysed by Western blotting of macrophages isolated from control, EROS knockout (KO) (A) and gp91phox KO mice (B), induced pluripotent stem cells (iPS)-derived macrophages control or EROS-deficient (C) and of control PLB985 cells and an EROS-deficient clone (D). (E, F) P2X7 expression in RAW264.7 cells overexpressing a FLAG-tagged EROS vector (E) and in HEK293 cells transiently expressing the specified constructs (F). (G, H) Interaction between EROS and P2X7 probed by immunoprecipitation (IP) of EROS from RAW264.7 EROS-FLAG macrophages followed by immunoblot (IB) for P2X7 (G) and by Nanoluc Binary Technology (NanoBIT) assay in live HEK293 cells expressing the LgBIT-fused EROS vector with a SmBIT-fused P2X7 vector (H). (I) P2X1 expression in macrophages isolated from EROS KO mice compared to control. n = 5 biological replicates. (J) P2X1 abundance upon co-transfection with EROS construct in HEK293 cells. Data are representative of hree independent experiments; error bars indicate SEM of triplicates. See also Figure 5—figure supplement 1 and Figure 5—source data 1–4.
Figure 5—figure supplement 1.
Figure 5—figure supplement 1.. P2X7 expression is lower in numerous cell subsets from EROS knockout (KO) mice.
(A) P2X7 measured by surface flow cytometry staining of bone marrow-derived macrophages (BMDM) from control and EROS KO mice. (B) P2X7 level in peritoneal macrophages from control and EROS KO mice expressed by mean fluorescence intensity (left panel) and percentage of positive cells (right panel). (C) Western blot of P2X7, EROS, and actin expression in control and EROS-deficient whole splenic CD4 T cells. (D–I) Percentage of cells that are P2X7 positive in the specified splenic cell subsets. (J) Expression of P2X7 in HEK293 cells measured by flow cytometry following co-transfection with EROS. (K) Expression of the P2X7 homologue P2X4 in control and EROS-deficient BMDM analysed by Western blotting with the indicated antibody. n = 3–5 biological replicates. p-Value was determined using Student’s t-test; error bars indicate SEM. See also Figure 5—figure supplement 1—source data 1 and 2.
Figure 6.
Figure 6.. Functional consequences of low P2X7 expression in EROS-deficient cells.
(A) Calcium release tested by Rhod-3-AM calcium imaging assay, in control or EROS-deficient bone marrow-derived macrophages (BMDM) in response to bzATP treatment (with ionomycin as positive control); data is representative of three independent experiments. (B) IL-1β secretion following lipopolysaccharide (LPS) priming of peritoneal macrophages from control or EROS knockout (KO) mice before and after treatment with ATP. (C) Secretion of IL-1β following in vivo administration of LPS and then ATP to control or EROS KO mice (n = 3–5 biological replicates). (D) Decreased caspase-1 activity, detected through luminescence production (see ‘Methods’), in peritoneal macrophages from EROS KO mice compared to control mice following LPS priming and ATP treatment (n = 11 biological replicates). (E, F) Representative flow cytometry histogram of surface ligand CD62L (E) and CD27 (F) expression in CD4+ T cells isolated from EROS KO or control mice and treated with ATP (n = 5 biological replicates). Percentage of CD4+ T cells positive for CD62L or CD27 for each condition is shown on the left panel graphs. (G) Reduced phosphatidyl serine exposure and cell death in EROS-deficient CD4+ T cells compared to control CD4+ T cells following ATP treatment as analysed by flow cytometry staining with propidium iodide and annexin V. Left panel graph shows the percentage of CD4+ T cells undergoing apoptosis in each condition (representative of n = 5 biological replicates). (H) Control or EROS KO mice were infected intranasally with 3.103 PFU of A/X31 influenza. Signs of illness were monitored daily (n = 17 control, 15 EROS knockout biological replicates). p-Value was determined using unpaired Student’s t-test; error bars indicate SEM. See also Figure 6—figure supplement 1.
Figure 6—figure supplement 1.
Figure 6—figure supplement 1.. Cytokine profile and surface ligand expression in EROS-deficient cell subsets.
(A, B) In vitro secretion of the indicated cytokines pre- and post-ATP treatment of control and EROS-deficient peritoneal macrophages (n = 3 biological replicates). (C–F) In vivo secretion of the indicated cytokines in control and EROS knockout (KO) mice following ATP injection (n = 3–5 biological replicates). (G, H) Representative flow cytometry histogram of surface ligand CD62L (G) and CD27 (H) expression in CD4 T cells isolated from EROS KO or control mice and treated with NAD. Percentage of CD4 T cells positive for CD62L or CD27 for each condition is shown on the left panel graphs (n = 5 biological replicates). p-Value was determined using Student’s t-test; error bars indicate SEM.

Similar articles

Cited by

References

    1. Abo A, Pick E, Hall A, Totty N, Teahan CG, Segal AW. Activation of the NADPH oxidase involves the small GTP-binding protein p21rac1. Nature. 1991;353:668–670. doi: 10.1038/353668a0. - DOI - PubMed
    1. Alimchandani M, Lai J-P, Aung PP, Khangura S, Kamal N, Gallin JI, Holland SM, Malech HL, Heller T, Miettinen M, Quezado MM. Gastrointestinal histopathology in chronic granulomatous disease: a study of 87 patients. The American Journal of Surgical Pathology. 2013;37:1365–1372. doi: 10.1097/PAS.0b013e318297427d. - DOI - PMC - PubMed
    1. Arnadottir GA, Norddahl GL, Gudmundsdottir S, Agustsdottir AB, Sigurdsson S, Jensson BO, Bjarnadottir K, Theodors F, Benonisdottir S, Ivarsdottir EV, Oddsson A, Kristjansson RP, Sulem G, Alexandersson KF, Juliusdottir T, Gudmundsson KR, Saemundsdottir J, Jonasdottir A, Jonasdottir A, Sigurdsson A, Manzanillo P, Gudjonsson SA, Thorisson GA, Magnusson OT, Masson G, Orvar KB, Holm H, Bjornsson S, Arngrimsson R, Gudbjartsson DF, Thorsteinsdottir U, Jonsdottir I, Haraldsson A, Sulem P, Stefansson K. A homozygous loss-of-function mutation leading to CYBC1 deficiency causes chronic granulomatous disease. Nature Communications. 2018;9:4447. doi: 10.1038/s41467-018-06964-x. - DOI - PMC - PubMed
    1. Bartlett R, Stokes L, Sluyter R. The P2X7 receptor channel: recent developments and the use of P2X7 antagonists in models of disease. Pharmacological Reviews. 2014;66:638–675. doi: 10.1124/pr.113.008003. - DOI - PubMed
    1. Beaumel S, Grunwald D, Fieschi F, Stasia MJ. Identification of Nox2 regions for normal biosynthesis of cytochrome b558 in phagocytes highlighting essential residues for p22phox binding. The Biochemical Journal. 2014;464:425–437. doi: 10.1042/BJ20140555. - DOI - PubMed

Publication types