Review
. 2022 Nov 19;12(11):1578.
doi: 10.3390/brainsci12111578.

Neuromorphic-Based Neuroprostheses for Brain Rewiring: State-of-the-Art and Perspectives in Neuroengineering

Affiliations
Review

Neuromorphic-Based Neuroprostheses for Brain Rewiring: State-of-the-Art and Perspectives in Neuroengineering

Michela Chiappalone et al. Brain Sci. .

Abstract

Neuroprostheses are neuroengineering devices that have an interface with the nervous system and supplement or substitute functionality in people with disabilities. In the collective imagination, neuroprostheses are mostly used to restore sensory or motor capabilities, but in recent years, new devices directly acting at the brain level have been proposed. In order to design the next-generation of neuroprosthetic devices for brain repair, we foresee the increasing exploitation of closed-loop systems enabled with neuromorphic elements due to their intrinsic energy efficiency, their capability to perform real-time data processing, and of mimicking neurobiological computation for an improved synergy between the technological and biological counterparts. In this manuscript, after providing definitions of key concepts, we reviewed the first exploitation of a real-time hardware neuromorphic prosthesis to restore the bidirectional communication between two neuronal populations in vitro. Starting from that 'case-study', we provide perspectives on the technological improvements for real-time interfacing and processing of neural signals and their potential usage for novel in vitro and in vivo experimental designs. The development of innovative neuroprosthetics for translational purposes is also presented and discussed. In our understanding, the pursuit of neuromorphic-based closed-loop neuroprostheses may spur the development of novel powerful technologies, such as 'brain-prostheses', capable of rewiring and/or substituting the injured nervous system.

Keywords: brain rewiring; closed-loop; electroceuticals; hybrid neurotechnologies; in vitro; in vivo; neuromorphic; real-time.


Conflict of interest statement

The authors declare no conflict of interest.

Figures

Figure 8
Figure 8
In vitro approaches and topological features for realistic experimental models. (a) High-density MEAs (blue squares) provide a higher spatial resolution of the neuronal activity than conventional solutions (black circles). The sketch shows a typical scenario where the same surface can be mapped with 16 high-density microelectrodes with respect to only 4. This feature result is fundamental if many interacting neuronal population are coupled to a MEA. (b) Example of spontaneous cortical activity recorded by means of a 60- (top) and 4096-electrodes (bottom) MEA. In addition to the technological part, in vitro experimental models should simultaneously embed three features: (c) three-dimensionality connectivity (top, adapted from [123], bottom, from [124]); (d) modularity topology (top, adapted from [123]); (e) heterogeneity, i.e., the existence of different neuronal types (top, adapted from [123], bottom, from [122], where cortical (red) and thalamic (green) neurons are interconnected to realize a complex neuronal networks).
Figure 1
Figure 1
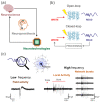
The main elements of a neuroprosthesis. (a). Neuroprostheses are the results of the dual interaction between neuroscience and neurotechnologies. (b). Open- and closed-loop architectures. In the open-loop modality (top), the delivered stimuli are not correlated to the network activity. On the contrary, closed-loop configurations (bottom) are based on feedback: the signals coming from the network are processed and specific features are extracted, thus producing triggering events which are responsible for delivering stimulation pulses according to the read network state. (c). Various options on the reading side are available for closed-loop. In the low frequency bands (up to 300 Hz), local field potentials can be detected, which carry information from a larger volume of the brain tissue and thus are more informative of the network activity. The high frequency components of the signal (>300 Hz) are characterized by fast extracellular spikes (indicated with a red asterisk—*), which represent the local activity in the neighborhood of the electrodes. Groups of spikes represent a burst (indicated by a horizontal red bar), while the presence of several bursts on the different recording electrodes generates the ‘network burst’.
Figure 2
Figure 2
Demonstrator of an in vitro neuromorphic prosthesis. (a1) Scheme of the bi-directional interface between the biological neural network—BNN (i.e., a bi-modular culture of biological neurons over a micro-electrode array—MEA) and the spiking neural network—SNN. The actual system is composed by the commercial amplifier, hosting the MEA with the culture, and the hardware board to perform the closed-loop real-time processing (i.e., spike detection and event detection) of the biological signals. (a2) The cartoon of a biological bi-modular culture over a MEA is reported (left). A focal lesion is performed to cut the connections between the two modules (center). Two are the possible reconnection strategies: the Bidirectional Bridging—BB (top right, used when the connection between the two modules is lost) and the Hybrid Bidirectional Bridging—HBB (bottom right, used when, after the lesion, one of the two modules is not functioning anymore, and thus it exploits an artificial spiking neural network—SNN). (b1) Schematic of the BB experimental protocol: after the first phase of basal activity (PreL), a laser cut (i.e., the lesion) was performed. Then, spontaneous activity was recorded again (PoL1), followed by the BB strategy and a final phase of spontaneous activity (PoL2). (b2) A 10-s raster plot of the network bursting activity of one representative experiment during a BB phase. (b3) The cross-correlation (CC) function for one representative experiment during the four phases of the experiment (different colors). (c1) Schematic of the HBB experimental protocol: after the first phase of basal activity (Pre-Lesion—PreL), a laser cut (i.e., the lesion) was performed. Then, spontaneous activity was recorded again (Post Lesion1—PoL1) followed by the HBB strategy and a final phase of spontaneous activity (Post Lesion2—PoL2). (c2) Raster plot of a spontaneous network burst in the BNN which triggers a stimulation to the SNN, which generates a network burst and a stimulation back to the BNN. (c3) Opposite situation with respect panel (c2): a spontaneous network burst is first generated in the SNN (right). (c4) CC function for one representative experiment during preL and HBB phases (different colours). Modified from [47].
Figure 3
Figure 3
Scheme of the experimental set-up. An Izhikevich SNN is implemented into FPGA board. Spikes outputs are converted into 8 × 8 images through vga to a Digital Micromirror Device projector (DMD) organized around an upright microscope where a biological neuronal network cultured on a multi-electrode array is placed. Neuronal activities are recorded by both electrical signals (MCS system) and optical signals (Calcium imaging). The next step is to close the loop, adding feature extraction from biological activity to feed in the SNN to achieve a real-time bi-directional communication. Adapted from [78].
Figure 4
Figure 4
Information transmission from SNN to BNN. (a) Heatmap of the maxIT (maximum information transmission) as a function of the response bin size T and the threshold on the scalar network response (SNR). The SNR is the count of all spikes evoked in the BNN within the time T following the stimulus. The threshold on the SNR sets the maximum limit of the SNR over which responses would be discarded for the maxIT quantification. This is to discard overshooting responses linked to network synchronization dynamics and not directly due to the stimulus feature such as the intensity, as also shown in panel (b). (b) In the representative experiment, the maximal information transmission was obtained with T = 90 ms and for a threshold of 200 spikes (red dot in the heatmap of panel (a). In the plot of the SNR as a function of stimulus intensity, the responses below threshold are shown in red and display a linear trend. (c) The maximum information transmission across all experiments is shown as a function of average stimulus frequency and entrainment index of the BNN. (d) The BNN entrainment index was calculated as the ratio of evoked (i.e., following the stimulus) versus spontaneous (i.e., distant from the stimulation time) network synchronizations. Adapted from [78].
Figure 5
Figure 5
BNN and SNN dynamics. Focus on a few hundreds of seconds of BNN and SNN recordings. From 690 to 749 s, (red horizontal bar) the SNN dynamic trains the BNN through stimulation (black asterisks, ‘*’). The raster plots of SNN (top) and BNN (bottom) are described in time bins of a hundred milliseconds. The total number of spikes in SNN and BNN are represented by the blue plots in the same time bins as the raster plots. We can notice a high correspondence between peaks in SNN and BNN when the communication from SNN to BNN is activated.
Figure 6
Figure 6
Overview of the methodological approaches. (a) Closed-loop system schematization to perform activity-dependent stimulation (ADS). The blue lines are the inclusive threshold, while the red line is exclusive. The length of the blue and red segments represents the time duration of a threshold limited by the onset sample bi and the end sample ci. The algorithm identifies as a spike a waveform characterized by an absolute value of its negative peak greater than a1 during b1c1 and that does not exceed a3 during b3c3, while the absolute value of its positive peak must exceed the threshold a2 during b2c2. Modified from [95]. (b) Neuromorphic-based burst detection scheme. The conversion of the neuronal signal into audio allows for executing the frequency band decomposition in order to prepare the input for the SpiNNaker module to discriminate between bursting and non-bursting activity. Modified from [94].
Figure 7
Figure 7
Bio-mimetic approach for the SNN. (a) Raster plot of a bio-mimetic SNN implemented on FPGA that is constituted of 100 cortical neurons distributed in a 10–90% ratio of fast spiking (FS) (blue) and regular spiking (RS) (red) neurons. FS neurons are inhibitory cortical neurons. RS neurons are the excitatory ones. The neurons are connected via synapses describing the electrical activity of AMPA and GABAa receptors. The different parameters of the model and network are tuned to obtain an activity similar to the one obtained in biology. (b) Membrane potential of two cortical neurons (Hodgkin-Huxley—HH model and synaptic noise) connected via AMPA synapse computed by FPGA. (c) Representation of the spatial structure of the neuron using compartmentalization (multicompartmental modeling).

Similar articles

Cited by

References

    1. Panuccio G., Semprini M., Natale L., Buccelli S., Colombi I., Chiappalone M. Progress in Neuroengineering for brain repair: New challenges and open issues. Brain Neurosci. Adv. 2018;2:2398212818776475. doi: 10.1177/2398212818776475. - DOI - PMC - PubMed
    1. Chin J.H., Vora N. The global burden of neurologic diseases. Neurology. 2014;83:349–351. doi: 10.1212/WNL.0000000000000610. - DOI - PMC - PubMed
    1. French B., Thomas L.H., Coupe J., McMahon N.E., Connell L., Harrison J., Sutton C.J., Tishkovskaya S., Watkins C.L. Repetitive task training for improving functional ability after stroke. Cochrane Database Syst. Rev. 2016;11 doi: 10.1002/14651858.CD006073.pub3. - DOI - PMC - PubMed
    1. WHO. The Top 10 Causes of Death. World Health Oraganization. Dec 9, 2020.
    1. Catani M., Ffytche D.H. The rises and falls of disconnection syndromes. Brain. 2005;128:2224–2239. doi: 10.1093/brain/awh622. - DOI - PubMed