. 2023 Jan 10;8(1):e154773.
doi: 10.1172/jci.insight.154773.

The tryptophan-metabolizing enzyme indoleamine 2,3-dioxygenase 1 regulates polycystic kidney disease progression

Affiliations

The tryptophan-metabolizing enzyme indoleamine 2,3-dioxygenase 1 regulates polycystic kidney disease progression

Dustin T Nguyen et al. JCI Insight. .

Abstract

Autosomal dominant polycystic kidney disease (ADPKD), the most common monogenic nephropathy, is characterized by phenotypic variability that exceeds genic effects. Dysregulated metabolism and immune cell function are key disease modifiers. The tryptophan metabolites, kynurenines, produced through indoleamine 2,3-dioxygenase 1 (IDO1), are known immunomodulators. Here, we study the role of tryptophan metabolism in PKD using an orthologous disease model (C57BL/6J Pkd1RC/RC). We found elevated kynurenine and IDO1 levels in Pkd1RC/RC kidneys versus wild type. Further, IDO1 levels were increased in ADPKD cell lines. Genetic Ido1 loss in Pkd1RC/RC animals resulted in reduced PKD severity, as measured by cystic index and percentage kidney weight normalized to body weight. Consistent with an immunomodulatory role of kynurenines, Pkd1RC/RC;Ido1-/- mice presented with significant changes in the cystic immune microenvironment (CME) versus controls. Kidney macrophage numbers decreased and CD8+ T cell numbers increased, both known PKD modulators. Also, pharmacological IDO1 inhibition in Pkd1RC/RC mice and kidney-specific Pkd2-knockout mice with rapidly progressive PKD resulted in less severe PKD versus controls, with changes in the CME similar to those in the genetic model. Our data suggest that tryptophan metabolism is dysregulated in ADPKD and that its inhibition results in changes to the CME and slows disease progression, making IDO1 a therapeutic target for ADPKD.

Keywords: Amino acid metabolism; Cellular immune response; Monogenic diseases; Nephrology.


Figures

Figure 1
Figure 1. ADPKD samples present with overexpression of IDO1.
(A) Western blot probing for IDO1 (left) and quantification (right) using WT and Pkd1RC/RC kidney homogenates, highlighting upregulation of IDO1 in Pkd1RC/RC kidneys compared with WT (n = 3 males/3 females, 9 months old). (B) Western blot probing for IDO1 (left) and quantification (right) of cell lysates obtained from normal renal cortical epithelial cells (RCTE, WT for PKD1) or 9-12 cells (null for PKD1) with and without IFN-γ stimulation, confirming overexpression of IDO1 in PKD-relevant human cell lines compared with control. IDO1 expression levels were further increased by the cytokine IFN-γ, which is known to be upregulated in PKD kidneys (n = 4 per condition). Data are presented as mean ± SEM. *P < 0.05 by unpaired t test (A) or 2-way ANOVA (Kruskal-Wallis P = 0.0373) with FDR Benjamini and Hochberg multiple-comparison test (B). Comparisons with nonsignificant statistics are not shown. (C) Western blot probing for IDO1 levels in epithelial cells obtained from individual cysts of ADPKD patients (each cyst was derived from a different patient; PKD genotype unknown). Most tested cysts showed high levels of IDO1 relative to IDO1 levels in RCTE or 9-12 cells (exposure time to detect IDO1 in RCTE or 9-12 cells was insufficient but IDO1 is expressed in these cell lines — see panel B). This provides direct clinical relevance for dysregulation of the tryptophan pathway in ADPKD patient kidneys. (D) Immunofluorescence images probing for IDO1 (red), E-cadherin (ECAD, green, epithelial cells), and DAPI (blue, nuclei). IDO1 is sparsely expressed in WT kidneys but upregulated in kidney cystic epithelial cells and interstitial cells of Pkd1RC/RC kidneys. Ido1-knockout animals served as negative control. *Indicates IDO1-positive interstitial cells in WT or Pkd1RC/RC;Ido1+/+ kidneys; #1 and #2 indicate 2 different Pkd1RC/RC;Ido1+/+ animals. Scale bars: 50 μm.
Figure 2
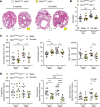
Figure 2. Genetic loss of Ido1 slows cyst growth and reduces tryptophan catabolite levels in kidneys of an orthologous ADPKD model.
(A) Kidney H&E cross sections of 3- and 6-month-old Pkd1RC/RC;Ido1+/+ (white) and Pkd1RC/RC;Ido1–/– (yellow) kidneys showing overall decreased cystic disease severity in 6-month-old PKD Ido1-null versus Ido1-WT animals. Scale bars: 500 μm. Quantification of (B) %KW/BW and (C) computed cyst volume (cystic index [Supplemental Figure 2A] multiplied by kidney weight), cyst number, and cyst size in Pkd1RC/RC;Ido1+/+ (white) and Pkd1RC/RC;Ido1–/– (yellow) animals, together providing statistical significance for reduced PKD severity in 6-month-old PKD Ido1-null versus Ido1-WT animals. Red data points depict the animal shown in A. (D) Quantification of significantly altered tryptophan catabolites assayed via mass spectrometry in Pkd1RC/RC;Ido1+/+ (white) and Pkd1RC/RC;Ido1–/– (yellow) kidneys. Loss of Ido1 partially corrected the observed increased levels of the immunosuppressive tryptophan catabolites, kynurenine and kynurenic acid, seen in Pkd1RC/RC kidneys (Supplemental Figure 2D). n = 5 males (diamonds) and 4–7 females (circles) per genotype and time point. Data are presented as mean ± SEM. *P < 0.05, **P < 0.01, ***P < 0.001, ****P < 0.0001 by 2-way ANOVA with Tukey’s multiple-comparison test.
Figure 3
Figure 3. The kidney immune landscape of Pkd1RC/RC;Ido1–/– mice favors slowed PKD progression.
(A) Flow cytometry quantification of CD45+ immune cells within single-cell suspensions of Pkd1RC/RC;Ido1+/+ (white boxplots) and Pkd1RC/RC;Ido1–/– (yellow boxplots) kidneys showing an increase in CD45+ cells with PKD progression (3 to 6 months of age, Pkd1RC/RC;Ido1+/+ mice) and a decrease in PKD Ido1-null versus WT animals at 6 months of age when reduced PKD severity was observed. (B) Representative flow cytometry plots indicating the gating strategy of infiltrating (F4/80lo, CD11b+) versus resident (F4/80hi, CD11b+) macrophages (left), and quantification (right), highlighting a significant increase in macrophages as disease progresses from 3 to 6 months of age in Pkd1RC/RC;Ido1+/+ mice and a decrease at 6 months of age in Pkd1RC/RC;Ido1–/– mice versus WT. (C) Flow cytometry data quantification of all T cells (TCRβ+) and CD4+ or CD8+ subpopulations. The numbers of CD4+ or CD8+ cells in kidneys did not change significantly upon Ido1 loss. (D) Quantification of CD4+ and CD8+ T cell numbers as percentage TCRβ+ cells, showing a shift in distribution of T cell subpopulations with an increase in CD8+ T cell numbers upon Ido1 loss and reduced PKD severity (6 months of age). (E) Representative flow cytometry plot (left) and quantification (right) of immune checkpoint ligand PD-L1 expression on kidney epithelial cells (plot and quantification, EpCAM+) and macrophages (quantification only, F4/80+) indicating reduced expression in 6-month-old Pkd1RC/RC;Ido1–/– animals versus control (Pkd1RC/RC;Ido1+/+). (F) Quantification of immune checkpoint receptor PD-1 expression on CD8+ T cells showing a decrease in expression in 6-month-old Pkd1RC/RC;Ido1–/– animals versus control (Pkd1RC/RC;Ido1+/+). Whiskers show the 10th–90th percentile. *P < 0.05, **P < 0.01, ***P < 0.001, ****P < 0.0001 by 2-way ANOVA with Tukey’s multiple-comparison test. Comparisons with nonsignificant statistics are not shown. n = 5 males and 4–7 females per genotype/time point.
Figure 4
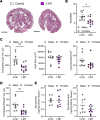
Figure 4. Treatment with a tryptophan analog shows therapeutic efficacy for halting slowly progressive ADPKD and is associated with changes in the immune microenvironment.
Results obtained from Pkd1RC/RC mice treated with (blue) or without (white) 1-MT. (A) H&E cross sections. Quantification of (B) %KW/BW and (C) cystic volume (cystic index multiplied by KW), cyst number, and cyst size (cystic index, fibrotic volume/index, and BUN can be found in Supplemental Figure 5). Pkd1RC/RC mice treated with 1-MT show significantly reduced PKD severity compared with control (Cntrl.). (D) Quantification of significantly altered tryptophan catabolites assayed via mass spectrometry. 1-MT treatment significantly reduced levels of the immunosuppressive metabolite kynurenic acid. (E and F) Quantification of flow cytometry data of the 1-MT intervention experiment. 1-MT–treated animals have (E) reduced numbers in overall immune cells (CD45+), and resident macrophages (F4/80hi, CD11b+), but not infiltrating macrophages (F4/80lo, CD11b+), and (F) increased numbers of CD8+ T cells as percentage of all T cells (TCRβ+). (G) Expression of PD-L1 on macrophages (F4/80+) and numbers of Tregs (CD4+, FoxP3+) are reduced, both suggesting a less immunosuppressed cystic microenvironment. Scale bars: 500 μm. Treatment (1-MT): 4–7 weeks of age, n = 3 males (diamonds) and 3 females (circles)/group. Graphs in B–D show the mean ± SEM and the whiskers in the box-and-whisker plots in E–G box plot show 10th–90th percentiles. *P < 0.05, **P < 0.01, ***P < 0.001, ***P < 0.0001 by unpaired t test.
Figure 5
Figure 5. 1-MT treatment slows PKD progression in a rapidly progressive, inducible PKD2 model.
Results obtained from Pax8rtTA;TetO-cre;Pkd2fl/fl mice treated with (purple) or without (white) 1-MT. (A) H&E cross sections. Quantification of (B) %KW/BW, (C) cystic volume (cystic index multiplied by KW), cyst size, and cyst number, and (D) fibrotic volume (cystic index, fibrotic index, and BUN can be found in Supplemental Figure 6). Pax8rtTA;TetO-cre;Pkd2fl/fl mice treated with 1-MT show significantly reduced PKD severity compared with control (Cntrl.). (E) Quantification of significantly altered tryptophan catabolites assayed via mass spectrometry. 1-MT treatment results in a trend toward reduced levels of the immunosuppressive metabolite kynurenic acid. Scale bars: 1 mm. Treatment (1-MT): P12–P21, n = 5–6 males (diamonds) and 4–5 females (circles). Control: n = 3–5 males (diamonds) and 4 females (circles). Data are presented as mean ± SEM. *P < 0.05, **P < 0.01 by unpaired t test. Comparisons with nonsignificant statistics are not shown.

References

    1. Bergmann C, et al. Polycystic kidney disease. Nat Rev Dis Primers. 2018;4(1):50. doi: 10.1038/s41572-018-0047-y. - DOI - PMC - PubMed
    1. Torres VE, et al. Autosomal dominant polycystic kidney disease. Lancet. 2007;369(9569):1287–1301. doi: 10.1016/S0140-6736(07)60601-1. - DOI - PubMed
    1. Reule S, et al. ESRD from autosomal dominant polycystic kidney disease in the United States, 2001-2010. Am J Kidney Dis. 2014;64(4):592–599. doi: 10.1053/j.ajkd.2014.05.020. - DOI - PMC - PubMed
    1. United States Renal Data System. 2018 USRDS Annual Data Report: Epidemiology of kidney disease in the United States. National Institutes of Health, National Institute of Diabetes and Digestive and Kidney Diseases. https://www.niddk.nih.gov/about-niddk/strategic-plans-reports/usrds/prio... Accessed December 13, 2022.
    1. Torres VE, et al. Tolvaptan in patients with autosomal dominant polycystic kidney disease. N Engl J Med. 2012;367(25):2407–2418. doi: 10.1056/NEJMoa1205511. - DOI - PMC - PubMed

Publication types

MeSH terms