. 2022 Nov 11;10(11):1907.
doi: 10.3390/vaccines10111907.

Immunopeptidomic Analysis of BoLA-I and BoLA-DR Presented Peptides from Theileria parva Infected Cells

Affiliations

Immunopeptidomic Analysis of BoLA-I and BoLA-DR Presented Peptides from Theileria parva Infected Cells

Timothy Connelley et al. Vaccines (Basel). .

Abstract

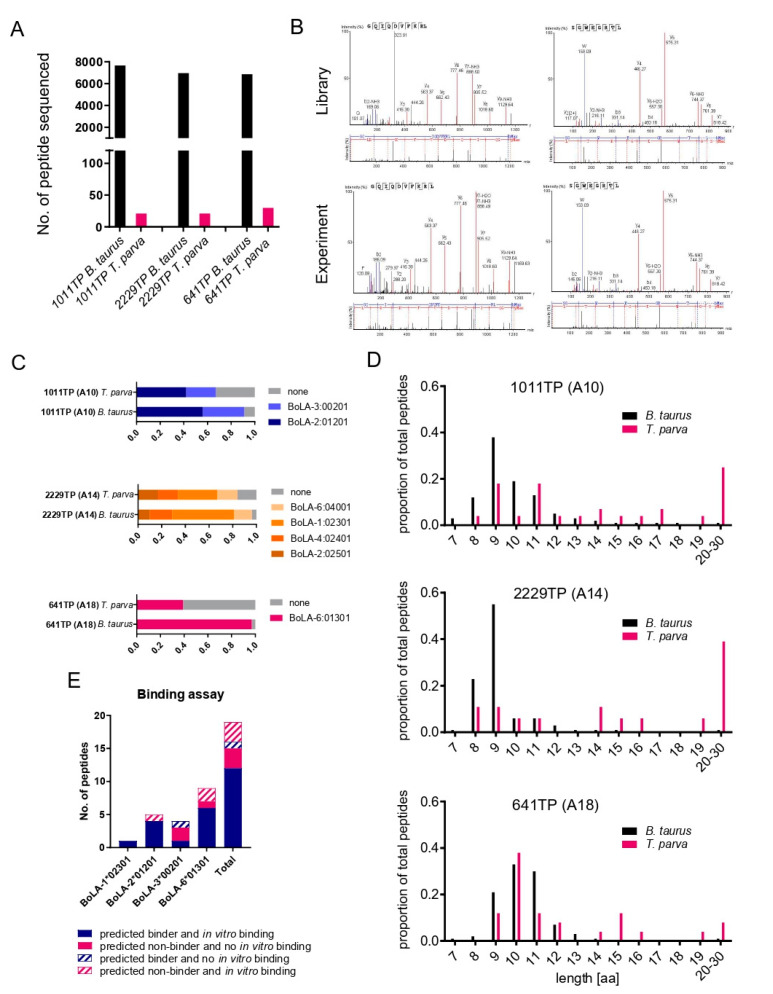
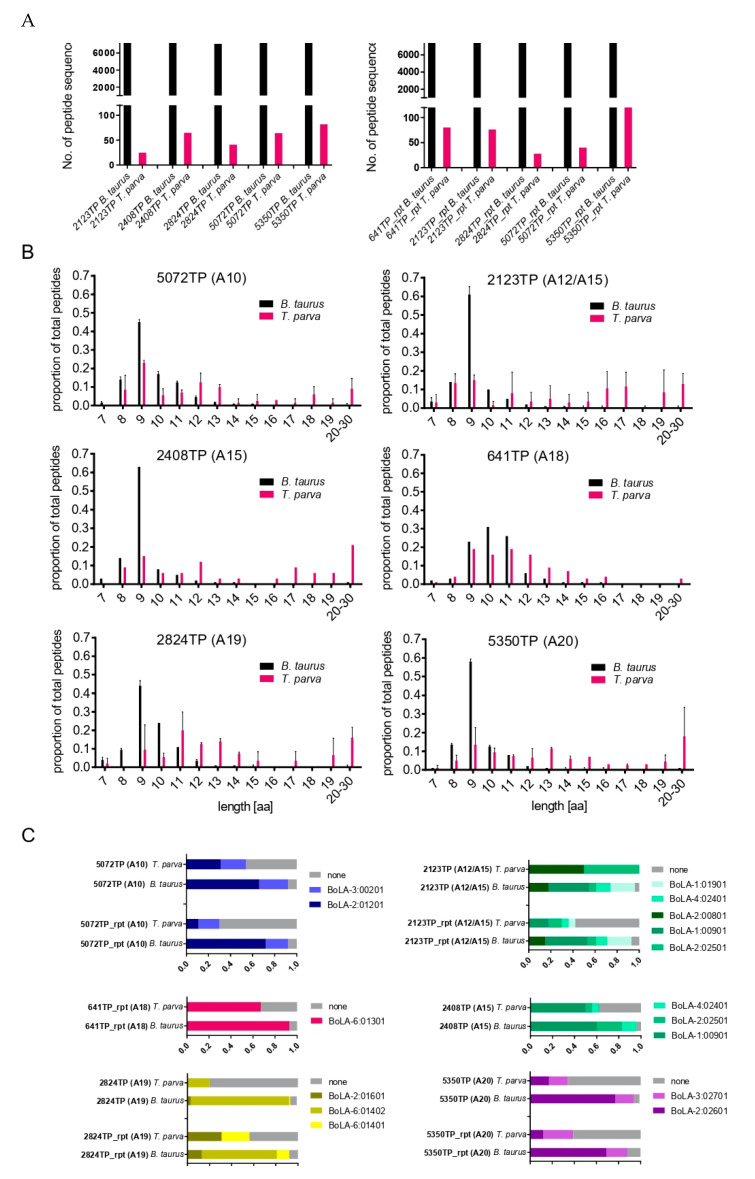
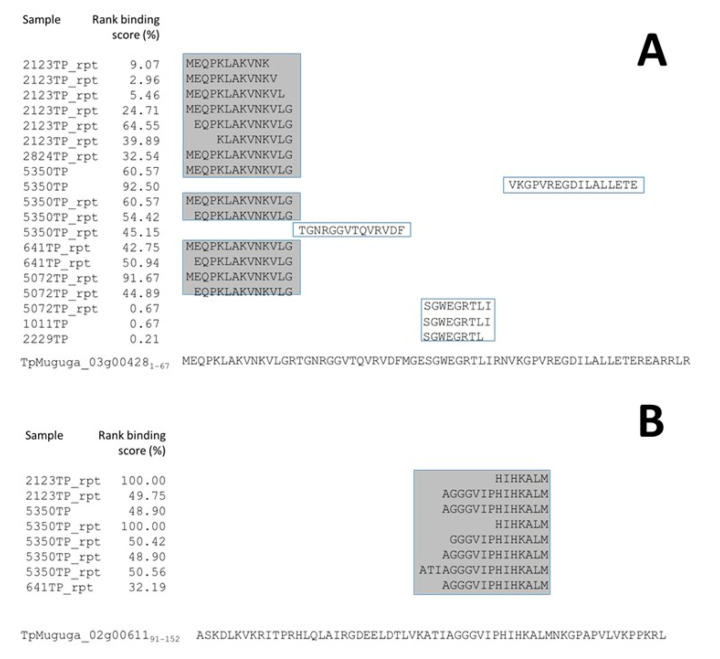
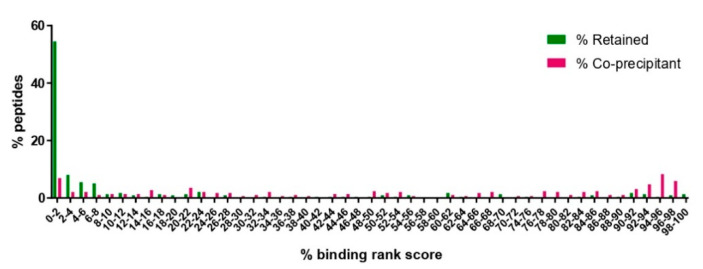
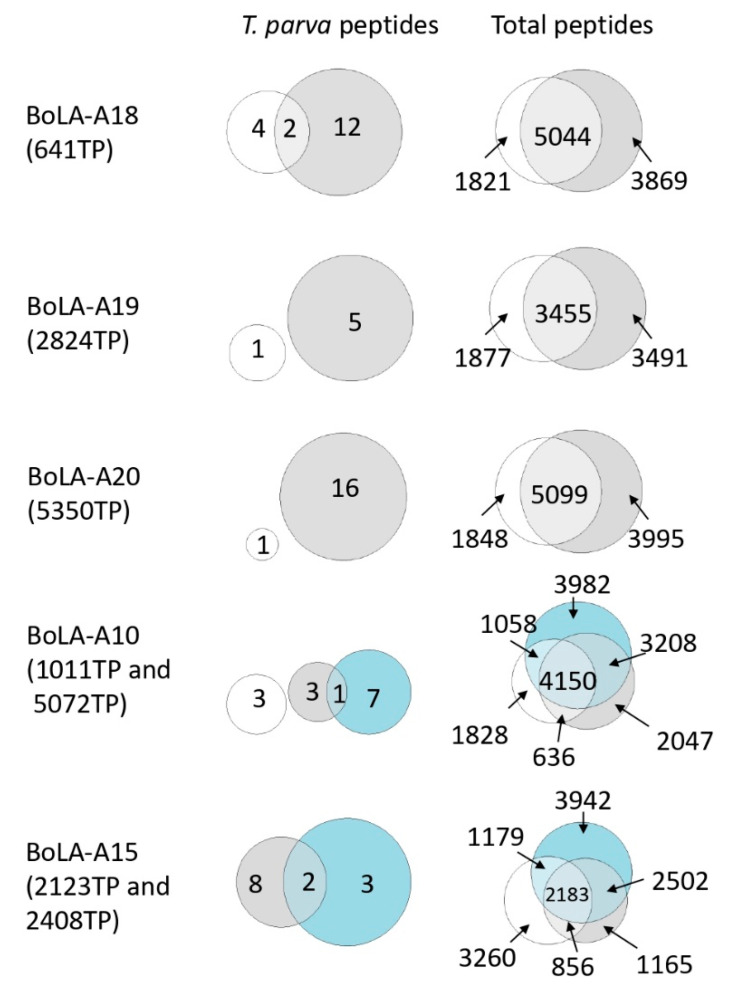
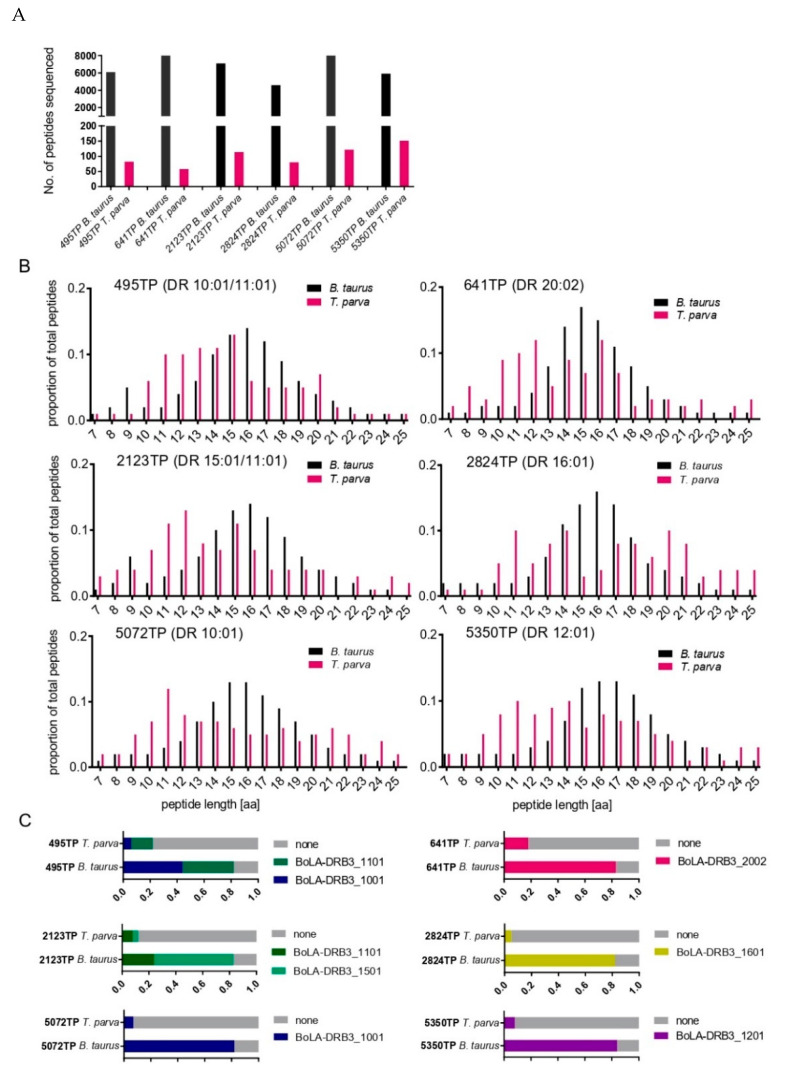
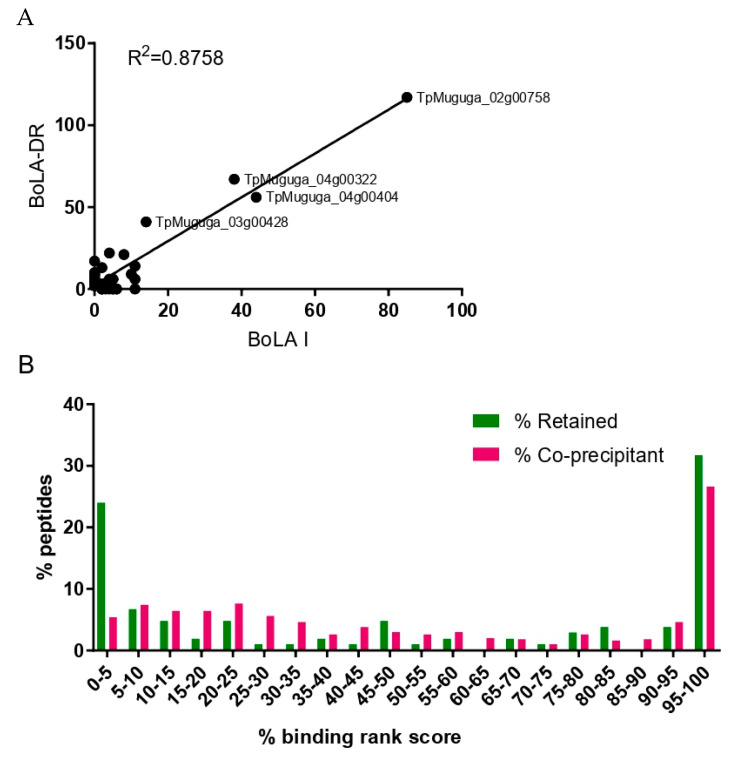
The apicomplexan parasite Theileria parva is the causative agent of East Coast fever, usually a fatal disease for cattle, which is prevalent in large areas of eastern, central, and southern Africa. Protective immunity against T. parva is mediated by CD8+ T cells, with CD4+ T-cells thought to be important in facilitating the full maturation and development of the CD8+ T-cell response. T. parva has a large proteome, with >4000 protein-coding genes, making T-cell antigen identification using conventional screening approaches laborious and expensive. To date, only a limited number of T-cell antigens have been described. Novel approaches for identifying candidate antigens for T. parva are required to replace and/or complement those currently employed. In this study, we report on the use of immunopeptidomics to study the repertoire of T. parva peptides presented by both BoLA-I and BoLA-DR molecules on infected cells. The study reports on peptides identified from the analysis of 13 BoLA-I and 6 BoLA-DR datasets covering a range of different BoLA genotypes. This represents the most comprehensive immunopeptidomic dataset available for any eukaryotic pathogen to date. Examination of the immunopeptidome data suggested the presence of a large number of coprecipitated and non-MHC-binding peptides. As part of the work, a pipeline to curate the datasets to remove these peptides was developed and used to generate a final list of 74 BoLA-I and 15 BoLA-DR-presented peptides. Together, the data demonstrated the utility of immunopeptidomics as a method to identify novel T-cell antigens for T. parva and the importance of careful curation and the application of high-quality immunoinformatics to parse the data generated.

Keywords: MHC; antigen processing and presentation; cattle; parasite-protozoan.


Conflict of interest statement

The authors declare no conflict of interest.

Figures

Figure 1
Figure 1
Characteristics of BoLA-I-eluted peptides from 1011TP, 2229TP, and 641TP cell lines. (A) Number of B. taurus and T. parva peptide sequences identified in each sample. (B) Spectra obtained from the experiment (bottom), and synthetic library (top), respectively, for two example peptides that were mapped to the T. parva proteome. The most abundant, annotated b- (N-terminal) and y- (C-terminal) fragment ions are indicated together with the measured mass over charge ratio. (C) Binding predictions of B. taurus and T. parva 8–12 mer peptides stratified by their predicted BoLA-I allele of origin (peptides with a rank predicted binding score of <2% to a BoLA-I allele were considered to be binders). Peptides predicted to be MHC-binders are represented by coloured blocks, peptides predicted to be non-MHC binders are represented by grey blocks; the size of the blocks is proportional to the number of peptides in the respective datasets. (D) Length distributions of B. taurus and T. parva peptides were identified in each sample. The horizontal axis shows the length of peptides, and the vertical axis shows the proportion of the peptides identified for each length. (E) A summary of results from a subset of peptides assayed in an in vitro BoLA-I binding assay is presented in Table 2. For each BoLA allele and for all of the BoLA alleles combined (Total), the number of peptides for which the in vitro assay corroborated the in silico predicted capacity to bind to BoLA-I are shown as filled bars, whilst peptides for which the results from the in vitro binding did not support the in silico prediction are shown as hatched bars, as described in the legend.
Figure 2
Figure 2
Characteristics of BoLA-I-eluted peptides from 5072TP/5072TP_rpt (A10), 2123TP/2123TP_rpt (A12/A15), 2408TP (A15), 2824TP/2824TP_rpt (A19), 641TP_rpt (A18), and 5350TP/5350TP_rpt (A20) cell lines. (A) Number of B. taurus and T. parva peptide sequences identified in each sample. (B) Length distributions of B. taurus and T. parva peptides identified in each sample. The horizontal axis shows the length of peptides, and the vertical axis shows the proportion of the peptides identified for each length. For samples that had been analysed in two independent elutions, the data has been amalgamated into a single panel. (C) Binding predictions of B. taurus and T. parva 8–12-mer peptides stratified by their predicted BoLA-I allele of origin (peptides with a rank predicted binding score of <2% to a BoLA-I allele were considered to be binders). Peptides predicted to be MHC-binders are represented by coloured blocks, peptides predicted to be non-MHC binders are represented by grey blocks; the size of the blocks is proportional to the number of peptides in the respective datasets.
Figure 3
Figure 3
Alignment of peptides identified from (A) TpMuguga_03g00428 (ribosomal protein S28-B40S) and (B) TpMuguga_02g00611 (histone H2A variant 1) in BoLA-I elution datasets. (A) The 19 peptides identified from 8 different samples are shown aligned against the parent protein. Fourteen of the peptides (from 6 different samples representing 4 different MHCI haplotypes) are found as overlapping peptides in the 1–14 region. The median rank-predicted binding score of these peptides is 43.8% (range = 2.96–64.55%), with none predicted to be BoLA-I binders. The mean length of the peptides was 13 a.a. (B) The 8 peptides identified from 4 different samples (representing 3 different MHCI haplotypes) are shown aligned against the parent protein. All 8 peptides are overlapping peptides in the 121–137 region. The median rank-predicted score of these peptides is 50.1% (range = 32.2–100%), with none predicted to be BoLA-I binders. None of the peptides were of the 8–12 a.a. length of canonical MHCI-binding peptides.
Figure 4
Figure 4
The distribution of predicted percent rank binding scores for peptides considered to be co-precipitants and peptides retained in the combined BoLA-I dataset after removal of the coprecipitating peptides. Peptides with a predicted percent rank binding score of <2% are considered to be binders. A small number of short peptides (<8 amino acids long, n = 8) that did not receive a predicted percent rank binding score were ascribed a default value of 100%.
Figure 5
Figure 5
Overlap between the peptidomes identified from duplicate analysis of BoLA-A18, BoLA-A19, and BoLA-A20 samples and from samples sharing the BoLA-A10 and BoLA-A15 haplotypes. Euler diagrams displaying the overlap in the T. parva (left) and total (right) peptidomes of duplicated samples or samples sharing BoLA-I haplotypes. The number of peptides that are unique to each sample and shared between samples is indicated. The peptides identified in replicate samples were: BoLA-A18—RMDDKSGGLL from TpMuguga_01g00736 (hypothetical protein) and GEFEKKYIPTL from TpMuguga_01g00757 (Ras family protein); BoLA-A10—AGVELDTQKKFL from TpMuguga_03g00858 (multiprotein-bridging factor 1c); BoLA-A15—FEYEFPINH from TpMuguga_01g00471 (bifunctional thioredoxin reductase/thioredoxin); and EEIAHVLHY from TpMuguga_01g02030 (hypothetical protein). Note that in the BoLA-A15 group, there were no T. parva peptides identified in sample 2123TP and so this sample is not represented in the T. parva euler diagram.
Figure 6
Figure 6
Characteristics of BoLA-DR eluted peptides from 2123TP (BoLA-DR 15:01/11:01), 2824TP (BoLA-DR 16:01), 5072TP (BoLA-DR 10:01), 641TP (BoLA-DR 20:02), 495TP (BoLA-DR 10:01/11:01), and 5350TP (BoLA-DR 12:01) cell lines. (A) Number of B. taurus and T. parva peptide sequences identified in each sample. (B) Length distributions of B. taurus and T. parva peptides identified in each sample. The horizontal axis shows the length of peptides, and the vertical axis shows the proportion of the peptides identified for each length. (C) Binding predictions of B. taurus and T. parva 13–21-mer peptides stratified by their predicted BoLA-DR allele of origin (peptides with a rank-predicted binding score of <5% to a BoLA-DR allele were considered to be binders). Peptides predicted to be MHC-binders are represented by coloured blocks, peptides predicted to be non-MHC binders are represented by grey blocks; the size of the blocks is proportional to the number of peptides in the respective datasets.
Figure 7
Figure 7
Coprecipitating peptides in the BoLA-MHCI and BoLA-DR datasets. (A) A scatterplot showing the level of correlation between the proteins from which coprecipitating peptides were derived in the BoLA-I and BoLA-DR datasets. Each point represents a single protein, and the number of coprecipitating peptides from individual proteins in the BoLA-MHCI and BoLA-DR datasets is shown on the horizontal and vertical axis, respectively. The R2 value calculated from the Pearson’s coefficient of correlation is shown. (B) The distribution of percent rank prediction scores for peptides considered to be coprecipitants and peptides retained after removal of the coprecipitant peptides in the combined BoLA-DR dataset. Peptides with a percent rank prediction score of <5% are considered to be binders. A small number of short peptides (<9 amino acids long, n = 26) that did not receive a percent rank prediction score were ascribed a default value of 100%.

Similar articles

Cited by

References

    1. East Coast Fever. [(accessed on 30 September 2022)]. Available online: https://www.galvmed.org/livestock-and-diseases/livestock-diseases/east-c...
    1. Goddeeris B.M., Morrison W.I., Toye P.G., Bishop R. Strain specificity of bovine Theileria parva-specific cytotoxic T cells is determined by the phenotype of the restricting class I MHC. Immunology. 1990;69:38–44. - PMC - PubMed
    1. Goddeeris B.M., Morrison W.I., Teale A.J. Generation of bovine cytotoxic cell lines, specific for cells infected with the protozoan parasite Theileria parva and restricted by products of the major histocompatibility complex. Eur. J. Immunol. 1986;16:1243–1249. doi: 10.1002/eji.1830161010. - DOI - PubMed
    1. McKeever D.J., Taracha E.L., Innes E.L., MacHugh N.D., Awino E., Goddeeris B.M., Morrison W.I. Adoptive transfer of immunity to Theileria parva in the CD8+ fraction of responding efferent lymph. Proc. Natl. Acad. Sci. USA. 1994;91:1959–1963. doi: 10.1073/pnas.91.5.1959. - DOI - PMC - PubMed
    1. Taracha E.L., Goddeeris B., Teale A.J., Kemp S.J., Morrison W.I. Parasite strain specificity of bovine cytotoxic T cell responses to Theileria parva is determined primarily by immunodominance. J. Immunol. 1995;155:4854–4860. - PubMed