. 2022 Nov 12;14(11):2509.
doi: 10.3390/v14112509.

Phosphatidylinositol 4,5-Bisphosphate Mediates the Co-Distribution of Influenza A Hemagglutinin and Matrix Protein M1 at the Plasma Membrane

Affiliations

Phosphatidylinositol 4,5-Bisphosphate Mediates the Co-Distribution of Influenza A Hemagglutinin and Matrix Protein M1 at the Plasma Membrane

Prakash Raut et al. Viruses. .

Abstract

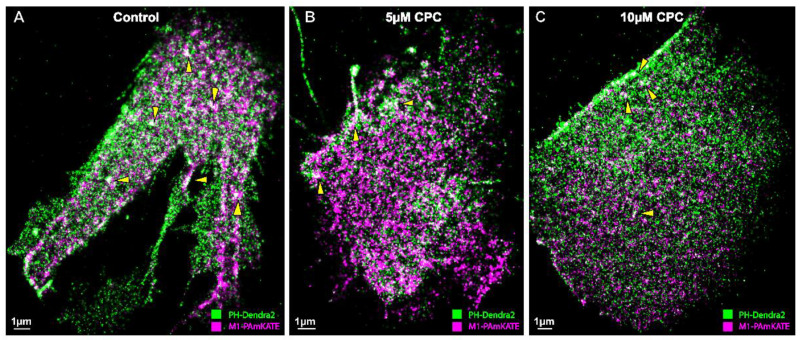
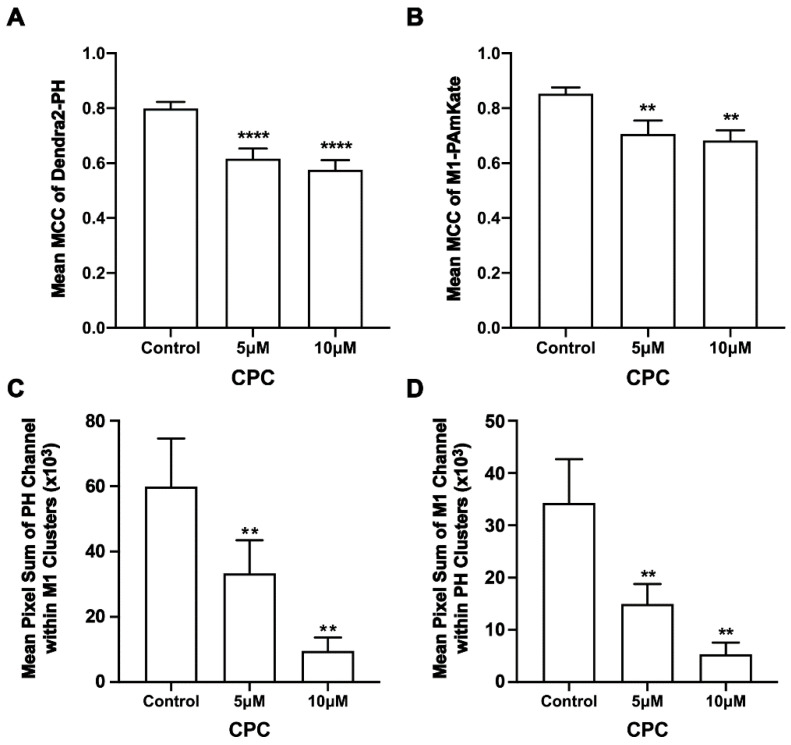
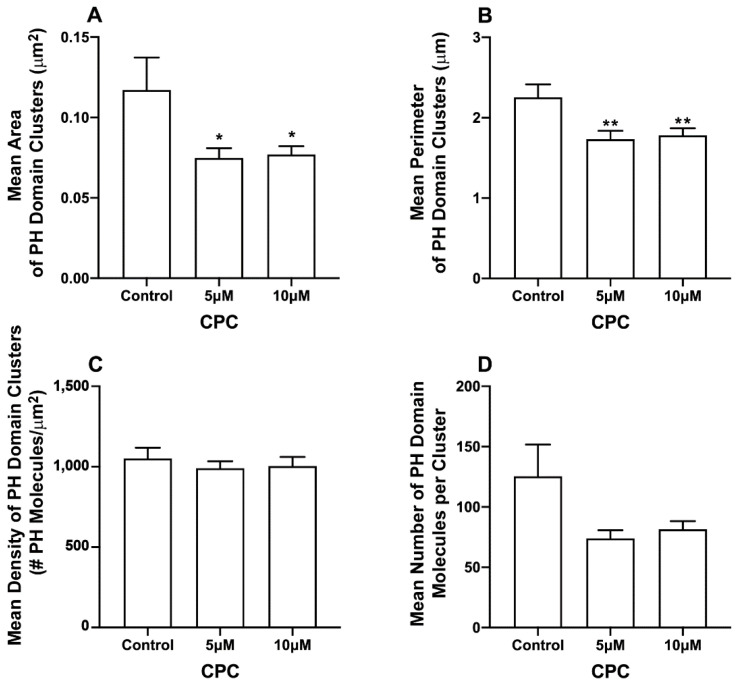
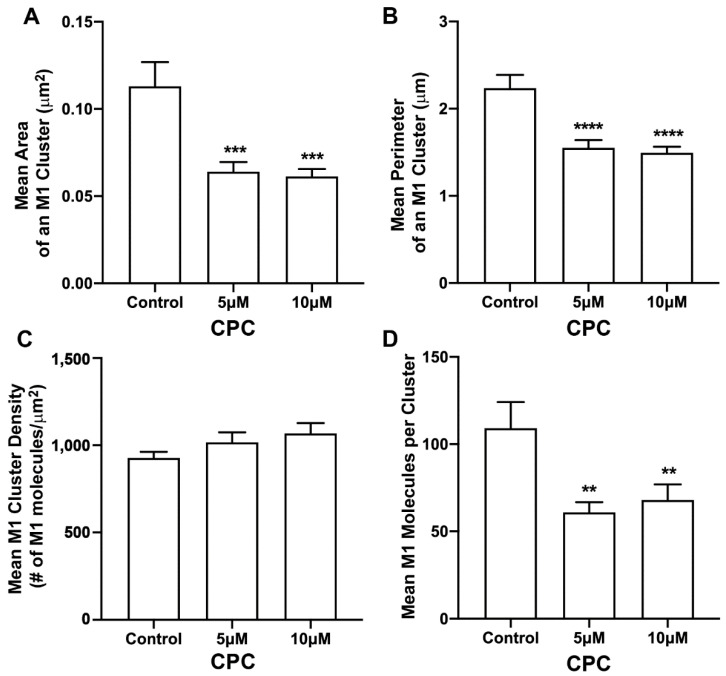
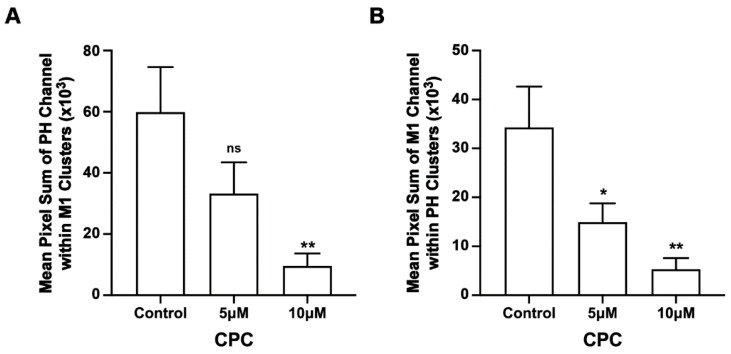
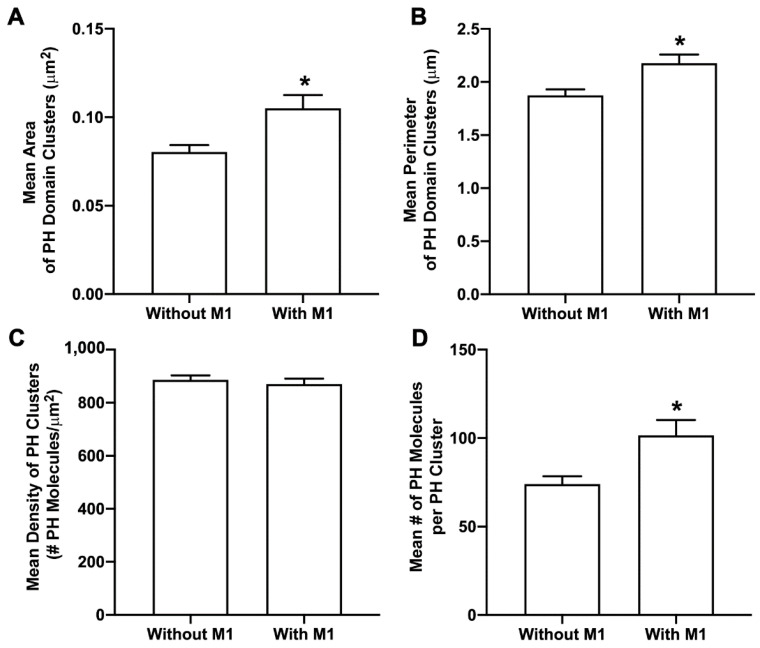
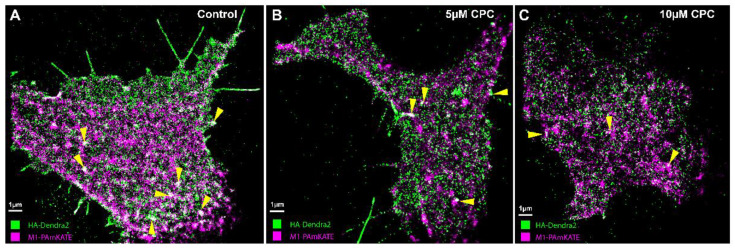
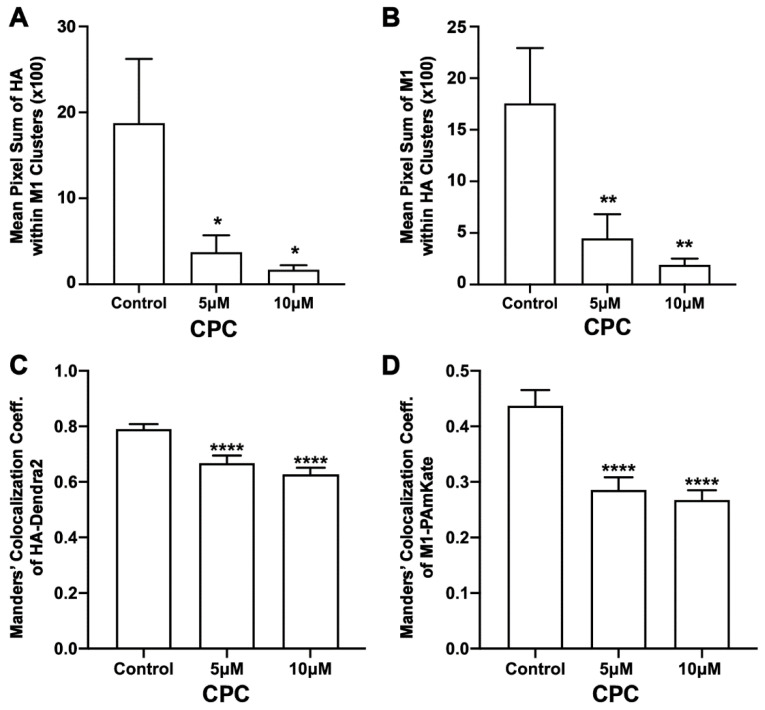
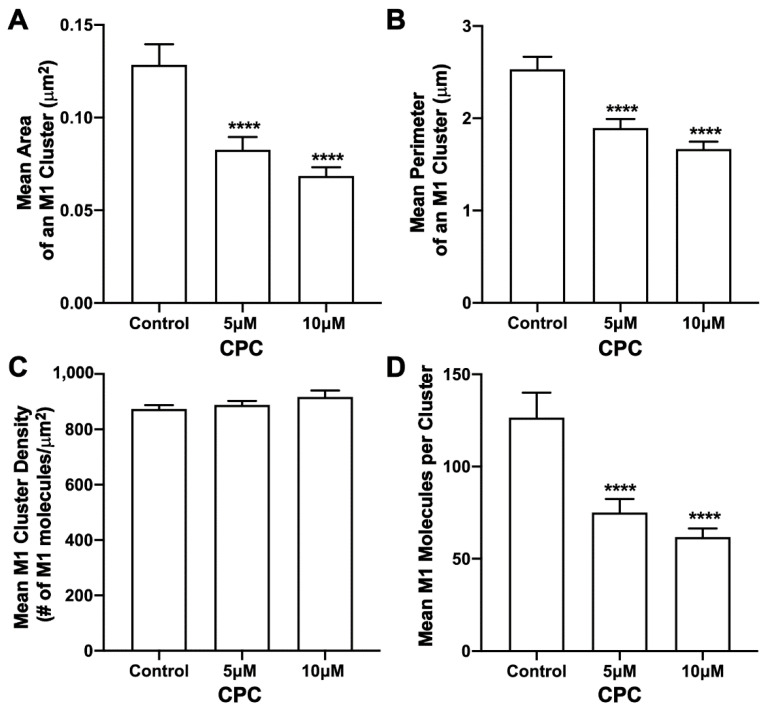
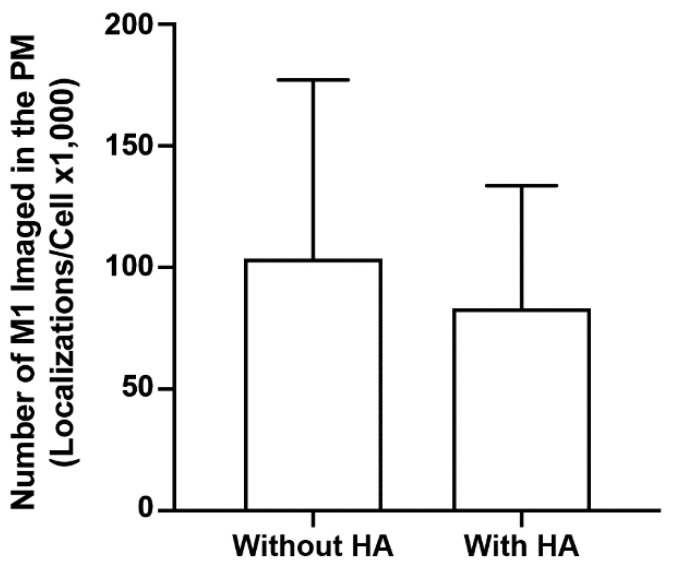
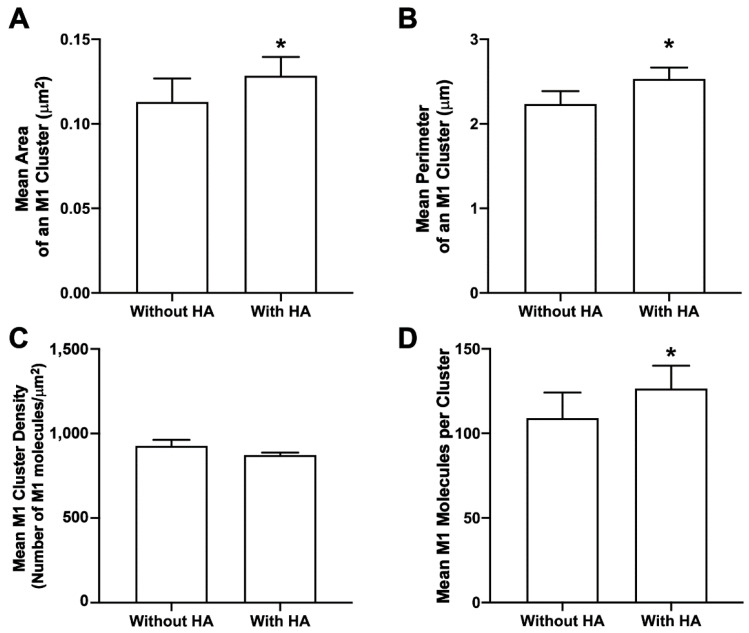
The fully assembled influenza A virus (IAV) has on its surface the highest density of a single membrane protein found in nature-the glycoprotein hemagglutinin (HA) that mediates viral binding, entry, and assembly. HA clusters at the plasma membrane of infected cells, and the HA density (number of molecules per unit area) of these clusters correlates with the infectivity of the virus. Dense HA clusters are considered to mark the assembly site and ultimately lead to the budding of infectious IAV. The mechanism of spontaneous HA clustering, which occurs with or without other viral components, has not been elucidated. Using super-resolution fluorescence photoactivation localization microscopy (FPALM), we have previously shown that these HA clusters are interdependent on phosphatidylinositol 4,5-biphosphate (PIP2). Here, we show that the IAV matrix protein M1 co-clusters with PIP2, visualized using the pleckstrin homology domain. We find that cetylpyridinium chloride (CPC), which is a positively charged quaternary ammonium compound known for its antibacterial and antiviral properties at millimolar concentrations, disrupts M1 clustering and M1-PIP2 co-clustering at micromolar concentrations well below the critical micelle concentration (CMC). CPC also disrupts the co-clustering of M1 with HA at the plasma membrane, suggesting the role of host cell PIP2 clusters as scaffolds for gathering and concentrating M1 and HA to achieve their unusually high cluster densities in the IAV envelope.

Keywords: FPALM; PIP2; cetylpyridinium chloride; hemagglutinin; host–virus interactions; influenza A; matrix protein M1; phosphoinositides; super-resolution fluorescence microscopy; virus assembly.


Conflict of interest statement

The authors declare no conflict of interest.

Figures

Figure 1
Figure 1
Super-resolution image showing the colocalization of PIP2 and M1. NIH3T3 cells expressing PH-Dendra2 (green) and M1-PAmKate (magenta) were exposed to control media (0 µM CPC+ Tyrode’s-BSA vehicle), 5 µM CPC, or 10 µM CPC, and were incubated at 37 °C for an hour. Cells were chemically fixed after an hour using 4% PFA. Two-color FPALM imaging of the PM of the cells was carried out in TIRF illumination. Cells treated with (A) control show a higher degree of colocalization (white) relative to the (B) 5 µM CPC and (C) 10 µM CPC treatments. The areas of co-clustering (white) decrease with the CPC treatment. Examples of colocalization (white) are shown by the yellow triangles. Scale bar = 1 μm.
Figure 2
Figure 2
CPC reduces the colocalization and co-clustering of PIP2 and M1 in fixed NIH3T3 cells. NIH3T3 cells expressing PH-Dendra2 and M1-PAmKate were exposed to control media (0 µM CPC+ Tyrodes-BSA vehicle), 5 µM CPC, and 10 µM CPC and incubated at 37 °C for an hour. After an hour, cells were fixed using 4% PFA. Two-color FPALM imaging of PH-Dendra2 and M1-PAmKate was carried out with TIRF illumination. Localizations were assigned to one of the two channels according to their α values and were binned in pixels of dimensions 80 nm × 80 nm. (A,B) The Manders’ Colocalization Coefficient (MCC) was quantified and plotted as a function of CPC treatment. Both the MCC values—(A) PH-Dendra2 with PAmKate and (B) M1-PAmKate with PH-Dendra2—decreased significantly with CPC treatment. Values presented are mean ± SEM for a total of 33 cells for control, 31 cells for 5 µM, and 32 cells for the 10 µM CPC treatment from three independent experiments. Statistically significant results are represented by **** (p < 0.0001) and ** (p < 0.01) determined by ordinary one-way ANOVA. (C,D) Pixels containing clusters (defined as at least 5 localizations of a given species) were identified, and for each such pixel a sum of the number of localizations of M1 and PH was calculated, then averaged. This mean sum of localizations per pixel is defined as the Mean Pixel Sum (see methods) and was used as a measure of co-clustering of PH domain clusters with the M1 clusters. A similar analysis was performed on the pixel sum of M1 localizations co-clustering with PH domain clusters. (C) Mean Pixel Sum of PH domain co-clustering with M1 and (D) Mean Pixel Sum of M1 co-clustering with PH domain were plotted as functions of CPC treatment.
Figure 3
Figure 3
CPC modulates PIP2 clustering in fixed NIH3T3 cells expressing M1. NIH3T3 cells expressing PH-Dendra2 and M1-PAmKate were exposed to control media (0 µM CPC+ Tyrodes-BSA vehicle), 5 µM CPC, or 10 µM CPC and were incubated at 37 °C for 1 h. Cells were fixed using 4% PFA after the incubation, and then imaged by two-color FPALM with TIRF illumination. Cluster properties of the PH-Dendra2 clusters—(A) mean area, (B) mean perimeter, (C) mean density, and (D) mean number of localizations per cluster—were quantified using SLCA and plotted as a function of CPC treatment. Values presented are mean ± SEM for a total of 33 cells for control, 31 cells for 5 µM and 32 cells for the 10 µM CPC treatment, pooled from three independent experiments. Statistically significant results are represented by * p < 0.05 and ** p < 0.01 determined by ordinary one-way ANOVA.
Figure 4
Figure 4
CPC modulates M1 clustering in fixed NIH3T3 cells. NIH3T3 cells expressing PH-Dendra2 and M1-PAmKate were exposed to control media (0µM CPC+ Tyrode’s-BSA vehicle), 5 µM CPC or 10 µM CPC, and were incubated at 37 °C for an hour and fixed at room temperature using 4% PFA. PMs of fixed cells expressing PH-Dendra2 and M1-PAmKate were imaged using FPALM in TIRF illumination. Cluster analysis was performed using SLCA. Cluster properties—(A) mean area of a M1 cluster, (B) mean perimeter of a M1 cluster, (C) mean density of a M1 cluster, and (D) mean number of M1 molecules forming a M1 cluster—were quantified and plotted as a function of CPC treatment. Values presented are mean ± SEM for a total of 33 cells for control, 31 cells for 5 µM, and 32 cells for the 10 µM CPC-treated cells, pooled from three independent experiments. Statistically significant results are represented by **** p < 0.0001, *** p < 0.001 and ** p < 0.01 determined by ordinary one-way ANOVA.
Figure 5
Figure 5
CPC reduces the co-clustering of PIP2 and M1. NIH3T3 cells expressing PH-Dendra2 and M1-PAmKate were exposed to control media (0 µM CPC+ Tyrode’s-BSA vehicle), 5 µM CPC, and 10 µM CPC, and were incubated at 37 °C for an hour. Cells were chemically fixed using 4% PFA at room temperature. Two-color FPALM was carried out with TIRF illumination to image the PMs (lower surface) of the cells. After the separation of their color according to the α value, localizations were binned in pixels of dimensions 80 nm × 80 nm. Pixels containing clusters (at least five localizations of one of the two species) were identified. The mean sum of localizations in these pixels was defined as the Mean Pixel Sum and was used as a measure of co-clustering PH domain localizations with M1 clusters. A similar analysis was performed on the pixel sum of M1 localizations co-clustering with PH domain clusters. (A) Mean Pixel Sum of PH domain co-clustering with M1 and (B) Mean Pixel Sum of M1 co-clustering with PH domain were plotted as functions of CPC treatment. Values presented are mean ± SEM for a total of 33 cells for control, 31 cells for 5 µM, and 32 cells for the 10 µM CPC-treated cells, pooled from three independent experiments. Statistically significant results compared to control are represented by * (p < 0.05) or ** (p < 0.01) determined by ordinary one-way ANOVA with Dunnett’s multiple comparison test.
Figure 6
Figure 6
M1 enhances PIP2 clustering. Cells expressing Dendra2-PH with and without M1-PAmKate were fixed using 4% PFA and imaged by two-color FPALM with TIRF illumination. Cluster properties—(A) mean area of a PH domain cluster, (B) mean perimeter of a PH domain cluster, (C) mean density of a PH domain cluster, and (D) mean number of molecules forming a PH domain cluster—were quantified using SLCA and compared ±M1. Values presented are mean ± SEM for a total of 29 cells expressing PH domain only (without M1) and 36 cells expressing PH domain and M1, pooled from three independent experiments. Statistically significant results are represented by * when p < 0.05, as determined by an ordinary Mann–Whitney test.
Figure 7
Figure 7
Colocalization of HA and M1 is CPC-dependent. NIH3T3 cells transfected with influenza A HA-Dendra2 and M1-PAmKate were treated with the control (0 µM CPC+ Tyrode’s-BSA vehicle), 5 µM CPC, or 10 µM CPC and incubated at 37 °C for an hour, then chemically fixed using PFA (4%) at room temperature. The lower PM of the cells was imaged with FPALM using TIRF illumination. HA-Dendra2 is rendered in green and M1-PAmKate in magenta. Yellow triangles point to the regions of colocalizations (white). Cells treated with the (A) control show a higher degree of colocalization compared to (B) 5 µM CPC and (C) 10 µM CPC-treated cells.
Figure 8
Figure 8
CPC reduces the co-clustering of HA and M1 in NIH3T3 cells. NIH3T3 cells transfected with influenza A HA-Dendra2 and M1-PAmKate were treated with the control (0 µM CPC+ Tyrode’s-BSA vehicle), 5 µM CPC, and 10 µM CPC and incubated at 37 °C for an hour and fixed with PFA (4%). Localizations from the two-color FPALM imaging of the PM of the fixed cells expressing HA-Dendra2 and M1-PAmKate were assigned to either channel according to their α value. Assigned localizations were binned in pixels of dimensions 80 nm × 80 nm and the Mean Pixel Sum was calculated (see methods) as a measure of the co-clustering of HA and M1. (A) Mean Pixel Sum of HA clusters containing M1 and (B) Mean Pixel Sum of M1 clusters containing HA vs. CPC treatment. (C,D) Manders’ Colocalization Coefficients (C) (MCCs) of HA-Dendra2 with PAmKate-M1 and (D) M1-PAmKate with Dendra2-HA reduced significantly with CPC treatment. Values presented are mean ± SEM for a total of 33 cells for control, 28 cells for 5 µM, and 30 cells for the 10 µM CPC-treated cells from three independent experiments. Statistically significant results are represented by * (p < 0.05), ** (p < 0.01), and **** (p < 0.0001) determined by ordinary one-way ANOVA.
Figure 9
Figure 9
CPC modulates M1 clustering in NIH3T3 cells co-expressing HA and M1. NIH3T3 cells transfected with influenza A HA-Dendra2 and M1-PAmKate were treated with the control (0 µM CPC+ Tyrode’s-BSA vehicle), 5 µM CPC, or 10 µM CPC and incubated at 37 °C for an hour and chemically fixed with PFA (4%) at room temperature. Two-color FPALM imaging of the PM of the fixed NIH3T3 cells expressing HA-Dendra2 and M1-PAmKate was carried out under TIRF illumination. Localizations were assigned to one of the two-color channels according to their α values, then further processed through SLCA for cluster identification. Cluster properties—(A) mean area of an HA cluster, (B) mean perimeter of an HA cluster, (C) mean density of an HA cluster, and (D) mean number of molecules forming a cluster—were quantified and plotted as a function of CPC treatment. Values presented are mean ± SEM for a total of 34 cells for control, 29 cells for 5 µM, and 32 cells for the 10 µM CPC-treated cells, combined from three independent experiments. Statistically significant results are represented by **** (p < 0.0001) determined by ordinary one-way ANOVA.
Figure 10
Figure 10
HA does not modulate M1 association with the plasma membrane. The mean numbers of M1 localizations in imaged regions of fixed NIH3T3 cells expressing PAmKate-M1 with or without HA imaged TIRF excitation were calculated and compared. Values presented are mean ± SD for a total of 34 cells without HA, and 33 cells with HA, from three independent experiments. No statistical significance was observed with the one-tailed Mann–Whitney test.
Figure 11
Figure 11
HA enhances M1 clustering in NIH3T3 cells. Cluster properties—(A) mean area of an M1 cluster (B), mean perimeter of an M1 cluster, (C) mean density of an M1 cluster, and (D) mean number of M1 molecules forming a cluster—were compared with and without HA. Values presented are mean ± SEM for a total of 33 cells without HA and 33 cells with HA from three independent experiments. Statistically significant results are represented by * (p < 0.05) determined by the one-tailed Mann–Whitney test.

Similar articles

Cited by

References

    1. Lamb R.A., Choppin P.W. The Gene Structure and Replication of Influenza Virus. Annu. Rev. Biochem. 1983;52:467–506. doi: 10.1146/annurev.bi.52.070183.002343. - DOI - PubMed
    1. Nayak D.P., Ka-Wai Hui E., Barman S. Assembly and Budding of Influenza Virus. Virus Res. 2004;106:147–165. doi: 10.1016/j.virusres.2004.08.012. - DOI - PMC - PubMed
    1. Chua S.C.J.H., Cui J., Engelberg D., Lim L.H.K. A Review and Meta-Analysis of Influenza Interactome Studies. Front. Microbiol. 2022;13:869406. doi: 10.3389/fmicb.2022.869406. - DOI - PMC - PubMed
    1. Calder L.J., Wasilewski S., Berriman J.A., Rosenthal P.B. Structural Organization of a Filamentous Influenza A Virus. Proc. Natl. Acad. Sci. USA. 2010;107:10685–10690. doi: 10.1073/pnas.1002123107. - DOI - PMC - PubMed
    1. Gudheti M.V., Curthoys N.M., Gould T.J., Kim D., Gunewardene M.S., Gabor K.A., Gosse J.A., Kim C.H., Zimmerberg J., Hess S.T. Actin Mediates the Nanoscale Membrane Organization of the Clustered Membrane Protein Influenza Hemagglutinin. Biophys. J. 2013;104:2182–2192. doi: 10.1016/j.bpj.2013.03.054. - DOI - PMC - PubMed

Publication types

MeSH terms

Substances