. 2022 Nov 25;378(6622):eabm7466.
doi: 10.1126/science.abm7466. Epub 2022 Nov 25.

Cortical wiring by synapse type-specific control of local protein synthesis

Affiliations

Cortical wiring by synapse type-specific control of local protein synthesis

Clémence Bernard et al. Science. .

Abstract

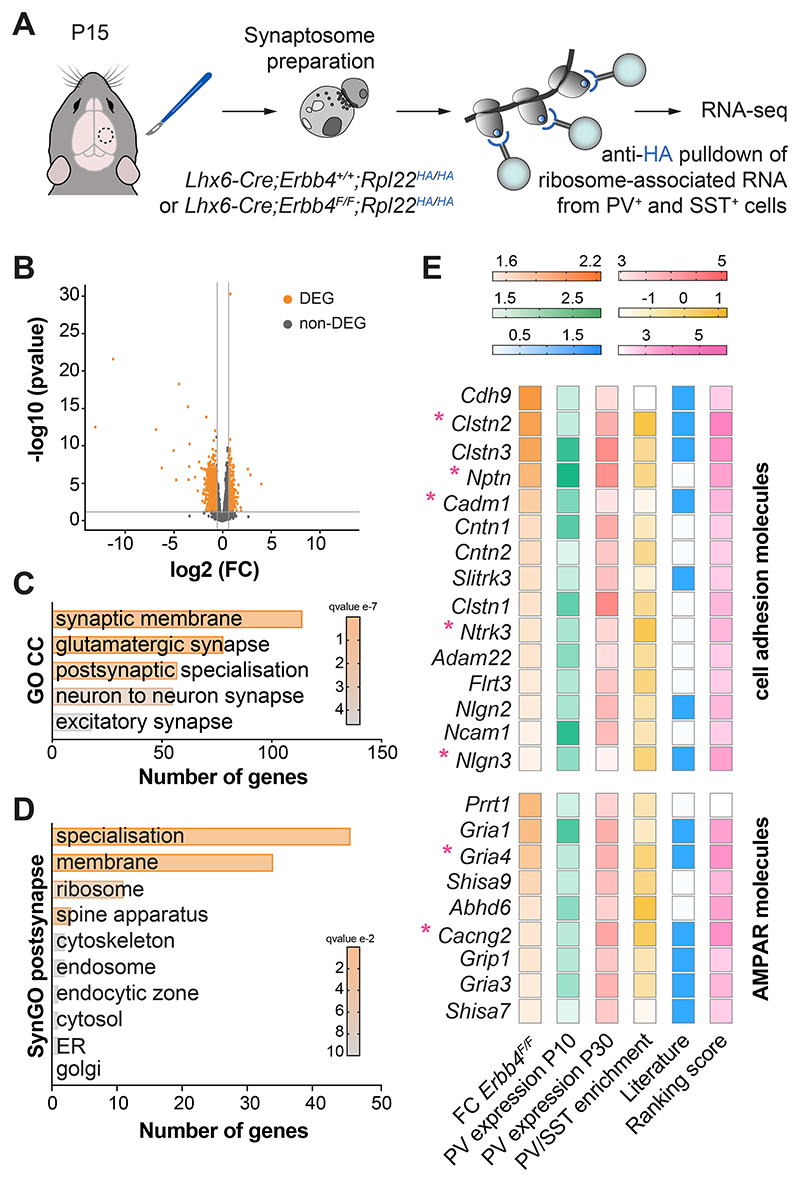
Neurons use local protein synthesis to support their morphological complexity, which requires independent control across multiple subcellular compartments up to the level of individual synapses. We identify a signaling pathway that regulates the local synthesis of proteins required to form excitatory synapses on parvalbumin-expressing (PV+) interneurons in the mouse cerebral cortex. This process involves regulation of the TSC subunit 2 (Tsc2) by the Erb-B2 receptor tyrosine kinase 4 (ErbB4), which enables local control of messenger RNA {mRNA} translation in a cell type-specific and synapse type-specific manner. Ribosome-associated mRNA profiling reveals a molecular program of synaptic proteins downstream of ErbB4 signaling required to form excitatory inputs on PV+ interneurons. Thus, specific connections use local protein synthesis to control synapse formation in the nervous system.


Conflict of interest statement

Competing interests: The authors declare no competing interests.

Figures

Fig. 1
Fig. 1. Differential contribution of Tsc2 to synapse development.
(A) Schematic of synaptic markers analyzed (left). Confocal images (top) and binary images (bottom) illustrating presynaptic VGluT1+ puncta (magenta) and postsynaptic PSD95+ clusters (cyan) in PV+ (yellow) tdTomato+ (grey) interneurons from P18-21 control, heterozygous and homozygous conditional Tsc2 mutants. (B) Quantification of the density of VGluT1+PSD95+ synapses contacting PV+ interneurons (control, n =111 cells from 8 mice; heterozygous, n = 70 cells from 4 mice; homozygous, n = 46 cells from 3 mice). (C) Schematic of synaptic markers analyzed (left). Confocal images (top) and binary images (bottom) illustrating presynaptic VGluT1+ puncta (magenta) and postsynaptic PSD95+ clusters (cyan) in SST+ (yellow) tdTomato+ (grey) interneurons from P18-21 control, heterozygous and homozygous conditional Tsc2 mutants. (D) Quantification of the density of VGluT1+PSD95+ synapses contacting SST+ interneurons (control, n = 67 cells from 4 mice; heterozygous, n = 41 cells from 3 mice; homozygous, n = 60 cells from 5 mice). (E) Schematic of experimental design (top) and post-recording labelling of neurobiotin (NB, grey) -filled tdTomato+ (yellow) cells with PV (magenta) and SST (cyan) (bottom). (F) Example traces of sEPSCs recorded from PV+ interneurons from P18-21 control, heterozygous and homozygous conditional Tsc2 mutants. (G) Quantification of the frequency (left) and amplitude (right) of sEPSCs from PV+ interneurons (control n =14 cells from 5 mice, Lhx6-Cre;Tsc2F/+ n=23 cells from 8 mice, Lhx6-Cre;Tsc2F/F n =14 cells from 6 mice). (H) Example traces of sEPSCs recorded from SST+ interneurons from P18-21 control, heterozygous and homozygous conditional Tsc2 mutants. (I) Quantification of the frequency (left) and amplitude (right) of sEPSCs from SST+ interneurons (control, n = 9 cells from 5 mice; heterozygous, n = 10 cells from 9 mice; homozygous, n = 26 cells from 7 mice). One-way ANOVA followed by Tukey’s multiple comparisons test or Kruskal-Wallis followed by Dunn’s multiple comparisons test: *P < 0.05, **P < 0.01, ***P < 0.001. The dashed lines in the images shown in A and C outline the surface of the cells. Data are mean ± s.e.m. Scale bar, 10 μm and 1 μm (high magnification) (A, C), and 10 μm (E).
Fig. 2
Fig. 2. ErbB4 regulates mTOR at excitatory synapses contacting PV+ interneurons.
(A) Hypothetical signaling pathway. P indicates phosphorylation; green arrow activation; red arrow inhibition; dotted arrows indicate indirect regulation. (B) Schematic of experimental design. (C) Phosphorylation and protein expression of Tsc2, S6rp, 4EBP1 and actin assessed by Western blot of cortical synaptic fractions from P30 homozygous conditional Erbb4 mice and their control littermates. (D) Quantification of phosphorylation of Tsc2, S6rp and 4EBP1 normalized to the total expression of the corresponding protein (top). Quantification of expression levels of Tsc2, S6rp and 4EBP1 normalized to actin (bottom) (Tsc2: control, n = 8 mice, homozygous, n = 6 mice; S6rp: control, n = 5 mice, homozygous, n = 4 mice; 4EBP1: control, n = 7 mice, homozygous, n = 5 mice). (E) Phosphorylation and protein expression of Tsc2, S6rp, 4EBP1 and actin assessed by Western blot of cortical cytosolic fractions from P30 homozygous conditional Erbb4 mice and their control littermates. (F) Quantification of phosphorylation of Tsc2, S6rp and 4EBP1 normalized to the total expression of the corresponding protein (top). Quantification of expression levels of Tsc2, S6rp and 4EBP1 normalized to actin (bottom) (Tsc2 and S6rp: control, n = 7 mice, homozygous, n = 6 mice; 4EBP1: control, n = 5 mice, homozygous, n = 4 mice). (G) Confocal images illustrating phosphorylation of S6rp (P-S6rp, grey) in Nrg3+ (magenta) PSD95+ (cyan) synaptosomes (top) and in VGluT1+ (magenta) PSD95+ (cyan) synaptosomes (bottom) from P21 homozygous conditional Erbb4 mice and their control littermates. (H) Quantification of P-S6rp staining intensity in Nrg3+PSD95+ (top) and VGluT1+PSD95+ synaptosomes (bottom). (I) Relative frequency distribution of P-S6rp staining intensity in Nrg3+PSD95+ synaptosomes (top) and in VGluT1+PSD95+ synaptosomes (bottom) (Nrg3+PSD95+: control, n = 22,063 synaptosomes from 6 mice, homozygous, n = 17,523 synaptosomes from 5 mice; VGluT1+PSD95+: control, n = 39,395 synaptosomes from 5 mice, homozygous, n = 48,057 synaptosomes from 6 mice). Two-tailed Student’s unpaired t-tests: *P < 0.05. Data are mean ± s.e.m. Scale bar, 1 μm.
Fig. 3
Fig. 3. Synaptic ribosome-associated mRNAs altered in Erbb4 mutants.
(A) Schematic of experimental design. (B) Volcano plot displaying significantly differentially expressed ribosome-associated RNAs (DEG, orange) in P15 cortical synaptosomes from homozygous conditional Erbb4 mice compared to controls. Each dot represents one gene. FC: fold-change (FC > 1.5, P < 0.05). (C) Selected Gene Ontology (GO) Cellular Components (CC) terms significantly enriched in the dataset of downregulated genes in homozygous conditional Erbb4 mutants compared to controls. (D) Synaptic Gene Ontology (SynGO) postsynaptic cellular component categories significantly enriched in the dataset of downregulated genes in homozygous conditional Erbb4 mutants compared to controls. (E) Heatmaps showing the selection criteria for 15 “cell adhesion molecules” genes and 9 “AMPA receptors” genes. The asterisks indicate genes selected for validation.
Fig. 4
Fig. 4. ErbB4 regulates the local translation of synaptic proteins.
(A) Schematic of experimental design. (B) Protein expression of SynCAM1, Nptn, Nlgn3, TrkC, Clstn2, GluA4, Stargazin and actin assessed by Western blot of cortical synaptic fractions treated with neuregulin (Nrg) from P21 C57B6 mice. (C) Quantification of expression levels of SynCAM1, Nptn, Nlgn3. TrkC, Clstn2, GluA4 and Stargazin normalized to actin. One-tailed Student’s unpaired t-tests: *P < 0.05, **P < 0.01 (SynCAM1 and TrkC: +BSA, n =11 synaptosomes: +Nrg, n = 11 synaptosomes; Nptn and GluA4: +BSA, n = 9 synaptosomes, +Nrg, n = 10 synaptosomes; Nlgn3 and Clstn2: +BSA, n = 4 synaptosomes, +Nrg, n = 4 synaptosomes; Stargazin: +BSA, n = 7 synaptosomes, +Nrg, n = 8 synaptosomes). Data are mean ± s.e.m.
Fig. 5
Fig. 5. ErbB4 targets control excitatory synapse formation on PV+ interneurons.
(A) Schematic of experimental design. (B) Confocal images (top) and binary images (bottom) illustrating presynaptic VGluT1+ puncta (magenta) and postsynaptic PSD95+ clusters (cyan) in PV+ interneurons (grey) from P21 Lhx6-Cre mice injected with viruses expressing shRNAs targeting the genes of interest or with a control virus (shLacZ). (C) Quantification of the density of VGluT1+PSD95+ synapses contacting PV+ interneurons in knockdown and control mice. Two-tailed Student’s unpaired t-tests: *P < 0.05, **P < 0.01, ***P < 0.001; shCadm1 (n = 122 cells from 6 mice) and control (n = 113 cells from 6 mice); shNptn (n = 131 cells from 6 mice) and control (n = 119 cells from 6 mice); shNlgn3 (n = 86 cells from 4 mice) and control (n = 68 cells from 4 mice); shNtrk3 (n = 126 cells from 6 mice) and control (n = 105 cells from 5 mice); shClstn2 (n = 120 cells from 6 mice) and control (n = 112 cells from 6 mice); shGria4 (n = 121 cells from 8 mice) and control (n = 93 cells from 5 mice); shCacng2 (n = 115 cells from 6 mice) and control (n = 109 cells from 6 mice). (D) Proportion of synaptic loss in PV+ interneurons upon knockdown of ErbB4 downstream targets. Data are mean ± s.e.m. Scale bar, 1 μm.

References

    1. Klausberger T, Somogyi P. Neuronal diversity and temporal dynamics: the unity of hippocampal circuit operations. Science. 2008;321:53–57. doi: 10.1126/science.1149381. - DOI - PMC - PubMed
    1. Harris KD, Shepherd GM. The neocortical circuit: themes and variations. Nat Neurosci. 2015;18:170–181. doi: 10.1038/nn.3917. - DOI - PMC - PubMed
    1. Douglas RJ, Martin KA. Neuronal circuits of the neocortex. Annu Rev Neurosci. 2004;27:419–451. - PubMed
    1. Ango F, et al. Ankyrin-based subcellular gradient of neurofascin, an immunoglobulin family protein, directs GABAergic innervation at purkinje axon initial segment. Cell. 2004;119:257–272. - PubMed
    1. Williams ME, et al. Cadherin-9 regulates synapse-specific differentiation in the developing hippocampus. Neuron. 2011;71:640–655. doi: 10.1016/j.neuron.2011.06.019. - DOI - PMC - PubMed

Publication types

MeSH terms