. 2022 Nov 25;378(6622):909-915.
doi: 10.1126/science.abm8668. Epub 2022 Nov 24.

Variation in human water turnover associated with environmental and lifestyle factors

Yosuke Yamada #  1   2 Xueying Zhang #  3   4 Mary E T Henderson #  5 Hiroyuki Sagayama  6 Herman Pontzer  7   8 Daiki Watanabe  1   2   9 Tsukasa Yoshida  1   2 Misaka Kimura  2 Philip N Ainslie  10 Lene F Andersen  11 Liam J Anderson  12   13 Lenore Arab  14 Issad Baddou  15 Kweku Bedu-Addo  16 Ellen E Blaak  17 Stephane Blanc  18   19 Alberto G Bonomi  20 Carlijn V C Bouten  21 Pascal Bovet  22 Maciej S Buchowski  23 Nancy F Butte  24 Stefan G Camps  21   25 Graeme L Close  12 Jamie A Cooper  26 Richard Cooper  27 Sai Krupa Das  28 Lara R Dugas  29   30 Simon Eaton  31 Ulf Ekelund  32   33 Sonja Entringer  34   35 Terrence Forrester  36 Barry W Fudge  37 Annelies H Goris  21 Michael Gurven  38 Lewis G Halsey  5 Catherine Hambly  4 Asmaa El Hamdouchi  15 Marije B Hoos  21 Sumei Hu  39 Noorjehan Joonas  40 Annemiek M Joosen  21 Peter Katzmarzyk  41 Kitty P Kempen  21 William E Kraus  42 Wantanee Kriengsinyos  43 Robert F Kushner  44 Estelle V Lambert  45 William R Leonard  46 Nader Lessan  47   48 Corby K Martin  41 Anine C Medin  11   49 Erwin P Meijer  21 James C Morehen  12   50 James P Morton  12 Marian L Neuhouser  51 Theresa A Nicklas  24 Robert M Ojiambo  52   53 Kirsi H Pietiläinen  54 Yannis P Pitsiladis  55 Jacob Plange-Rhule  16 Guy Plasqui  56 Ross L Prentice  51 Roberto A Rabinovich  57 Susan B Racette  58 David A Raichlen  59 Eric Ravussin  41 Leanne M Redman  41 John J Reilly  60 Rebecca M Reynolds  61 Susan B Roberts  28 Albertine J Schuit  62 Luis B Sardinha  63 Analiza M Silva  63 Anders M Sjödin  64 Eric Stice  65 Samuel S Urlacher  66   67 Giulio Valenti  20   21 Ludo M Van Etten  21 Edgar A Van Mil  68 Jonathan C K Wells  69 George Wilson  12 Brian M Wood  70   71 Jack A Yanovski  72 Alexia J Murphy-Alford  73 Cornelia U Loechl  73 Amy H Luke  74 Jennifer Rood  41 Klaas R Westerterp  75 William W Wong  24 Motohiko Miyachi  1   9 Dale A Schoeller  76 John R Speakman #  3   4   77   78 International Atomic Energy Agency (IAEA) Doubly Labeled Water (DLW) Database Consortium§
Affiliations

Variation in human water turnover associated with environmental and lifestyle factors

Yosuke Yamada et al. Science. .

Abstract

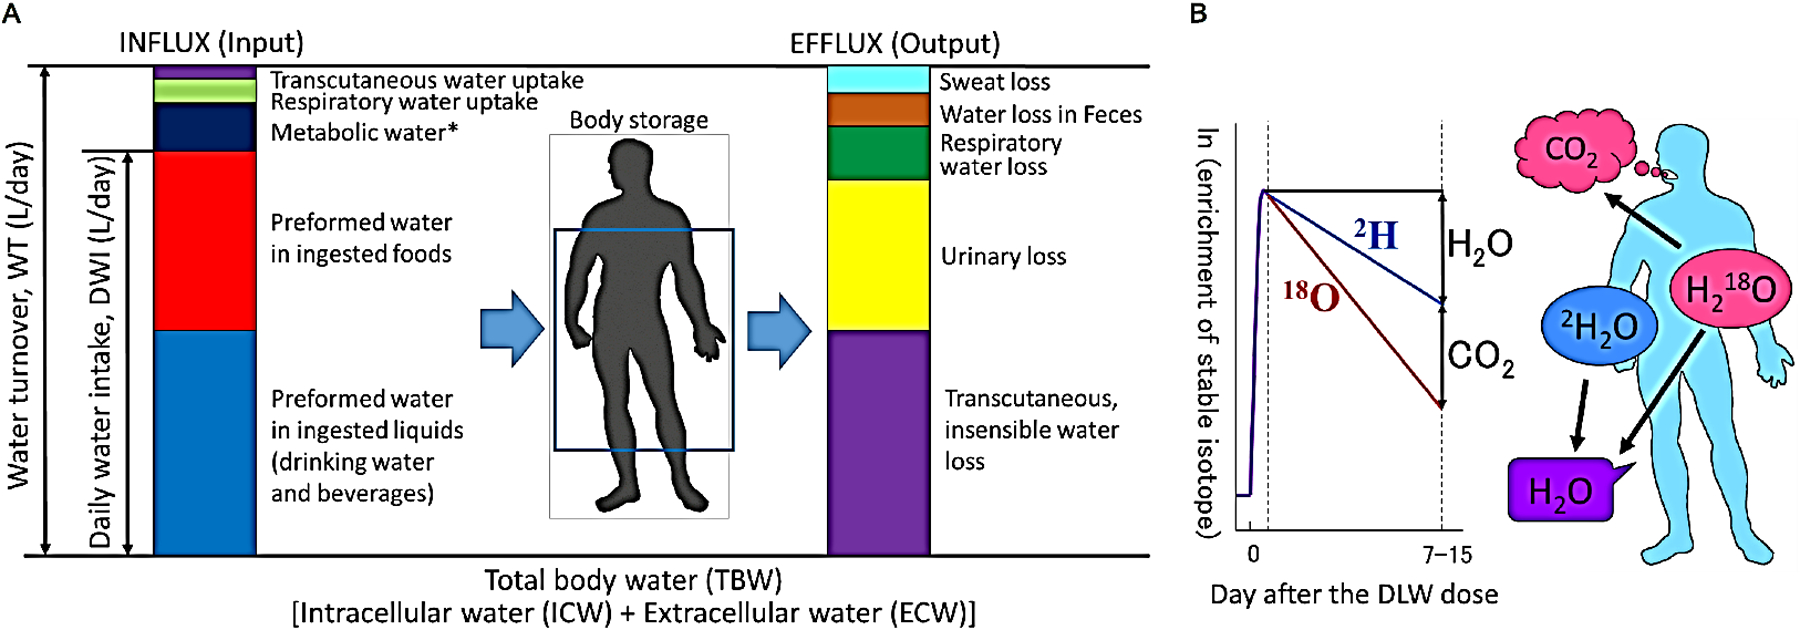
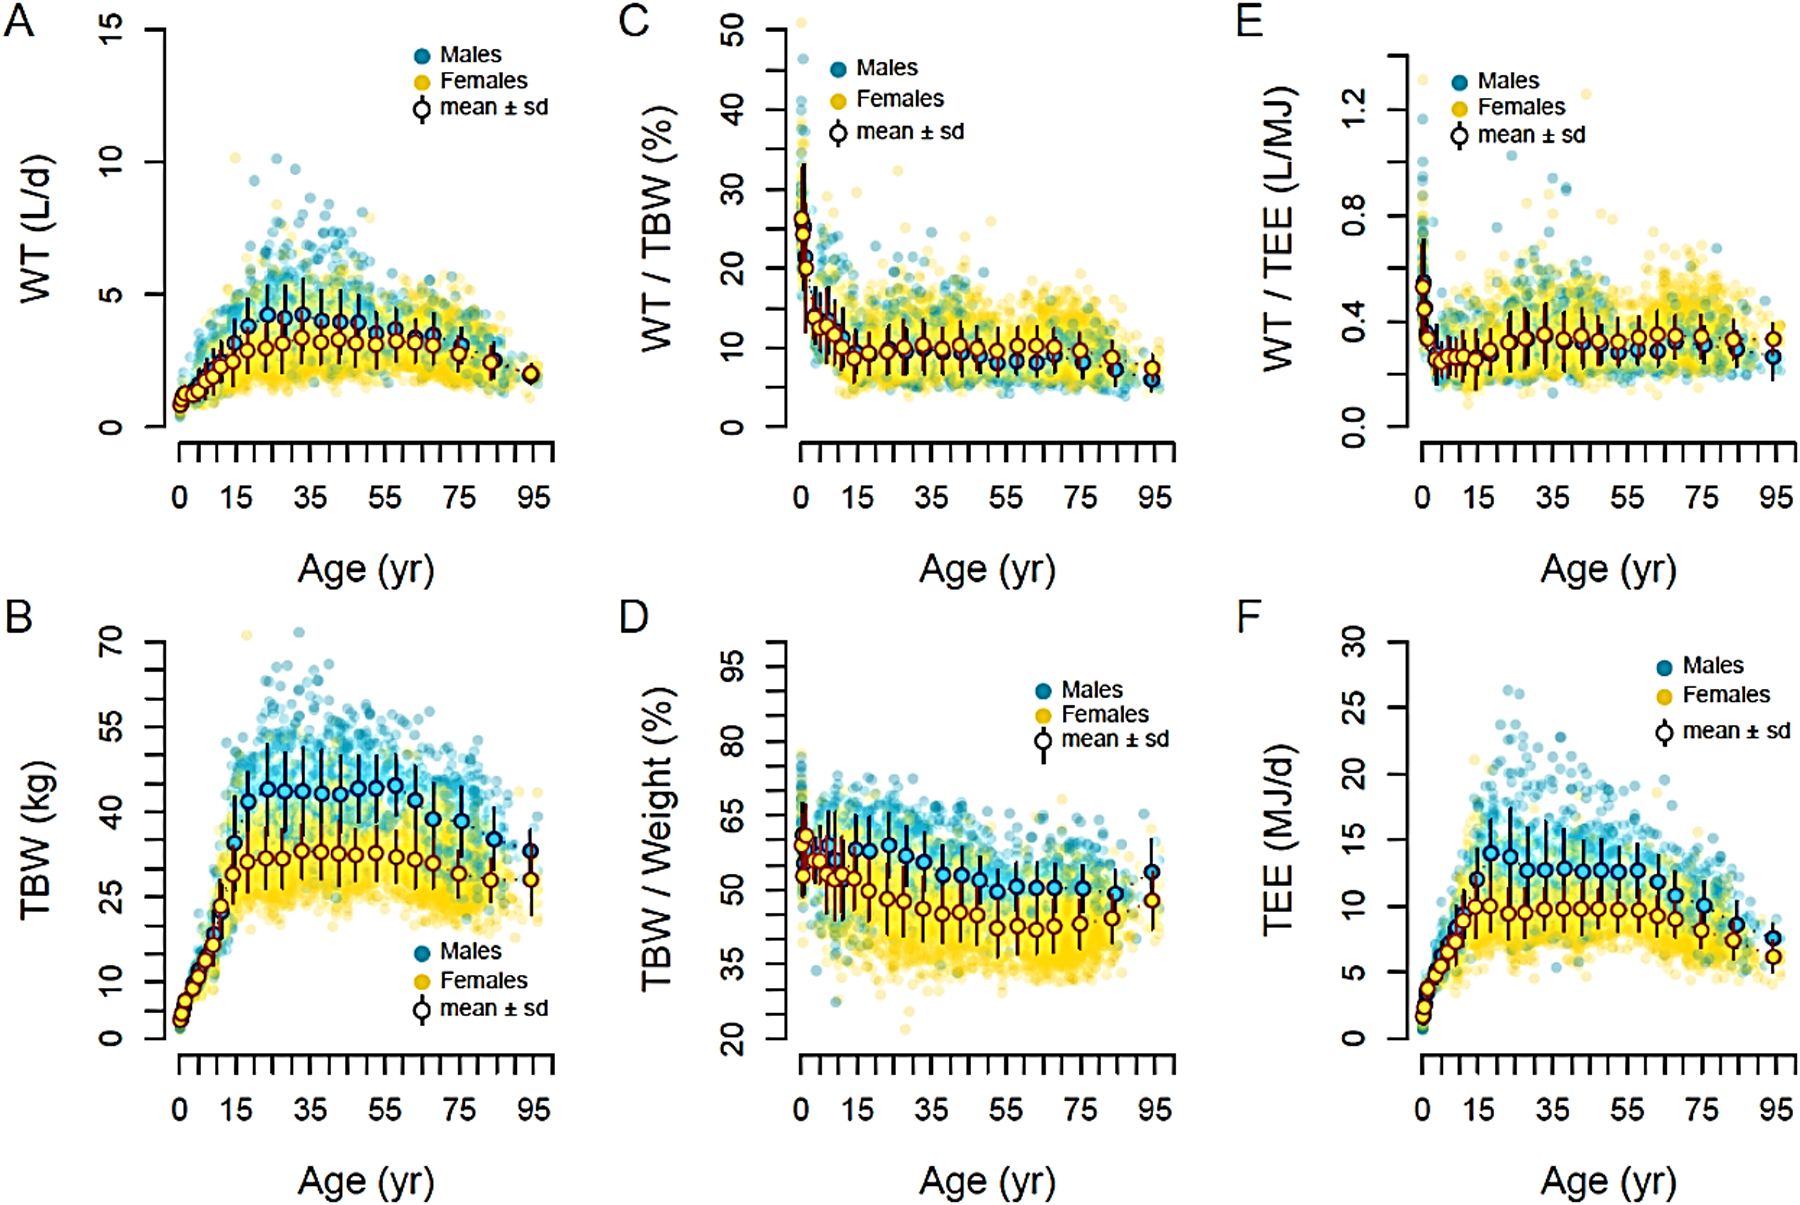
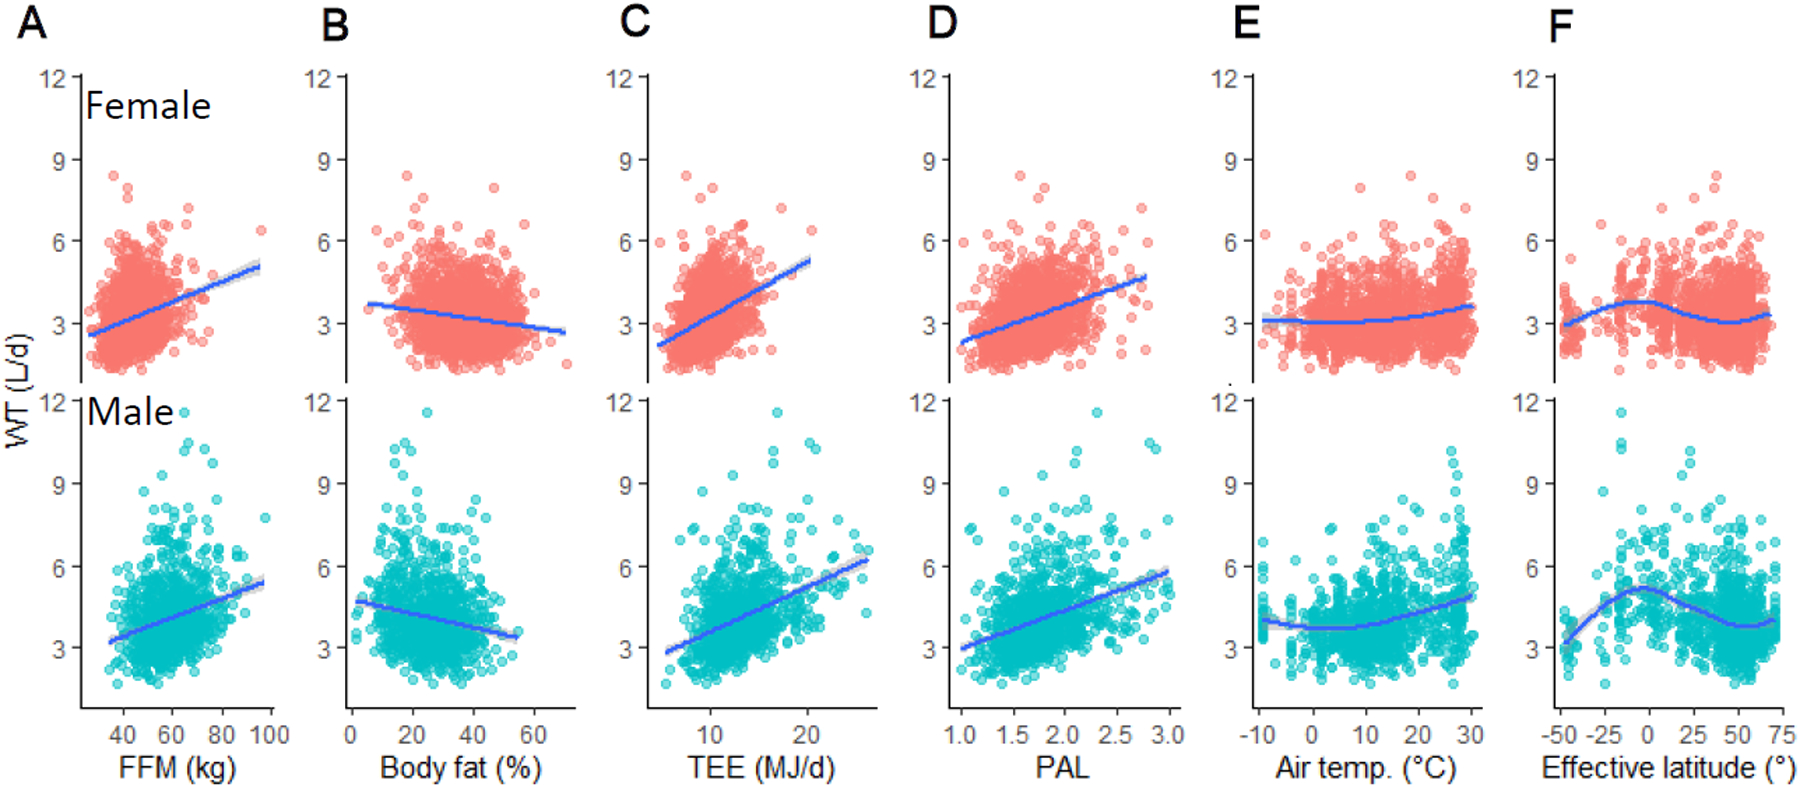
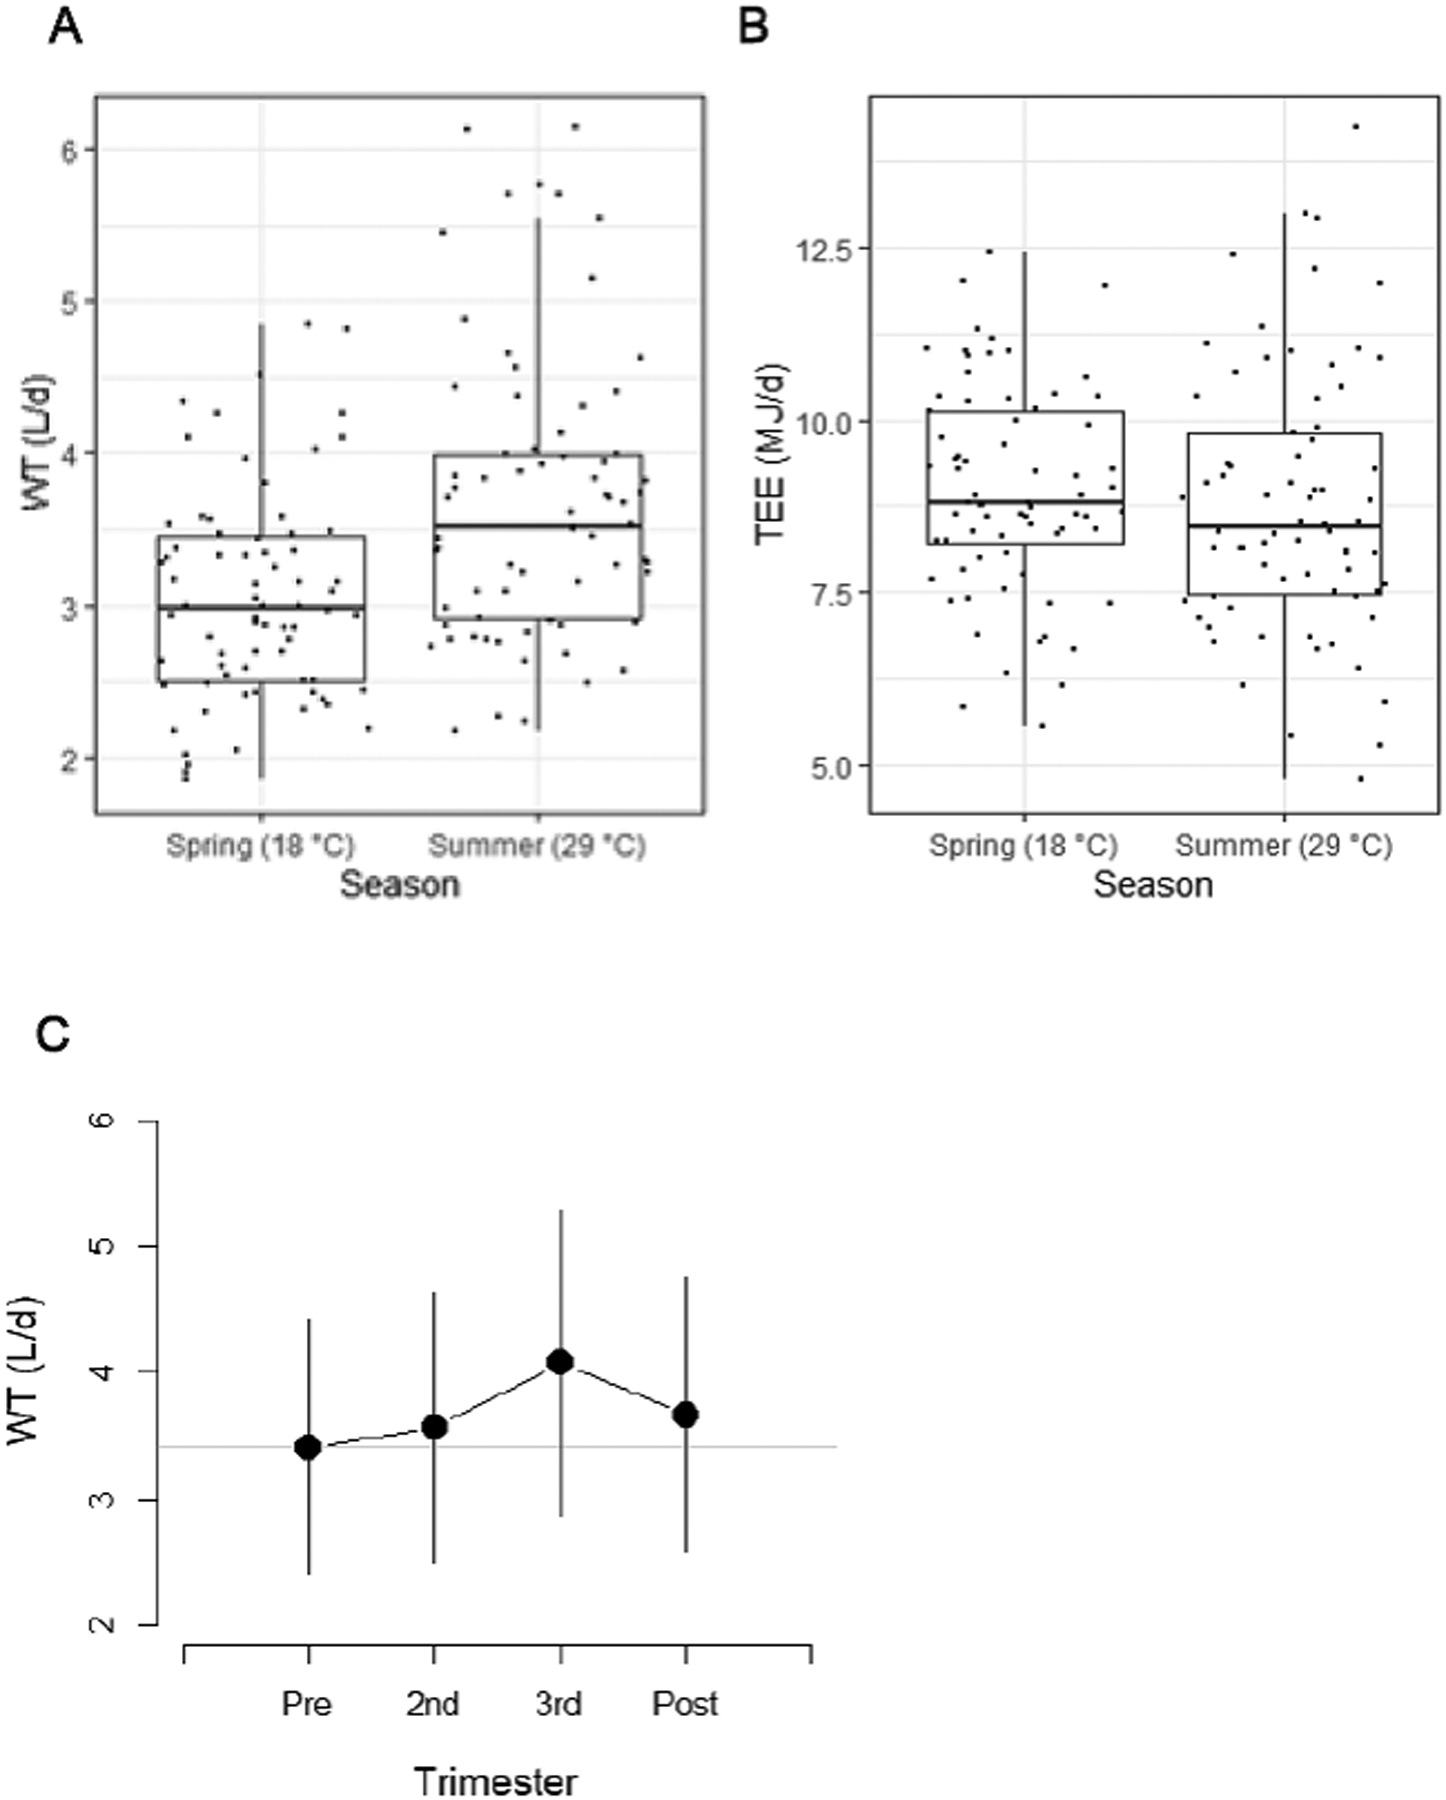
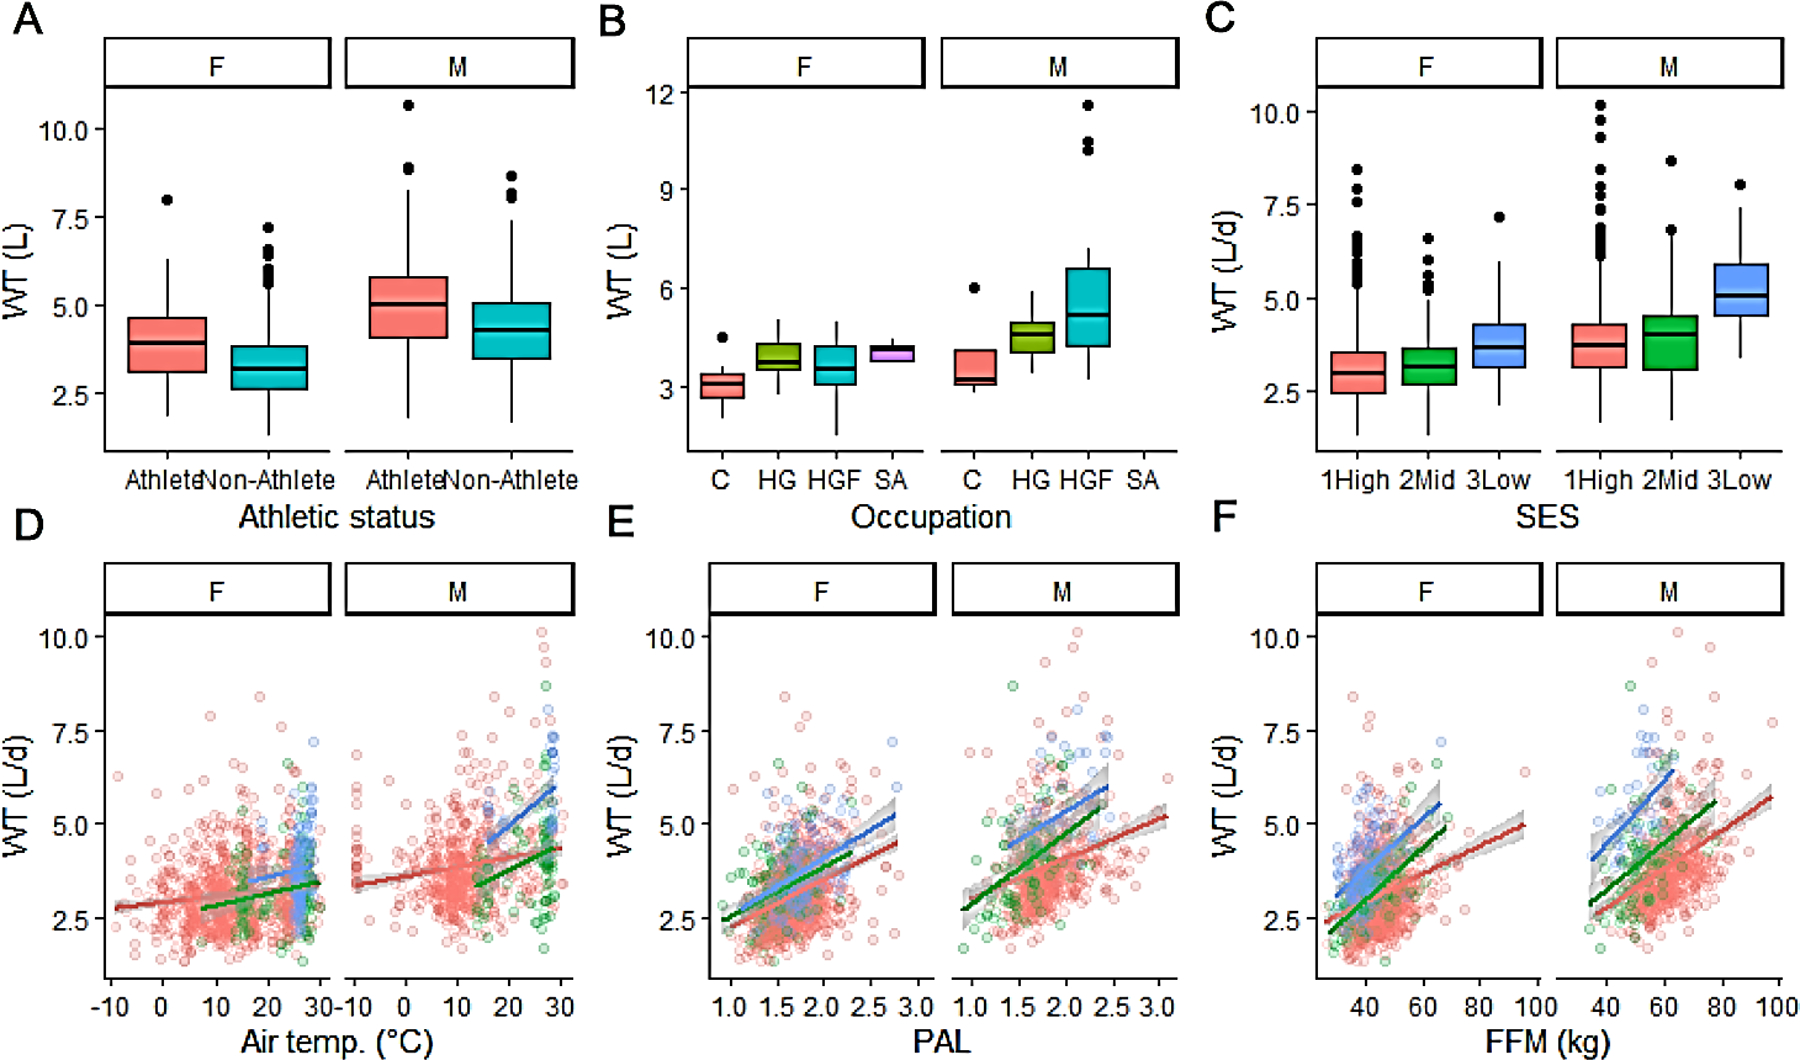
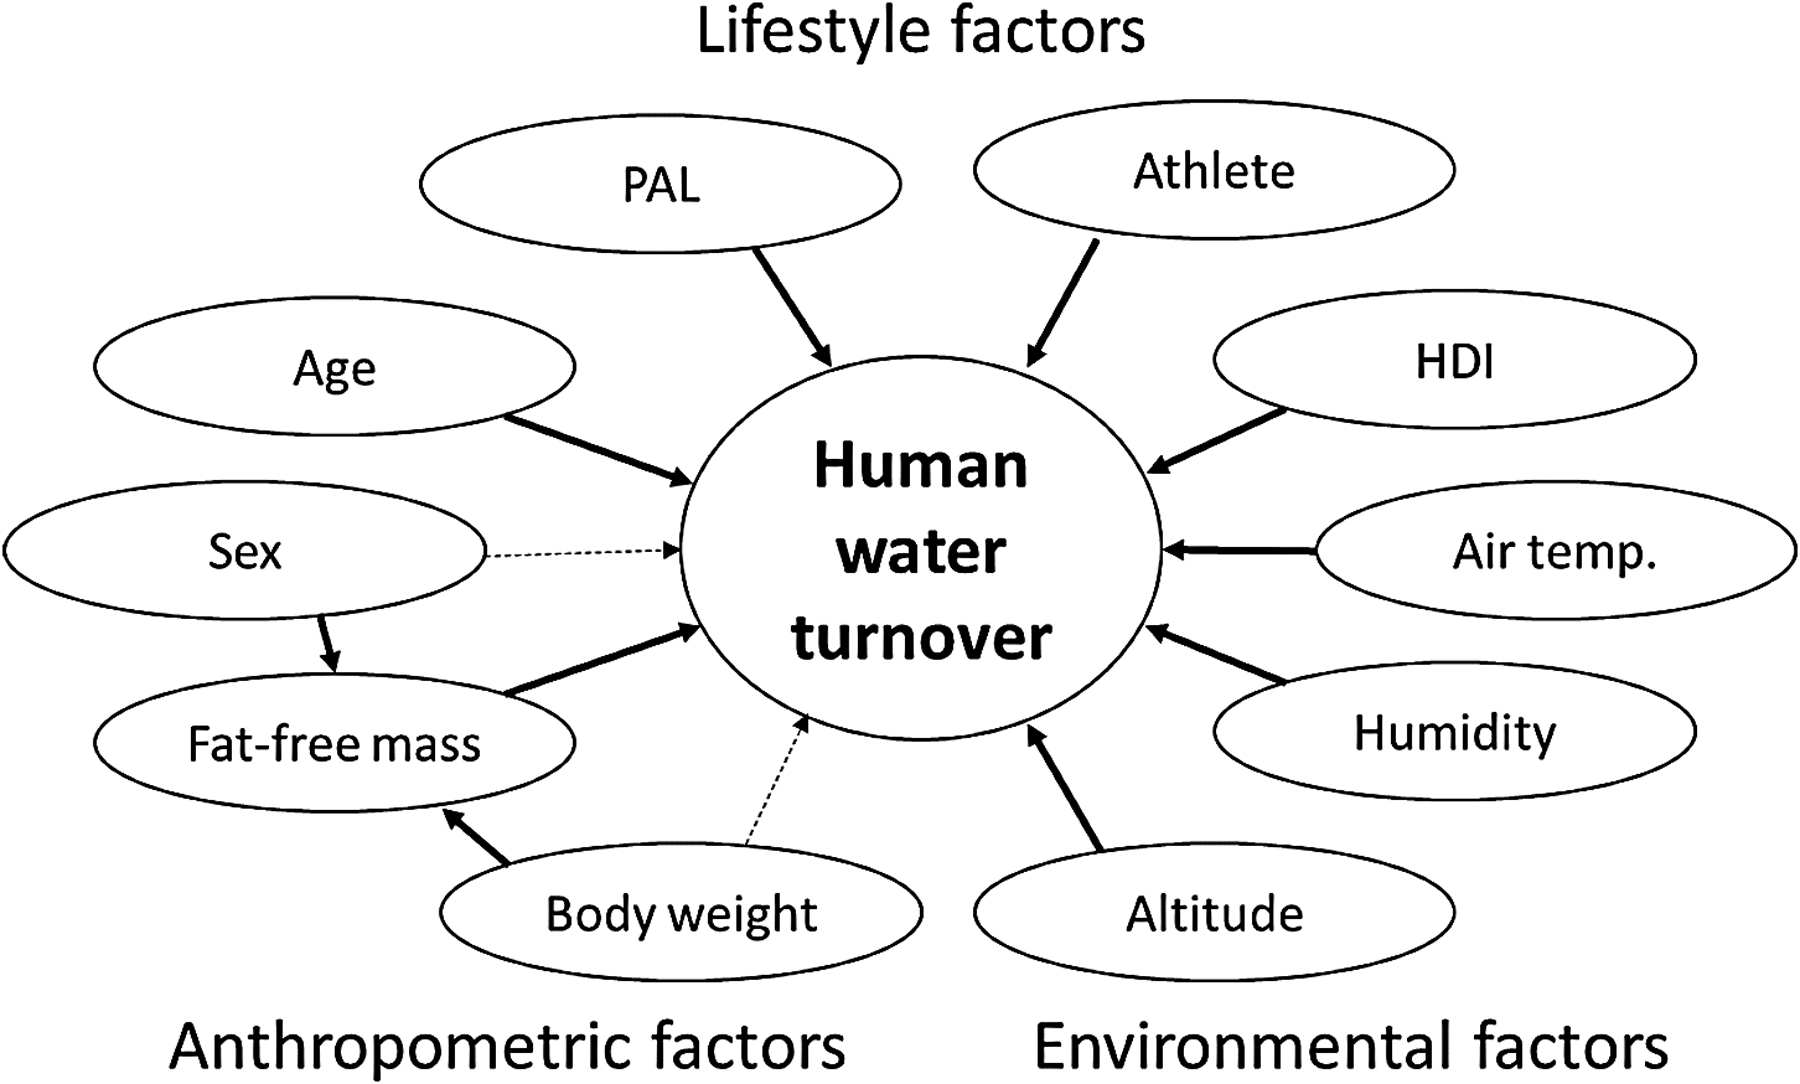
Water is essential for survival, but one in three individuals worldwide (2.2 billion people) lacks access to safe drinking water. Water intake requirements largely reflect water turnover (WT), the water used by the body each day. We investigated the determinants of human WT in 5604 people from the ages of 8 days to 96 years from 23 countries using isotope-tracking (2H) methods. Age, body size, and composition were significantly associated with WT, as were physical activity, athletic status, pregnancy, socioeconomic status, and environmental characteristics (latitude, altitude, air temperature, and humidity). People who lived in countries with a low human development index (HDI) had higher WT than people in high-HDI countries. On the basis of this extensive dataset, we provide equations to predict human WT in relation to anthropometric, economic, and environmental factors.


Conflict of interest statement

Conflict of interest: Y.Y. has a patent pending that is partly related to the publication. The other authors have no conflicts of interest to declare.

Figures

Fig. 1.
Fig. 1.
(A) Conceptual diagram showing sources of water influx and efflux on human body. * Metabolic water produced inside a living organism as an end product of the oxidation of energy-containing substances in their food. (B) Hydrogen isotope dilution and elimination provides an objective measure of total body water (TBW) and water turnover (WT). DLW; doubly labeled water.
Fig. 2.
Fig. 2.
Relationships between age and total body water (TBW) or water turnover (WT) in 3729 females (orange) and 1875 males (blue) aged 0 to 96 years with mean and SD. (A) displays WT (L/d), (B) TBW (kg), (C) WT per TBW (%), (D) TBW per body weight (%), (E) WT per total energy expenditure (TEE) (L/MJ), or (F) TEE (MJ/d). Water turnover increases with age until about 30 years and is higher in men (4.3 L/d) than women (3.4 L/d). Water turnover significantly decreases after 30 years in men and 55 years in women, reaching an average water turnover of 3.1 and 2.8 L/d in men and women aged over 70 years, respectively. The average water turnover rate as a percent of total body water is a maximum of ~25% in neonates, decreases with development, and is ~15% in 5-year-old children. At puberty, water turnover falls to ~10% and remains constant until age 40 years in men and 65 years in women, after which it decreases. The average water turnover per TEE is about 0.33 L/MJ (~1.4 ml/kcal) in adults. Note that the variation in water turnover is incredibly large – the low end for men and women is ~1–1.5 L/day while the upper end is around ~6 L/day – and the outliers lie in the 10L/d range. On average, water accounts for 60% of the body weight in infants, 50% in older adults, and only 42% in women at 60 years of age, reflecting a larger % body fat.
Fig. 3.
Fig. 3.
Relationships between water turnover (WT) against (A) fat-free mass (FFM), (B) percent body fat, (C) total energy expenditure (TEE), (D) physical activity level (PAL), (E) air temperature, and (F) effective latitude in 1657 females (upper panels; red) and 1013 males (lower panels; blue) aged 20 to 60 years. The blue line represents generalized additive models with integrated smoothness (GAM). Pearson correlation analysis shows positive correlations between water turnover and fat-free mass (r = 0.442, P < 0.001), TEE (r = 0.488, P < 0.001), PAL (r = 0.388, P < 0.001), and altitude (r = 0.100, P < 0.001). Water turnover was negatively correlated with percent body fat (−0.311, P < 0.001). Outdoor air temperature was only weakly correlated with water turnover in the whole sample (r = 0.160, P < 0.001). A significant curvilinear relationship between water turnover and the air temperature and a significant curvilinear relationship between water turnover and effective latitude was observed (see text for details). Average water turnover reached the highest values at around 0° and the lowest at around −50° or +50° of effective latitude. People who lived near the Arctic Circle had higher average water turnover than those who lived around −50° or +50° of effective latitude.
Fig. 4.
Fig. 4.
(A) Repeated measures of 72 people (31 females and 41 males) shows water turnover (WT) was significantly higher in the summer (3.7 ± 1.0 L/d) with an average temperature of 29°C than in the spring (3.0 ± 0.7 L/d) with 18°C (P < 0.001). (B) In contrast, total energy expenditure (TEE) was not significantly different between summer and spring (P = 0.233). (C) Repeated measures of 63 pregnant women show that total water turnover was significantly higher during late pregnancy and lactation (data from Butte et al. 2005). (Pre = Before pregnancy; Post = 27 weeks postpartum).
Fig. 5.
Fig. 5.
(A) Athletes had higher water turnover (WT) than non-athletes, even after adjusting for physiological and environmental variables (P < 0.001). (B) Hunter-gatherers (HG), mixed farmer and hunter-gatherer (HGF), and subsistence agriculturalists (SA) had higher water turnover than other people (C), even after adjusting for physiological and environmental variables (P < 0.001). Note that there are no males in the database who fell into the SA category. (C) People who lived in countries with a low Human Development Index (HDI) had higher WT than people who lived in countries with high or middle HDI, even after adjusting for physiological and environmental variables (P < 0.001). (D-F) Relationship between water turnover and outdoor air temperature, physical activity level (PAL), or fat-free mass. The countries were categorized as high (red), middle (green), and low (blue) HDI. (D) A significant interaction (P < 0.001) was observed between outdoor air temperature and HDI in water turnover. The association between outdoor air temperature and water turnover is weak in high HDI countries (r = 0.086, P < 0.001) but strong in men in low HDI countries (r = 0.604, P < 0.001). (E, F) A significant interaction (P < 0.001) was observed between HDI and PAL or FFM in water turnover. Correlation coefficients were significantly higher (P < 0.001) in low HDI countries (r = 0.484 to 0.670, P < 0.001) than in high HDI countries (r = 0.367 to 0,510, P < 0.001).
Fig. 6.
Fig. 6.
Determinants of human water turnover. Objective measures of water turnover from a large global dataset indicate that water turnover is strongly related to anthropometric, lifestyle, and environmental factors. PAL = Physical activity level (Total energy expenditure/Basal energy expenditure), HDI = Human development index.

Comment in

References

    1. Popkin BM, D’Anci KE, Rosenberg IH, Water, hydration, and health. Nutr Rev 68, 439–458 (2010). - PMC - PubMed
    1. Pontzer H et al., Evolution of water conservation in humans. Current biology : CB 31, 1804–1810.e1805 (2021). - PubMed
    1. Morimoto T, Itoh T, Thermoregulation and body fluid osmolality. J Basic Clin Physiol Pharmacol 9, 51–72 (1998). - PubMed
    1. Zimmerman CA et al., Thirst neurons anticipate the homeostatic consequences of eating and drinking. Nature 537, 680–684 (2016). - PMC - PubMed
    1. Rosinger A, Tanner S, Water from fruit or the river? Examining hydration strategies and gastrointestinal illness among Tsimane’ adults in the Bolivian Amazon. Public Health Nutr 18, 1098–1108 (2015). - PMC - PubMed

Publication types