. 2022 Nov 23;13(1):7194.
doi: 10.1038/s41467-022-34869-3.

Osteoblast/osteocyte-derived interleukin-11 regulates osteogenesis and systemic adipogenesis

Affiliations

Osteoblast/osteocyte-derived interleukin-11 regulates osteogenesis and systemic adipogenesis

Bingzi Dong et al. Nat Commun. .

Abstract

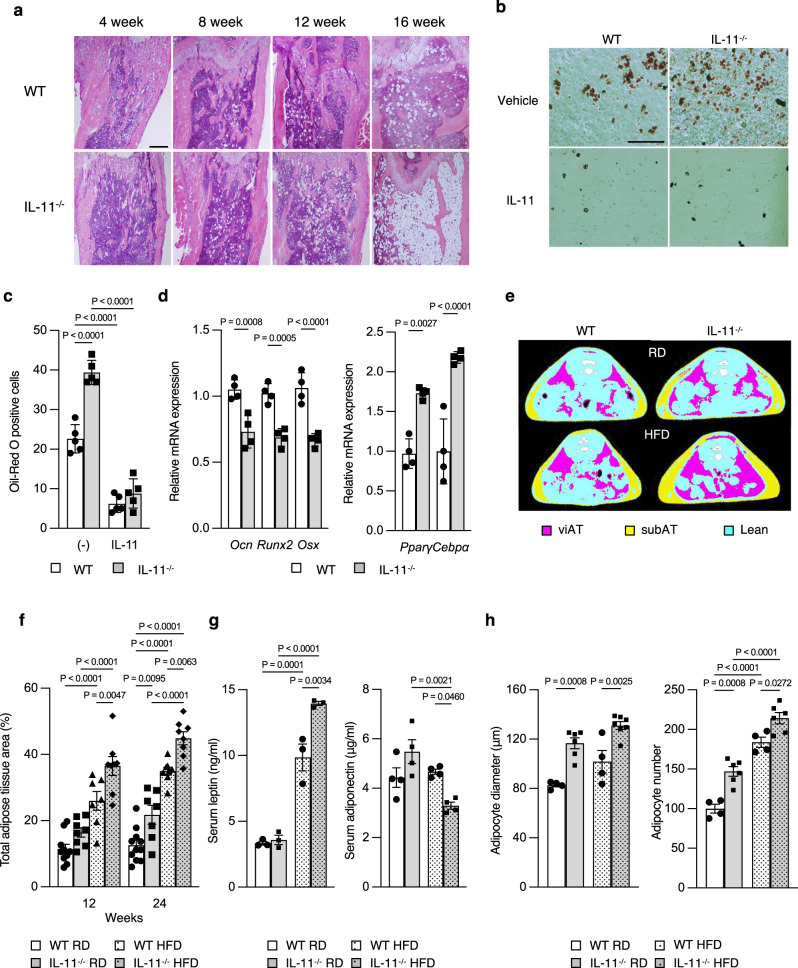
Exercise results in mechanical loading of the bone and stimulates energy expenditure in the adipose tissue. It is therefore likely that the bone secretes factors to communicate with adipose tissue in response to mechanical loading. Interleukin (IL)-11 is known to be expressed in the bone, it is upregulated by mechanical loading, enhances osteogenesis and suppresses adipogenesis. Here, we show that systemic IL-11 deletion (IL-11-/-) results in reduced bone mass, suppressed bone formation response to mechanical loading, enhanced expression of Wnt inhibitors, and suppressed Wnt signaling. At the same time, the enhancement of bone resorption by mechanical unloading was unaffected. Unexpectedly, IL-11-/- mice have increased systemic adiposity and glucose intolerance. Osteoblast/osteocyte-specific IL-11 deletion in osteocalcin-Cre;IL-11fl/fl mice have reduced serum IL-11 levels, blunted bone formation under mechanical loading, and increased systemic adiposity similar to IL-11-/- mice. Adipocyte-specific IL-11 deletion in adiponectin-Cre;IL-11fl/fl did not exhibit any abnormalities. We demonstrate that osteoblast/osteocyte-derived IL-11 controls both osteogenesis and systemic adiposity in response to mechanical loading, an important insight for our understanding of osteoporosis and metabolic syndromes.


Conflict of interest statement

The authors declare no competing interests.

Figures

Fig. 1
Fig. 1. Decreased bone mass with reduced bone formation without change in bone resorption by histomorphometric analysis of the vertebral bone in IL-11−/− mice.
a Micro-CT of femoral bones from 12-week-old WT and IL-11−/− mice. Scale bar indicates 1 mm. b, c Total, cortical and cancellous bone mineral density (BMD) of the vertebra from WT (open circle) (n = 9, 10, 10, 11, 13) and IL-11−/− mice (closed circle) (n = 14, 16, 16, 8, 7), and the femur from WT (n = 18, 9, 9, 18, 12) and IL-11−/− mice (n = 18, 15, 13, 16, 14) at 1, 2, 3, 4 and 6 months. Data are presented as means ± SD. P values are comparisons between WT and IL-11−/− mice using two-way ANOVA by Sidak’s multiple comparisons test. d Total and cortical BMD of calvaria from 12-week-old WT (n = 6, 6) and IL-11−/− mice (n = 7, 5). Data are presented as means ± SE. e Bone histomorphometric analysis of vertebral bones from 12-week-old WT and IL-11−/− mice. BV/TV, bone volume/tissue volume of WT (n = 6) and IL-11−/− mice (n = 5); Tb.Th, trabecular thickness of WT (n = 6) and IL-11−/− mice (n = 5); Tb.N, trabecular number of WT (n = 7) and IL-11−/− mice (n = 5); Tb.Sp, trabecular separation of WT (n = 7) and IL-11−/− mice (n = 5); MAR, mineral apposition rate of WT (n = 5) and IL-11−/− mice (n = 5); BFR, bone formation rate of WT (n = 5) and IL-11−/− mice (n = 5); Oc.S/BS, osteoclast surface/bone surface of WT (n = 7) and IL-11−/− mice (n = 5); N.Oc/B.Pm, number of osteoclasts/bone perimeter of WT (n = 6) and IL-11−/− mice (n = 6); OS/BS, osteoid surface/bone surface of WT (n = 7) and IL-11−/− mice (n = 5); Ob.S/BS, osteoblast surface/bone surface of WT (n = 7) and IL-11−/− mice (n = 5); N.Ob/B.Pm, number of osteoblasts/bone perimeter of WT (n = 7) and IL-11−/− mice (n = 5). Data are means ± SE. P values are calculated by two-tailed Student’s unpaired t-test.
Fig. 2
Fig. 2. Decreased expression of osteoblastic genes with enhanced expression of Wnt inhibitors and reduced Wnt signaling in the femoral bone, and reduced serum bone formation markers in IL-11−/− mice.
a Expression of osteoblastic and osteoclastic genes in femur of 12-week-old WT and IL-11−/− mice. Ocn, osteocalcin; Runx2; Osx, osterix in WT (n = 5) and IL-11−/− mice (n = 5); Rankl, receptor activator of NF-kB ligand; Opg, osteoprotegerin; Trap, tartrate-resistant acid phosphatase in WT (n = 4) and IL-11−/− mice (n = 4); Ctsk, Cathepsin K in WT (n = 4) and IL-11−/− mice (n = 5). Data are mean ± SD. P values are calculated by two-tailed Student’s unpaired t-test. b Serum bone turnover markers. OCN, osteocalcin in WT (n = 6) and IL-11−/− mice (n = 6); ALP, alkaline phosphatase in WT (n = 6) and IL-11−/− mice (n = 7); TRAP, tartrate-resistant acid phosphatase in WT (n = 4) and IL-11−/− mice (n = 5). Serum IL-6 in WT (n = 6) and IL-11−/− mice (n = 6). Data are means ± SD. P values are calculated by two-tailed Student’s unpaired t-test. c Messenger RNA expression of Wnt inhibitors. Sost in WT (n = 4) and IL-11−/− mice (n = 6); Dkk1, Dickkopf1 in WT (n = 5) and IL-11−/− mice (n = 5); Dkk2 in WT (n = 4) and IL-11−/− mice (n = 5). Data are means ± SD. P values are calculated by two-tailed Student’s unpaired t-tests. d Wnt target genes in femoral bones from 12-week-old WT (n = 5) and IL-11−/− mice (n = 5). Ccnd1, Cyclin D1. Data are means ± SD. P values are calculated by two-tailed Student’s unpaired t-tests. e X-gal staining and immunostaining for sclerostin, Dkk1 and 2 of tibia from 10-week-old WT and IL-11−/− mice. Scale bar indicates 100 μm. Figures in the bottom panel demonstrate numbers of stained cells in each microscopic field at ×100 magnification. Data are means of triplicate counts in each mouse from 5 mice and expressed as means ± SD. P values are calculated by two-tailed Student’s unpaired t-test. f STAT1,3 phosphorylation after stimulation with 20 ng/ml IL-11 for 0, 15 and 30 min. A representative figure of three independent experiments. g Expression of Rankl, Osteoprotegerin (Opg) and Sost genes in IL-11Rα knockout (n = 3) and control MC3T3-E1 cells (n = 3). Data are means ± SD. P values are calculated by two-tailed Student’s unpaired t-tests. h Effect of 20 ng/mL IL-11 on nuclear translocation of HDAC4 and 5 in the presence or absence of 10 μM STAT-IN-1, a STAT3 inhibitor. A representative figure of three independent experiments. i Densitometric measurement of HDAC4 and 5 accumulated in the nucleus of MC3T3-E1 cells 24 h after 20 ng/mL IL-11 treatment in the presence (n = 3) or absence (n = 3) of 10 μM STAT-IN-1. The results are expressed as a relative amount of HDAC4/5 accumulated in the nucleus to that without IL-11 treatment. Data are means ± SD. P values are calculated by ordinary one-way ANOVA with Sidak’s multiple comparisons test. j Effect of 20 ng/mL IL-11 on Sost mRNA expression in the presence (n = 3) or absence (n = 3) of 10 μM STAT-IN-1. Data are means ± SD. P values are calculated by ordinary one-way ANOVA with Sidak’s multiple comparisons test.
Fig. 3
Fig. 3. Normal enhancement of bone resorption in response to mechanical unloading, and reduced bone formation in response to mechanical reloading with sustained elevation of Wnt inhibitors in IL-11−/− mice.
a Vertebral BMD in ground control (GC) group of WT (n = 7) and IL-11−/− mice (n = 7), tail suspension (TS) group of WT (n = 8) and IL-11−/− mice (n = 8) and reloading (RL) group of WT (n = 6) and IL-11−/− mice (n = 8). Data are means ± SE. *P < 0.0001 vs WT, and #P = 0.0217, ##P < 0.0001 vs GC group in the same genotype using one-way ANOVA with Tukey’s multiple comparisons test. b BMD change after TS in WT (open bar) (n = 8) and IL-11−/− mice (closed bar) (n = 8), and after RL in WT (n = 6) and IL-11−/− mice (n = 8). Data are means ± SD. P values are calculated by two-way ANOVA with Bonferroni’s multiple comparisons test. c Expression of Wnt inhibitors in femoral bones from WT in GC (n = 6), TS (n = 6) and RL (n = 7) goups, and from IL-11−/− mice in GC (n = 7), TS (n = 6) and RL (n = 6) goups. Data are means ± SD. P values are calculated using two-way ANOVA with Tukey’s multiple comparisons test. d Bone histomorphometric analysis of the vertebrae of WT and IL-11−/− mice. OS/BS, osteoid surface/bone surface of WT in GC, TS and RL group (n = 3), and of IL-11−/− mice in GC, TS and RL group (n = 4); Ob.S/BS, osteoblast surface/bone surface of WT in GC (n = 6), TS (n = 3) and RL group (n = 4), and of IL-11−/− mice in GC (n = 5), TS (n = 4) and RL group (n = 4); ES/BS, eroded surface/bone surface of WT in GC (n = 3), TS (n = 3) and RL group (n = 4), and of IL-11−/− mice in GC (n = 3), TS (n = 4) and RL group (n = 4); Oc.S/BS, osteoclast surface/bone surface of WT in GC (n = 3), TS (n = 3) and RL group (n = 4), and of IL-11−/− mice in GC (n = 3), TS (n = 4) and RL group (n = 4); MAR, mineral apposition rate of WT and IL-11−/− mice (n = 4); BFR/BS, bone formation rate of WT in GC (n = 4) and RL (n = 7), and of IL-11−/− mice in GC (n = 4) and RL (n = 6). Data are means ± SD. P values are calculated using two-way ANOVA with Tukey’s multiple comparisons test. e Serum IL-11 level of WT mice in GC, TS and RL groups. n = 5. Data are means ± SD. P values are calculated using two-way ANOVA with Tukey’s multiple comparisons test.
Fig. 4
Fig. 4. Enhanced systemic adipogenesis along with enhanced adipogenic differentiation with reduced osteogenic differentiation of BMSCs in IL-11−/− mice.
a H.E. staining of tibia from 4, 8, 12, and 16-week-old WT and IL-11−/− mice. Scale bar = 500 μm. Representative pictures of three independent experiments. b, c Oil-Red O staining of bone marrow stromal cells (BMSC) from 12-week-old WT and IL-11−/− mice. Scale bar = 100 μm. Adipogenesis was induced by 10−6M troglitazone, with vehicle or 50 ng/ml recombinant IL-11. n = 5. Data are means ± SD. P value is calculated using two-way ANOVA with Tukey’s multiple comparisons test. d Expression of osteogenic and adipogenic genes in BMSC from WT and IL-11−/− mice. Pparγ, peroxisome proliferator-activated receptor γ; Cebpα, CCAAT enhancer binding protein α. n = 4. Data are means ± SD. P values are calculated using two-way ANOVA with Tukey’s multiple comparisons test. e Micro-CT analysis at L5 level of WT and IL-11−/− mice on regular (RD) or high-fat diet (HFD) at 24 weeks. Pink, visceral AT (viAT); yellow, subcutaneous AT (subAT); blue, lean mass; white, vertebral bone. f Quantitative analysis of total adipose tissue area at 12 weeks of WT on RD (n = 10) or HFD (n = 7) and of IL-11−/− mice on RD (n = 8) or HFD (n = 8). Total adipose tissue area at 24 weeks of WT on RD (n = 11) or HFD (n = 8) and of IL-11−/− mice on RD (n = 7) or HFD (n = 8). Data are means ± SE. P values are calculated using two-way ANOVA with Tukey’s multiple comparisons test. g Fasting serum leptin (n = 3) and adiponectin (n = 4) in WT and IL-11−/− mice on RD or HFD. P values are calculated using two-way ANOVA with Tukey’s multiple comparisons test. h Adipocyte diameter in WAT from 32-week-old WT (n = 4) and IL-11−/− mice on RD (n = 6) or HFD (n = 7). Relative adipocyte number in WAT from 32-week-old WT (n = 4) and IL−11−/− mice (n = 6). Data are means ± SD. P values are calculated using two-way ANOVA with Tukey’s multiple comparisons test.
Fig. 5
Fig. 5. Increased adiposity with reduced expression of lipolytic genes, enhanced expression of inflammatory cytokines, and glucose intolerance with reduced insulin sensitivity in IL−11−/− mice.
a Brown adipose tissue (BAT) weight and the expression of BAT-specific genes in WT and IL-11−/− mice under RD and HFD. BAT weight and expression of thermogenesis genes, Pgc1α and Ucp-1 in BAT were measured at 12 weeks. Pgc1α PPAR-gamma coactivator 1 alpah, Ucp-1 uncoupling protein 1. n = 4. Data are means ± SD. No significant difference was observed between WT and IL-11−/− mice by two-tailed Student’s unpaired t-test. b Expression of lipolysis-associated genes, Hsl, hormone-sensitive lipase in WAT at 32 weeks of WT (n = 5) and of IL-11−/− mice on RD (n = 7) or HFD (n = 6) and Atgl, adipose triglyceride lipase in WAT at 32 weeks of WT (n = 5) and of IL-11−/− mice on RD (n = 7) or HFD (n = 5). Expression of β-oxidation-associated gene Aco, acyl-CoA oxidation in WAT at 32 weeks of WT on RD (n = 6) or HFD (n = 5) and of IL-11−/− mice on RD (n = 6) or HFD (n = 7), and lipogenesis-associated gene Acc, acetyl CoA carboxylase in WAT at 32 weeks of WT on RD (n = 7) or HFD (n = 5) and of IL-11−/− mice on RD (n = 6) or HFD (n = 7). Data are means ± SE. P values are calculated using two-way ANOVA with Tukey’s multiple comparisons test. c X-gal staining of visceral (viAT) and subcutaneous AT (subAT) from WT and IL-11−/− mice. d Expression of Wnt inhibitors, Dkk1 in WAT from WT (n = 6) and IL-11−/− mice on RD (n = 5) or HFD (n = 4), and Dkk2 in WAT from WT on RD (n = 6) or HFD (n = 7) and of IL-11−/− mice on RD or HFD (n = 6). Data are means ± SD. P values are calculated using two-way ANOVA with Tukey’s multiple comparisons test. e Expression of inflammatory cytokines MCP1, monocyte chemoattractant protein 1 in WAT from WT on RD (n = 4) or HFD (n = 6) and IL-11−/− mice on RD or HFD (n = 6), and TNFα, tumor necrosis factor α in WAT from WT on RD (n = 5) or HFD (n = 9) and IL-11−/− mice on RD (n = 7) or HFD (n = 10). Data are means ± SD. P values are calculated using two-way ANOVA with Tukey’s multiple comparisons test. f Changes in blood glucose by oral glucose tolerance test (oGTT) at 24 weeks of WT on RD (n = 6) or HFD (n = 4) and of IL-11−/− mice on RD (n = 5) or HFD (n = 4). Data are means ± SD. *P = 0.0106, **P = 0.0074 on RD, and *P = 0.0465, **P = 0094 on HFD between WT and IL-11−/− mice. P values are calculated by two-tailed Student’s unpaired t-test. Insets show AUC of blood glucose from WT on RD (n = 6) or HFD (n = 4) and of IL-11−/− mice on RD (n = 5) or HFD (n = 4). Data are means ± SD. P values are calculated by two-tailed Student’s unpaired t-test. g Insulin levels of WT (n = 5) and IL-11−/− mice (n = 4). HOMA-IR of WT on RD (n = 5) or HFD (n = 4) and IL-11−/− mice (n = 4). Data are means ± SD. P values are calculated by two-tailed Student’s unpaired t-test.
Fig. 6
Fig. 6. Bone and adipose tissue phenotypes of osteoblast/osteocyte-specific IL-11 deleted mice recapitulate systemic IL-11−/− mice.
a PCR analysis of genomic DNA extracted from calvaria, femur, tibia viAT, suAT and skin of Ocn-Cre;IL-11fl/fl and Apn-Cre;IL-11fl/fl mice. Representative figures of three independent experiments. b Micro-CT of femoral bones from 12-week-old IL-11fl/fl control, Ocn-Cre;IL-11fl/fl and Apn-Cre;IL-11fl/fl mice. Scale bar = 1 mm. c Total, cortical and cancellous BMD at 12 weeks of vertebral bone from control, Ocn-Cre;IL-11fl/fl and Apn-Cre;IL-11fl/fl mice (n = 5), and femoral bone from control, Ocn-Cre;IL-11fl/fl and Apn-Cre;IL-11fl/fl mice (n = 4). Data are means ± SD. P values are calculated using two-way ANOVA with Tukey’s multiple comparisons test. d Serum IL-11 (n = 4) and bone turnover markers, Ocn, osteocalcin in control (n = 6), Ocn-Cre;IL-11fl/fl (n = 7) and Apn-Cre;IL-11fl/fl mice (n = 6), ALP, alkaline pohosphatase in control (n = 8), Ocn-Cre;IL-11fl/fl (n = 6) and Apn-Cre;IL-11fl/fl mice (n = 9), and TRAP, tartrate-resistant acid phosphatase in control (n = 8), Ocn-Cre;IL-11fl/fl (n = 5) and Apn-Cre;IL-11fl/fl mice (n = 8). Data are means ± SD. P values are calculated using ordinary one-way ANOVA with Tukey’s multiple comparisons test. e Expression of osteoblastic and osteoclastic genes in femurs of 12-week-old control, Ocn-Cre;IL-11fl/fl and Apn-Cre;IL-11fl/fl mice. n = 5. Data are means ± SD. P values are calculated using two-way ANOVA with Tukey’s multiple comparisons test. f BMD change after TS and RL in control (open bar) and Ocn-Cre;IL-11fl/fl mice (closed bar). n = 6. Data are means ± SD. P values are calculated using two-way ANOVA with Bonferroni’s multiple comparisons test. g Micro-CT scan at L5 level and h quantitative analysis at 12 weeks of total AT area in control on RD (n = 6) or HFD (n = 5), Ocn-Cre;IL-11fl/fl on RD (n = 5) or HFD (n = 6) and Apn-Cre;IL-11fl/fl mice on RD (n = 8) or HFD (n = 7), of viAT (visceral AT) area in IL-11fl/fl control on RD or HFD (n = 5), Ocn-Cre;IL-11fl/fl on RD or HFD (n = 6) and Apn-Cre;IL-11fl/fl mice on RD or HFD (n = 7), and of subcutaneous AT area in control on RD or HFD (n = 4), Ocn-Cre;IL-11fl/fl on RD or HFD (n = 4) and Apn-Cre;IL-11fl/fl mice on RD or HFD (n = 7). Pink, viAT; yellow, subAT; blue, lean mass; white, vertebral bone. AT area at 12 weeks. Data are means ± SD. P values are calculated using two-way ANOVA with Tukey’s multiple comparisons test. i Changes in blood glucose by oral glucose tolerance test (oGTT) at 24 weeks of IL-11fl/fl control (n = 8), Ocn-Cre;IL-11fl/fl (n = 8) and Apn-Cre;IL-11fl/fl mice (n = 6) on RD or HFD. Data are means ± SD. *P = 0.0039, **P < 0.0001 between control and Ocn-Cre;IL-11fl/fl or Apn-Cre;IL-11fl/fl mice using two-way ANOVA with Tukey’s multiple comparisons test. Insets show AUC of blood glucose. Data are means ± SD. P values are calculated using ordinary one-way ANOVA with Tukey’s multiple comparisons test. j Insulin levels and HOMA-IR of control on RD (n = 4) or HFD (n = 5), Ocn-Cre;IL-11fl/fl on RD (n = 3) or HFD (n = 4) and Apn-Cre;IL-11fl/fl mice on RD (n = 4) or HFD (n = 5). Data are means ± SD. P values are calculated using ordinary one-way ANOVA with Tukey’s multiple comparisons test.
Fig. 7
Fig. 7. Signaling pathway of IL-11 in the adipose tissue in osteoblast/osteocyte-specific IL-11−/− mice.
a Micro-CT scan at L5 level. Pink, viAT; yellow, subAT; blue, lean mass; white, vertebral bone, and b quantitative analysis of adipose tissue in IL-11fl/fl control and Ocn-Cre;IL-11fl/fl mice on RD or HFD in the presence or absence of WAY-262611, a β-catenin agonist and a Dkk1 antagonist. WAY-262611 at a dose of 2 mg/kg/day was orally given to mice 3 days a week (4 mg/kg mice/dose on Monday and Wednesday and 6 mg/kg mice/dose on Friday) starting at the age of 4 weeks to the end of experiments at the age of 12 weeks. n = 5. Data are means ± SD. P values are cauculated using two-way ANOVA with Tukey’s multiple comparisons test. c Expression of an adipogenic gene, Cebpα, CCAAT enhancer binding protein α, a Wnt inhibitor, Dkk2, dickopf2, and a Wnt target gene, Axin, in the adipose tissue of IL-11fl/fl control and Ocn-Cre;IL-11fl/fl mice on RD or HFD in the presence or absence of WAY-262611 at the age of 12 weeks. n = 3. Data are means ± SD. P values are calculated using two-way ANOVA with Tukey’s multiple comparisons test. d Expression of Sost in the bone and the adipose tissue in IL-11fl/fl control and Ocn-Cre;IL-11fl/fl mice. n = 6. Data are means ± SD. P values are calculated by two-way ANOVA with Sidak’s multiple comparisons test. e Oil-Red O staining of WT and IL-11Rα−/− C3H10T1/2 cells in an adipogenic medium and cultured for 7 days. Representative pictures of three independent experiments. Scale bar = 100 μm. f Expression of adipogenic genes, Pparγ and Cebpα, and Wnt inhibitor genes, Dkk1, 2, in WT and IL-11Rα−/− C3H10T1/2 cells in an adipogenic medium and cultured for 7 days in the presence or absence of 10 ng/mL IL-11. n = 3. Data are means ± SD. P values are calculated using ordinary one-way ANOVA with Tukey’s multiple comparisons test.
Fig. 8
Fig. 8. Diagram of the summary of the present observations in the regulation of bone and adipose tissue mass by exercise-induced mechanical loading to the bone.
Exercise creates mechanical loading to the bone, which stimulates IL-11 expression in the bone. IL-11 produced in the bone acts locally to enhance osteogenesis via a stimulation of Wnt signaling by suppressing the expression of Wnt inhibitors including sclerostin, and increases bone mass. At the same time, exercise-induced increase in IL-11 in the bone acts like a hormone, and suppresses the expression of Wnt inhibitors, Dkk1 and 2, in the adipose tissue. The enhanced Wnt signaling in the adipose tissue suppresses adipogenesis to increase energy supply for exercise.

References

    1. Kinoshita Y, Fukumoto S. X-Linked hypophosphatemia and FGF23-related hypophosphatemic diseases: prospect for new treatment. Endocr. Rev. 2018;39:274–291. doi: 10.1210/er.2017-00220. - DOI - PubMed
    1. Takashi Y, et al. Activation of unliganded FGF receptor by extracellular phosphate potentiates proteolytic protection of FGF23 by its O-glycosylation. Proc. Natl Acad. Sci. USA. 2019;116:11418–11427. doi: 10.1073/pnas.1815166116. - DOI - PMC - PubMed
    1. Wei J, Karsenty G. An overview of the metabolic functions of osteocalcin. Rev. Endocr. Metab. Disord. 2015;16:93–98. doi: 10.1007/s11154-014-9307-7. - DOI - PMC - PubMed
    1. Kido S, et al. Mechanical stress induces Interleukin-11 expression to stimulate osteoblast differentiation. Bone. 2009;45:1125–1132. doi: 10.1016/j.bone.2009.07.087. - DOI - PubMed
    1. Kawashima I, et al. Molecular cloning of cDNA encoding adipogenesis inhibitory factor and identity with interleukin-11. FEBS Lett. 1991;283:199–202. doi: 10.1016/0014-5793(91)80587-S. - DOI - PubMed

Publication types