. 2022 Nov 24;8(1):162.
doi: 10.1038/s41531-022-00423-7.

Protein aggregation and calcium dysregulation are hallmarks of familial Parkinson's disease in midbrain dopaminergic neurons

Affiliations

Protein aggregation and calcium dysregulation are hallmarks of familial Parkinson's disease in midbrain dopaminergic neurons

Gurvir S Virdi et al. NPJ Parkinsons Dis. .

Abstract

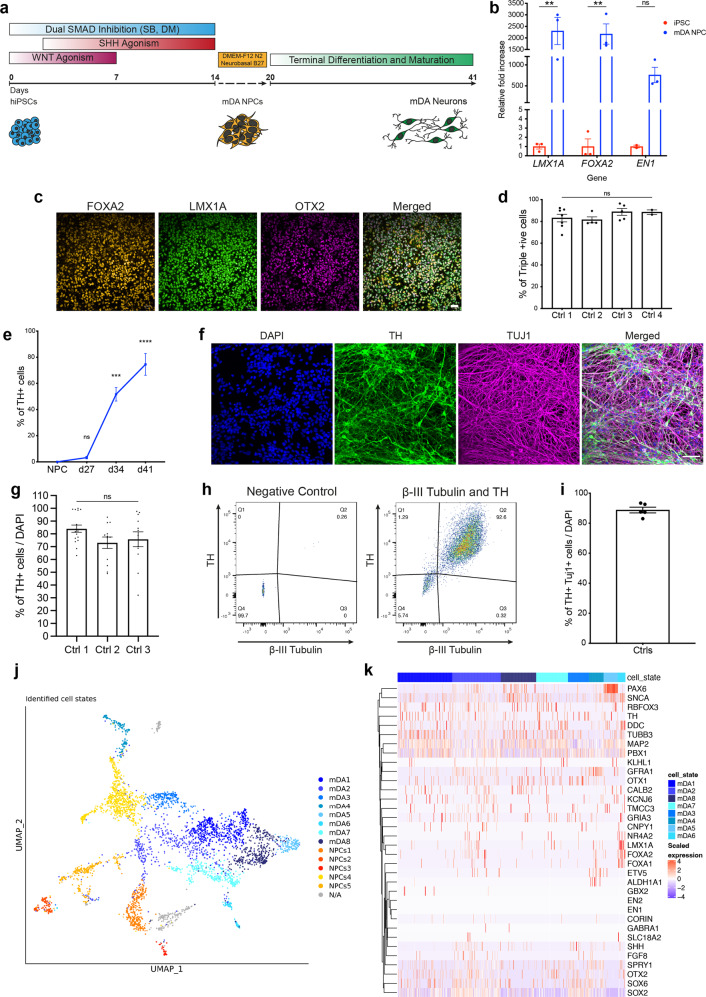
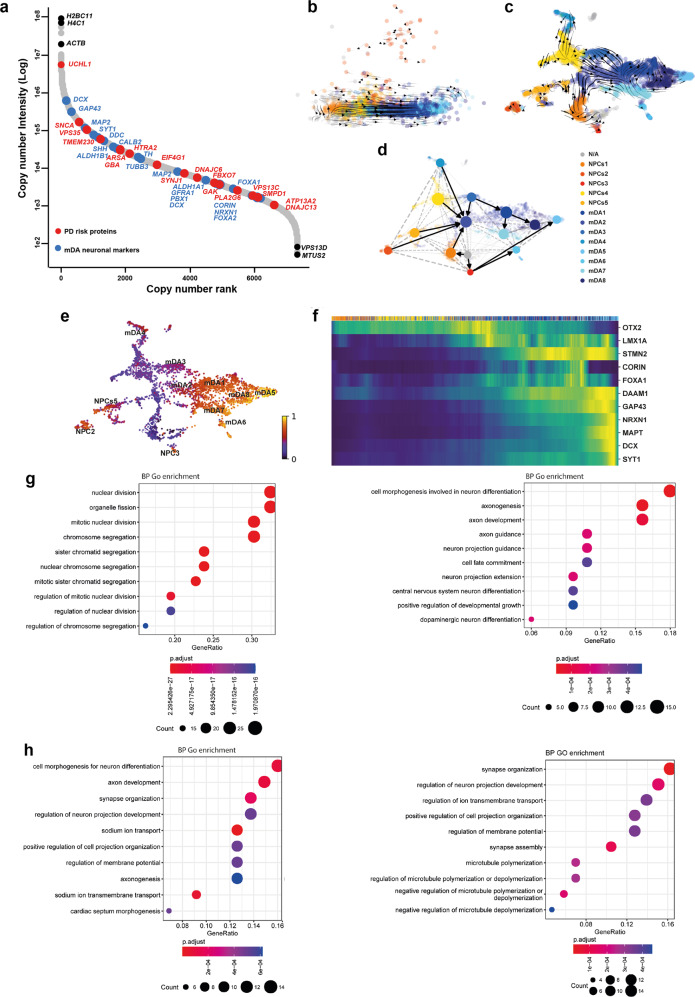
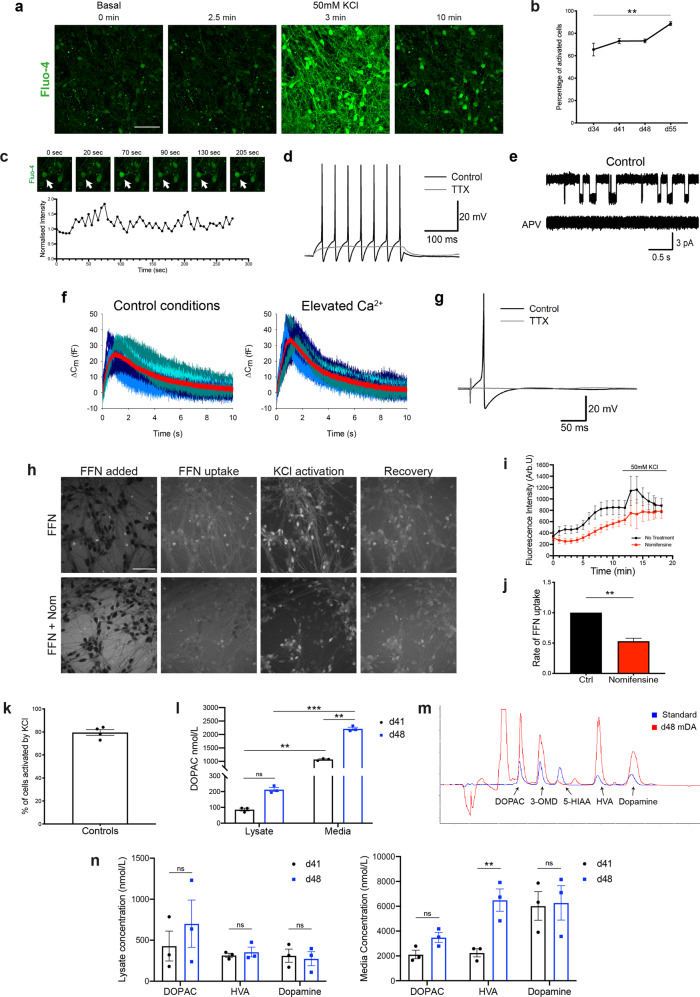
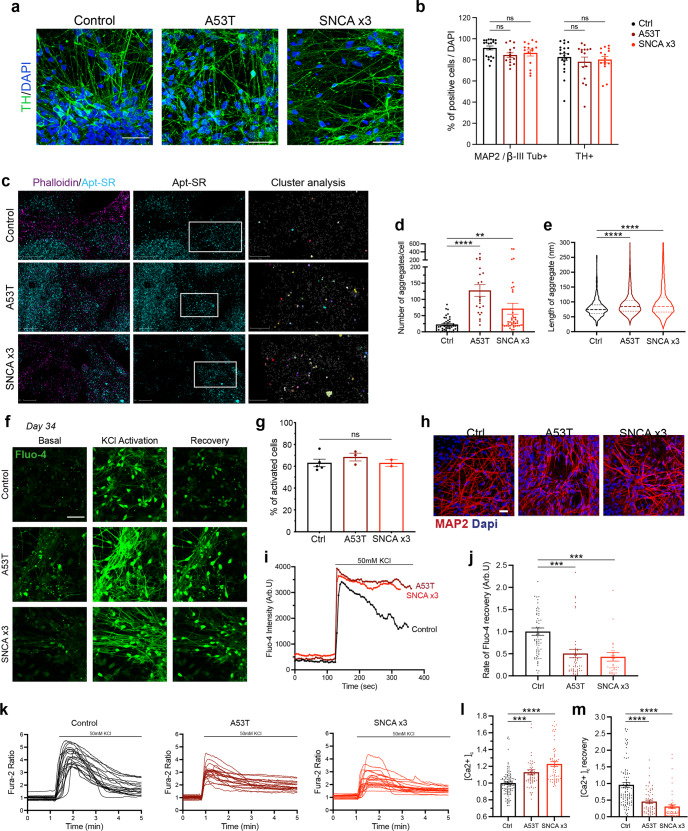
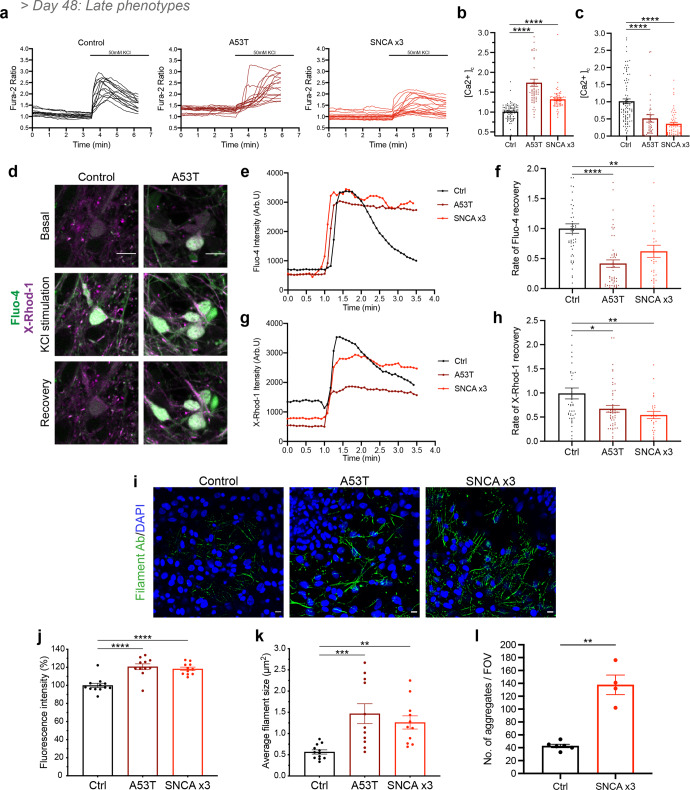
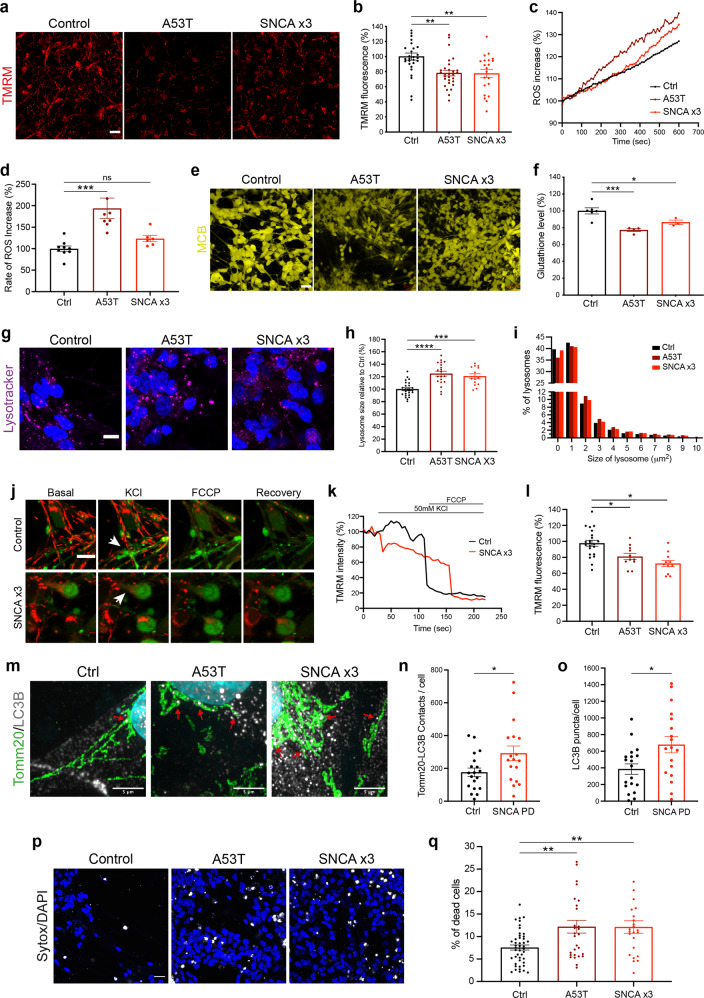
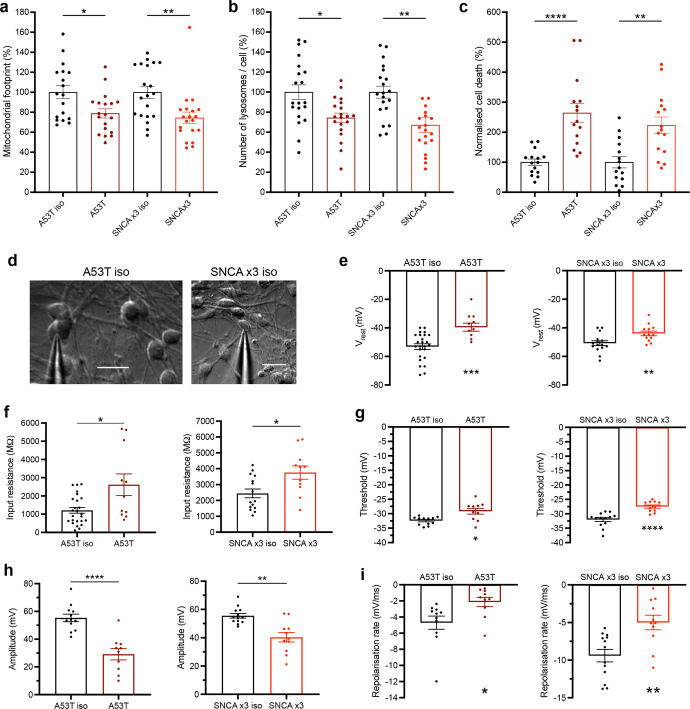
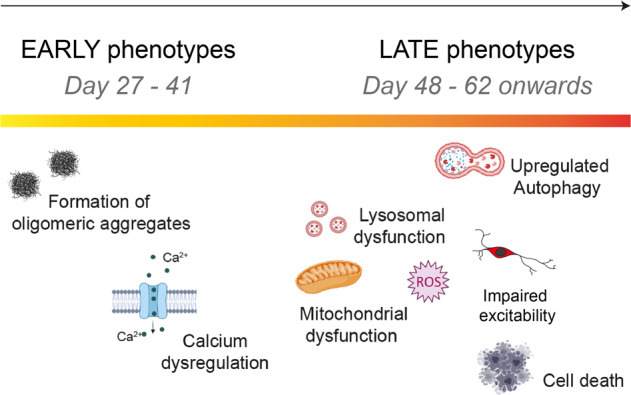
Mutations in the SNCA gene cause autosomal dominant Parkinson's disease (PD), with loss of dopaminergic neurons in the substantia nigra, and aggregation of α-synuclein. The sequence of molecular events that proceed from an SNCA mutation during development, to end-stage pathology is unknown. Utilising human-induced pluripotent stem cells (hiPSCs), we resolved the temporal sequence of SNCA-induced pathophysiological events in order to discover early, and likely causative, events. Our small molecule-based protocol generates highly enriched midbrain dopaminergic (mDA) neurons: molecular identity was confirmed using single-cell RNA sequencing and proteomics, and functional identity was established through dopamine synthesis, and measures of electrophysiological activity. At the earliest stage of differentiation, prior to maturation to mDA neurons, we demonstrate the formation of small β-sheet-rich oligomeric aggregates, in SNCA-mutant cultures. Aggregation persists and progresses, ultimately resulting in the accumulation of phosphorylated α-synuclein aggregates. Impaired intracellular calcium signalling, increased basal calcium, and impairments in mitochondrial calcium handling occurred early at day 34-41 post differentiation. Once midbrain identity fully developed, at day 48-62 post differentiation, SNCA-mutant neurons exhibited mitochondrial dysfunction, oxidative stress, lysosomal swelling and increased autophagy. Ultimately these multiple cellular stresses lead to abnormal excitability, altered neuronal activity, and cell death. Our differentiation paradigm generates an efficient model for studying disease mechanisms in PD and highlights that protein misfolding to generate intraneuronal oligomers is one of the earliest critical events driving disease in human neurons, rather than a late-stage hallmark of the disease.


Conflict of interest statement

The authors declare no competing interests.

Figures

Fig. 1
Fig. 1. Characterisation of an enriched population of mDA NPCs and neurons.
a Differentiation protocol to generate mDA neurons. b Quantitative PCR at day 14–20 of differentiation showing mRNA for LMX1A, FOXA2, and EN1 relative to hiPSCs (ns P > 0.05, **P < 0.005). c Representative ICC images showing expression of FOXA2, LMX1A, and OTX2 (scale bar = 50 μm). d Quantification showing >80% of cells co-express FOXA2, LMX1A and OTX2 (ns P > 0.05, ordinary one-way ANOVA). e Quantification of ICC images showing the increase in expression of the mDA marker, TH over differentiation (weeks) (ns P > 0.05, ***P < 0.0005, ****P < 0.0001, ordinary one-way ANOVA). f Representative ICC images showing TH and TUJ1 expression after 41 days of differentiation (scale bar = 50 μm). g ICC Quantification showing approximately 80% cells express TH (ns P > 0.05, ordinary one-way ANOVA). h Representative dot plots of single-cell suspensions showing % TH and β-III Tubulin +ve cells (day 41). A negative control (DAPI only) was used to determine quantification thresholds (n = 10,000 events recorded per measurement). i Quantification of flow cytometry showing >80% of DAPI-positive cells co-express TH and β-III Tubulin. j A UMAP plot showing the 14 clusters identified from single-cell RNA-seq after day 48 of differentiation. Neuronal mDA (mDA1–8) clusters are in blue, and NPC clusters (NPCs1–5) are in red, orange and yellow. An unidentified cluster (N/A) is coloured in grey. k Heatmap showing expression of genes in clusters identified as mDA neurons (mDA1–8). Each line represents a cell from that cluster. All data plotted as ±s.e.m. All N numbers for each experiment can be found in Supplementary Table 5.
Fig. 2
Fig. 2. RNA velocity demonstrates developmental streams from NPCs into mDA neurons reminiscent of a developing midbrain.
a Rank abundance plot showing copy number of proteins from proteomic analysis with expression of mDA proteins in blue and PD-linked proteins in red. b PCA visualises the progression from precursor cells (NPCs) (yellow-red colours) towards mDA neuronal cells (blue colours). RNA velocity trajectories are indicated by arrows. c Velocity stream visualised in UMAP reveals a more detailed progression of the direction of differentiation. d PAGA graph showing the NPC cluster transition into mDA neuron clusters. e Velocity inferred latent time analysis visualised in UMAP, showing mDA clusters are later (brighter colour) in time than NPC clusters (darker colours). f A heatmap listing a selection of cluster driver genes sorted according to their inferred latent time. g, h GO enrichment analysis to clarify gene categories per cell cluster based on the functional characteristics of the driver genes. g Example of GO enrichment of two NPC clusters showing that some clusters are more proliferative (left graph), and some are more differentiated and on the neuronal pathway (right graph). h Example of two mDA neuron clusters showing complex neuronal pathways which are highly activated.
Fig. 3
Fig. 3. Functional characterisation of mDA neurons.
a Representative time series images of mDA neurons at day 55 of differentiation, in response to KCl (scale bar = 50 μm). b Quantification of the number of cells with calcium response (ns P > 0.05, **P = 0.0075, two-way ANOVA). c Representative time series images of spontaneous calcium activity at day 41 of differentiation, with the Fluo-4 intensity trace of the highlighted cell (arrow) plotted below. d APs triggered by current injection in mDA neurons at day 30 of differentiation. 1 mM tetrodotoxin (TTX) suppresses APs. e Single-channel openings of NMDA receptors in an outside-out patch excised from mDA neurons at day 30 of differentiation. Top trace: application of 10 mM glutamate + 10 mM glycine triggers single-channel openings. Bottom trace: 50 mM APV suppresses single-channel opening. f Changes in whole-cell membrane capacitance confirm elevated intensity of vesicle release in mDA neurons at day 70 of differentiation. Shadows of blue, high noise. Red trace with low noise: averaged trace. Left: control. Right: elevated Ca2+ magnifies the effect on membrane capacitance. g AP generation in response to field stimulation in mDA neurons at day 105 of differentiation. h Representative images showing sequential uptake and stimulation with 50 mM KCl of the DAT fluorescent substrate FFN102 (FFN) in day 41–48 mDA neurons. Lower panels show FFN uptake in the presence of the DAT inhibitor, nomifensine (scale bar = 50 μm). i Representative trace showing increase in intracellular FFN with time, as well as response to KCl stimulation. Nomifensine reduces the rate of FFN uptake. Values plotted as ±s.d. j Quantification of the normalised rate of FFN uptake (Welch’s t test, **P = 0.0024). k Quantification of the number of FFN-positive cells once stimulated by KCl. l Quantification of the amount of the metabolite DOPAC in basal day 41 (3w) or day (48) old mDA neurons (ns P > 0.05, **P < 0.008, ***P = 0.0002, ordinary two-way ANOVA). m Example chromatogram from day 48 mDA neuron culture treated with L-Dopa (red trace) against a standard (blue trace) showing the presence or absence (peaks) of the metabolites DOPAC, 3-O-methyldopa (3-OMD), 5-HIAA, HVA, Dopamine. n Quantification of the metabolites DOPAC, HVA, and Dopamine in lysate, or media of l-Dopa treated day 41 and day 48 mDA neurons (ns P > 0.05, **P < 0.005, ordinary two-way ANOVA). All values are plotted as ±s.e.m unless stated otherwise. All N numbers for each experiment can be found in Supplementary Table 5.
Fig. 4
Fig. 4. Generation of mDA neurons from hiPSC lines from patients with SNCA mutations display early α-synuclein aggregation and calcium dysregulation.
a Representative ICC images of control, A53T, and SNCA x3 mDA neurons showing high TH expression. Scale bar = 50 μm. b Quantification of % MAP2 and TH-positive cells after day 41 of differentiation (ns P > 0.05, two-way ANOVA). c Super-resolved images from control, A53T, SNCA x3 day 27 mDA neurons. Left panel shows phalloidin and aptamer. Middle panel shows only super-resolved aptamer binding events. Last panel shows a magnified version of aggregates detected by DBSCAN. Left panel scale bar = 2 μm. Middle panel scale bar = 2 μm. Right panel = 1 μm. d Quantification showing the number of aggregates per cell in control, A53T and SNCA x3 mDA neurons (ns P > 0.05, *P < 0.05, **P < 0.005, one-way ANOVA). e Quantification showing the length of all aggregates in control, A53T and SNCA x3 mDA neurons represented in a violin plot (****P < 0.0001, one-way ANOVA). f Representative time series Ca2+ images in response to KCl (scale bar = 50 μm). g Quantification of the number of cells with KCl-induced calcium signal at day 34 of differentiation (ns P > 0.05, one-way ANOVA). h Representative images of neuronal marker expression. i Representative single-cell trace in patient mDA neurons. j Quantification of the normalised rate of recovery of Fluo-4 after stimulation with KCl (***P = 0.0002, one-way ANOVA). k Representative traces showing the Fura-2 ratio in response to 50 mM KCl in day 41 control neurons, A53T neurons, and SNCA x3 neurons. l Quantification of the basal calcium Fura-2 ratio ([Ca2+]c) before KCl stimulation (***P < 0.0005, ****P < 0.0001, one-way ANOVA). m Quantification of the rate of calcium ([Ca2+]c) recovery in response to KCl (****P < 0.0001, one-way ANOVA). All values are plotted as ±s.e.m. All N numbers for each experiment can be found in Supplementary Table 5.
Fig. 5
Fig. 5. α-synuclein aggregation and calcium dysregulation persist in older mDA neurons.
a Representative traces showing the Fura-2 ratio in response to 50 mM KCl at day 48 of differentiation in control neurons, A53T neurons, and SNCA x3 neurons. b Quantification of the basal calcium ratio ([Ca2+]c) before KCl stimulation (****P < 0.0001, one-way ANOVA). c Quantification of the rate of calcium ([Ca2+]c) recovery in response to KCl (****P < 0.0001, one-way ANOVA). d Representative time series snapshots of >day 48 control and A53T neurons loaded with Fluo-4 (green) and X-Rhod-1 (magenta) (scale bar = 10 μm). e Representative single-cell trace showing delayed recovery of Fluo-4 after KCl stimulation in patient mDA neurons. f Quantification of the normalised rate of recovery of Fluo-4 after stimulation with KCl in >day 48-old neurons (**P = 0.003, ****P < 0.0001, one-way ANOVA). g Representative single-cell trace showing delayed recovery of X-Rhod-1 after KCl stimulation in patient mDA neurons. h Quantification of the normalised rate of recovery of X-Rhod-1 after stimulation with KCl (*P < 0.05, **P < 0.005, one-way ANOVA). i Representative ICC images showing the expression of aggregated forms of α-synuclein recognised by a conformation-specific antibody, at day 62 of differentiation. Scale bar = 10 μm. j Quantification of the normalised fluorescence intensity of aggregated forms of alpha-synuclein (****P < 0.0001, one-way ANOVA). k Quantification of the average puncta size of the aggregated alpha-synuclein (**P = 0.0082, ***P = 0.0007, one-way ANOVA). l Quantification showing the number of aggregates per field of view (FOV) from mDA neuronal lysate at day 62 (**P < 0.005, Welch’s t test). All values plotted as ±s.e.m. All N numbers for each experiment can be found in Supplementary Table 5.
Fig. 6
Fig. 6. Cellular dysfunction and cell death arise later in SNCA PD mDA neurons.
a Representative live-cell imaging of mitochondrial fluorescence using the lipophilic cationic dye TMRM at day 48 of differentiation. Scale bar = 10 μm. b Quantification of the normalised fluorescence intensity of TMRM (**P < 0.005, one-way ANOVA). c Trace showing the ratiometric measurement of superoxide generation using dihydroethidium (HEt) at day 48 of differentiation. d Quantification of the rate of superoxide generation based on HEt ratiometric fluorescence (ns P > 0.05, ***P < 0.0005, one-way ANOVA). e Representative live-cell imaging of endogenous glutathione using the fluorescent reporter MCB at day 48 of differentiation. Scale bar = 20 μm. f Quantification of the endogenous level of glutathione based on MCB fluorescence (*P < 0.05, ***P = 0.0009, one-way ANOVA). g Representative live-cell imaging of lysosomes and nuclear marker Hoechst 33342 at day 48 of differentiation (scale bar = 5 μm). h Quantification of the normalised average lysosomal area/size (***P = 0.0002, ****P < 0.0001, one-way ANOVA). i Histogram plot showing the percentage of total lysosomes in each set area bin (0–10 μm2). j Representative time series snapshots of TMRM (red) and Fluo-4 (green) in day 62 old neurons showing the response to KCl and FCCP. The arrow in the control cell highlights polarised mitochondria and calcium response to KCl and FCCP. Arrowhead in the SNCA x3 cell highlights KCL-induced TMRM intensity decrease. Scale bar = 10 μm. k Representative single-cell trace showing TMRM intensity in response to KCl and FCCP in control and SNCA x3 day 62 old neurons. l Quantification showing the decrease in TMRM intensity after KCl stimulation in control, A53T and SNCA x3 neurons (*P < 0.05, one-way ANOVA). m Instant Structured illumination microscopy (iSIM) images of control, A53T, and SNCA x3 day 55 neurons probed for mitochondrial marker Tomm20, and the autophagosome marker LC3B. Scale bar = 5 μm). n Quantification of the number of Tomm20-LC3B colocalizations per cell (*P < 0.05, Welch’s t test). o Quantification of the number of LC3B puncta per cell (*P < 0.05, Welch’s t test). p Live-cell images depicting dead cells in mDA neurons at >day 48 of differentiation using the fluorescent dye SYTOX green (scale bar = 20 μm). q Quantification of the percentage of dead cells (**P < 0.005, one-way ANOVA). All values are plotted as ±s.e.m. All N numbers for each experiment can be found in Supplementary Table 5.
Fig. 7
Fig. 7. Functional consequences of SNCA mutations in human mDA neurons.
a The normalised basal mitochondrial footprint measurement plotted out in control, A53T, and SNCA x3 >day 62 old neurons (*P < 0.05, **P < 0.005, one-way ANOVA). b The normalised basal number of lysosomes per cell in controls, A53T and SNCA x3 >day 62 old neurons (*P < 0.05, **P < 0.005, one-way ANOVA). c The normalised percentage of cell death in control, A53T, and SNCA x3 >day 62 old neurons (**P < 0.005, ****P < 0.0001 one-way ANOVA). d Representative bright-field images showing >day 70 neurons patched for electrophysiological recordings. Scale bar = 20 μm. e Quantification of electrophysiological recordings showing the resting membrane potential in control and A53T neurons, and control and SNCA x3 neurons (**P = 0.0068, ***P = 0.0008, Welch’s t test). f Quantification of electrophysiological recordings showing the input resistance in control and A53T neurons, and control and SNCA x3 neurons (*P < 0.05, Welch’s t test). g Quantification of the threshold for AP generation in control and A53T neurons, and control and SNCA x3 neurons (*P < 0.05, ****P < 0.0001, Welch’s t test). h Quantification of the AP amplitude in control and A53T neurons, and control and SNCA x3 neurons (**P < 0.005, ****P < 0.0001, Welch’s t test). i Quantification of the AP repolarisation rate in control and A53T neurons, and control and SNCA x3 neurons (*P < 0.05, **P < 0.005, Welch’s t test). All values are plotted as ±s.e.m. All N numbers for each experiment can be found in Supplementary Table 5.
Fig. 8
Fig. 8. Cellular phenotypes sequentially appear in mDA neurons.
A schematic illustration showing temporal sequence of cellular phenotypes in the human PD model. The earliest abnormality is the accumulation of small aggregates with a specific beta-sheet conformation (at day 27 of differentiation). This is followed by another early phenotype which is impaired calcium signalling by day 34 of differentiation. When mDA neurons spend longer in culture, only after day 48, mitochondrial dysfunction, oxidative stress, and lysosomal dysfunction appear as late phenotypes, as well as, upregulated autophagy, impaired excitability and cell death.

References

    1. Poewe W, et al. Parkinson disease. Nat. Rev. Dis. Prim. 2017;3:17013. doi: 10.1038/nrdp.2017.13. - DOI - PubMed
    1. Kriks S, et al. Dopamine neurons derived from human ES cells efficiently engraft in animal models of Parkinson’s disease. Nature. 2011;480:547–551. doi: 10.1038/nature10648. - DOI - PMC - PubMed
    1. Kirkeby A, et al. Generation of regionally specified neural progenitors and functional neurons from human embryonic stem cells under defined conditions. Cell Rep. 2012;1:703–714. doi: 10.1016/j.celrep.2012.04.009. - DOI - PubMed
    1. Nolbrant S, Heuer A, Parmar M, Kirkeby A. Generation of high-purity human ventral midbrain dopaminergic progenitors for in vitro maturation and intracerebral transplantation. Nat. Protoc. 2017;12:1962–1979. doi: 10.1038/nprot.2017.078. - DOI - PubMed
    1. Doi D, et al. Isolation of human induced pluripotent stem cell-derived dopaminergic progenitors by cell sorting for successful transplantation. Stem Cell Rep. 2014;2:337–350. doi: 10.1016/j.stemcr.2014.01.013. - DOI - PMC - PubMed