. 2022 Nov 24;5(1):1285.
doi: 10.1038/s42003-022-04234-7.

Organ of Corti vibrations are dominated by longitudinal motion in vivo

Affiliations

Organ of Corti vibrations are dominated by longitudinal motion in vivo

Sebastiaan W F Meenderink et al. Commun Biol. .

Abstract

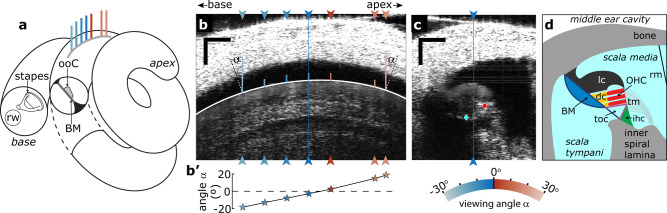
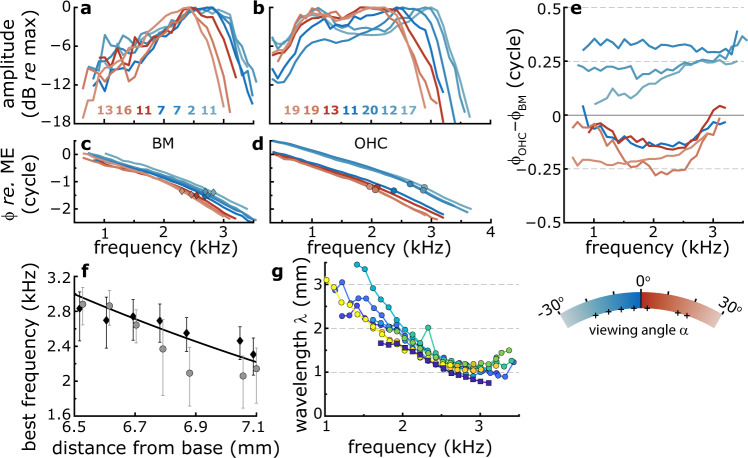
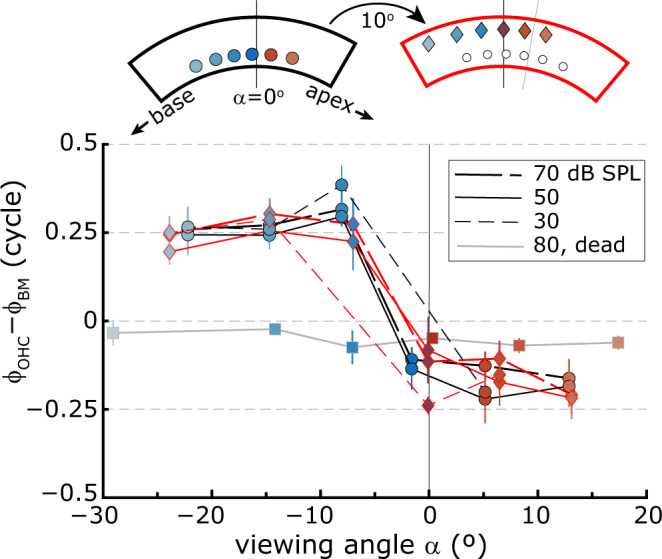
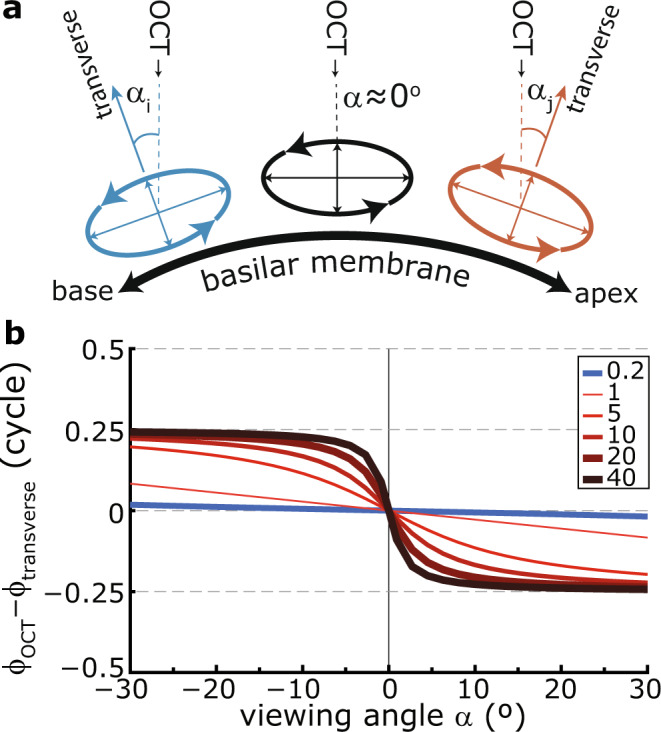
Recent observations of sound-evoked vibrations of the cochlea's sensory organ of Corti (ooC) using optical coherence tomography (OCT) have revealed unanticipated and complex motions. Interpreting these results in terms of the micromechanical inner-ear processes that precede hair-cell transduction is not trivial since OCT only measures a projection of the true motion, which may include transverse and longitudinal displacements. We measure ooC motions at multiple OCT beam angles relative to the longitudinal axis of the basilar membrane (BM) by using the cochlea's natural curvature and find that the relative phase between outer hair cells (OHC) and BM varies with this angle. This includes a relatively abrupt phase reversal where OHC lead (lag) the BM by ~0.25 cycles for negative (positive) beam angles, respectively. We interpret these results as evidence for significant longitudinal motion within the ooC, which should be considered when interpreting (relative) ooC vibrations in terms of inner-ear sound processing.


Conflict of interest statement

The authors declare no competing interests.

Figures

Fig. 1
Fig. 1. Different viewing angles in the 2nd turn of the cochlea.
a Schematic diagram of the spiral gerbil cochlea with a cross-sectional plane (orthogonal to the longitudinal axis) in the 2nd turn exposed to show the basilar membrane (BM) and the organ of Corti (ooC). The gray line represents the image location shown in b with colored lines indicating the different locations used for vibrometry. b Intensity image along the longitudinal axis in the 2nd turn of the gerbil cochlea. Arrowheads indicate longitudinal locations at which cross-sectional images and vibrometry were recorded. Scale bars, 0.1 mm. Solid white line: ellipse fitted to the boundary of the lateral compartment of the ooC. The angle between the normal of this ellipse and the vertical OCT beam at each longitudinal location at which a cross-sectional OCT image was acquired (arrow heads) served as an estimate for the “viewing angle α” between the OCT beam and the BM in the longitudinal direction. b’ Viewing angles α of the OCT beam at the longitudinal locations indicated in b. These angles are color coded, see arched color legend below c. The same color coding is used throughout the manuscript. Scale bars, 0.1 mm. c Example cross-sectional intensity image, orthogonal to the longitudinal axis, obtained at the location indicated by the blue line in b. Sound-evoked vibrations were recorded from the BM (blue diamond) and within the OHC region (red circle). The blue line locates the intersection with the longitudinal plane. View into the paper is along the longitudinal axis, towards cochlear apex. Scale bars, 0.1 mm. d Schematic of the anatomical structures for the cross section shown in c. Fluid-filled spaces within the cochlea are light blue. BM basilar membrane, dc Deiter’s cells, ihc inner hair cell region, lc lateral compartment, OHC outer hair cell region, ooC organ of Corti, toc tunnel of Corti, rm Reissner’s membrane, rw round window, tm tectorial membrane. The blue-red colored arch encoded viewing angle, the same scale is used throughout the manuscript.
Fig. 2
Fig. 2. Vibratory responses along the longitudinal axis of the cochlea.
Relative amplitude of (a) BM and (b) OHC vibratory frequency response curves (FRCs) measured at different longitudinal locations in the gerbil cochlea. Different colors correspond to the color coding for recording location in Fig. 1b. Color-coded amplitudes (dB re. 1 nm) at BF are given in the keys. c, d Corresponding phase data, normalized to the middle-ear (ME) response. Diamonds and circles indicate best frequency (BF). e Phase difference between the responses in the OHC region and on the BM at each longitudinal recording location. f BF for the BM (black diamonds) and the OHC region (gray circles) determined from the FRC amplitude curves in a and b. Error bars give FRC-bandwidth at 1-dB below the BF response. The black line is a fit of the gerbil place-frequency map to the BM-BFs. This fit was used to set the values along the abscissa. Stimulus level: 30 dB SPL per frequency component. g Wavelength of the TW. Here, each color represents a separate set of recordings that were obtained from n = 6 animals. We did not observe a dependence of wavelength on stimulus intensity. The square, darkest-blue symbols are from the phase data in c. The lines in ae are color coded according to viewing angle α (see Fig. 1b’) with the key below e. Small plus-symbols in the key indicate the viewing angles for these recordings.
Fig. 3
Fig. 3. Viewing angle determines the phase difference between OHC and BM.
The different curves show ϕOHC–ϕBM, averaged across frequency, as a function of viewing angle α (see Fig. 1b’) for different series of recordings. These were from n = 6 gerbils and were obtained at stimulus intensities between 30 and 70 dB SPL. Small colored circles give individual data points, error bars give ±1 s.d. around the mean. The square, darkest-blue symbols are for the recordings in Fig. 2.
Fig. 4
Fig. 4. Viewing angle, not longitudinal location, determines ϕOHC–ϕBM.
OHC–BM phase difference, averaged across frequency, as a function of viewing angle α relative to the longitudinal axis of the BM (see Fig. 1b) for two series of recordings from the same animal, obtained at three different stimulus intensities (see legend). Vertical error bars give ±1 s.d. around the mean. After the acquisition of the first series (black lines, circles), the animal was rotated 10° around the modiolar axis such that a more basal region of the cochlea was visualized and a second series of recordings was obtained (red lines, diamonds). The cartoon at the top represents this rotation, with the viewing angles at the recording locations color coded according to the key in Fig. 1. Square symbols/gray lines are for data acquired postmortem in the same animal.
Fig. 5
Fig. 5. Effect of viewing angle on the relative phase ϕOCT – ϕtransverse.
a Due to the natural curvature of the cochlea/BM in the longitudinal direction (thick black line), a vertical OCT measurement beam (dashed lines) will view the elliptical motion in the OHC region at an angle (α) that varies with longitudinal location within the cochlea (different colors). b Expected phase difference ϕOCT – ϕtransverse for elliptical motion (see text) with different aspect ratio, here, amplitude ratio of longitudinal and the orthogonal vibrations (see legend). For ratios >1 (i.e., a larger longitudinal component, red lines), the phase difference systematically varies between +0.25 and –0.25 cycles. The 0.5-cycle transition occurs more abruptly for larger amplitude ratios. When the orthogonal motion is larger (ratio <1, blue line), only a small phase difference occurs for the depicted viewing angles. Irrespective of amplitude ratio, the phase difference flips sign when α = 0°.

References

    1. Yost, W. A. Fundamentals of hearing: an introduction (Holt Rinehart and Winston, 1985).
    1. Slepecky, N. B. Structure of the mammalian cochlea. In The Cochlea (eds. Dallos, P., Popper, A. N. & Fay, R. R.) vol. 8 44–129 (Springer, 1996).
    1. Robles L, Ruggero MA. Mechanics of the mammalian cochlea. Physiol. Rev. 2001;81:1305–1352. doi: 10.1152/physrev.2001.81.3.1305. - DOI - PMC - PubMed
    1. von Békésy, G. Experiments in hearing. (McGraw-Hill, 1960).
    1. Choudhury N, et al. Low coherence interferometry of the cochlear partition. Hear. Res. 2006;220:1–9. doi: 10.1016/j.heares.2006.06.006. - DOI - PubMed

Publication types

MeSH terms