. 2023 Apr;41(4):500-512.
doi: 10.1038/s41587-022-01527-4. Epub 2022 Nov 24.

Drag-and-drop genome insertion of large sequences without double-strand DNA cleavage using CRISPR-directed integrases

Affiliations

Drag-and-drop genome insertion of large sequences without double-strand DNA cleavage using CRISPR-directed integrases

Matthew T N Yarnall et al. Nat Biotechnol. 2023 Apr.

Abstract

Programmable genome integration of large, diverse DNA cargo without DNA repair of exposed DNA double-strand breaks remains an unsolved challenge in genome editing. We present programmable addition via site-specific targeting elements (PASTE), which uses a CRISPR-Cas9 nickase fused to both a reverse transcriptase and serine integrase for targeted genomic recruitment and integration of desired payloads. We demonstrate integration of sequences as large as ~36 kilobases at multiple genomic loci across three human cell lines, primary T cells and non-dividing primary human hepatocytes. To augment PASTE, we discovered 25,614 serine integrases and cognate attachment sites from metagenomes and engineered orthologs with higher activity and shorter recognition sequences for efficient programmable integration. PASTE has editing efficiencies similar to or exceeding those of homology-directed repair and non-homologous end joining-based methods, with activity in non-dividing cells and in vivo with fewer detectable off-target events. PASTE expands the capabilities of genome editing by allowing large, multiplexed gene insertion without reliance on DNA repair pathways.


Conflict of interest statement

Competing interests: O.O.A. and J.S.G. are co-inventors on patent applications filed by MIT relating to work in this manuscript. O.O.A. and J.S.G. are co-founders of Sherlock Biosciences, Proof Diagnostics, Moment Biosciences, and Tome Biosciences. O.O.A. and J.S.G. were advisors for Beam Therapeutics during the course of this project. K.H., J.A.W, A.P.K, and A.E.Z. are employees and shareholders of Synthego. S.K.D., Y.M., and D.R.R. are employees of PhoenixBio. L.F. and G.B. are employees of Yecuris Corporation. N.R., L.Z., and C.A.V. are employees of Integrated DNA Technologies. The remaining authors declare no competing interest.

Figures

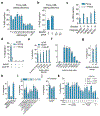
Extended Data Figure 1:
Extended Data Figure 1:. Evaluation of prime integration activity for diverse AttB sequences and optimization of PASTE editing through dosage and mutagenesis.
a) Prime editing efficiency for the insertion of different length BxbINT AttB sites at ACTB. Data are mean (n = 2 or 3) ± s.e.m. b) Prime editing efficiency for this insertion of a BxbINT AttB site at ACTB with targeting and non-targeting guides. Data are mean (n= 3) ± s.e.m. c) Prime editing efficiency for the insertion of different integrases’ AttB sites at ACTB. Both orientations of landing sites are profiled (F, forward; R, reverse). Data are mean (n= 3) ± s.e.m. d) PASTE editing efficiency for the insertion of EGFP at ACTB with and without a nicking guide. Data are mean (n= 3) ± s.e.m. e) PASTE integration efficiency of EGFP at ACTB measured with different doses of a single-vector delivery of components. Data are mean (n = 2 or 3) ± s.e.m. f) PASTE integration efficiency of EGFP at ACTB measured with different ratios of a single-vector delivery of components to the EGFP template vector. Data are mean (n= 3) ± s.e.m. g) PASTE efficiency at the ACTB target compared between atgRNAs containing either the v1 or v2 scaffold designs. Data are mean (n= 3) ± s.e.m. h) PASTE integration efficiency of EGFP at ACTB with different RT domain fusions. Data are mean (n = 2 or 3) ± s.e.m. i) PASTE integration efficiency of EGFP at ACTB with different RT domain fusions and linkers. Data are mean (n = 2 or 3) ± s.e.m. j) PASTE integration efficiency of EGFP at ACTB with mutant RT domains. Data are mean (n= 3) ± s.e.m. k) Optimization of PASTE constructs with a panel of linkers and RT modifications for Gluc integration at the ACTB locus using atgRNAs with the v2 scaffold. Data are mean (n= 3) ± s.e.m.
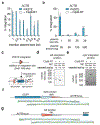
Extended Data Figure 2:
Extended Data Figure 2:. Characterization of PASTE payload sizes and integration junctions.
a) PASTE integration efficiency at the ACTB locus of varying sized cargos transfected at a fixed DNA amount and variable molar ratio. b) PASTE integration efficiency at the ACTB locus of varying sized cargos transfected at a variable DNA amounts. c) Schematic of PASTE integration, including resulting AttR and AttL sites that are generated and PCR primers for assaying the integration junctions. d) PCR and gel electrophoresis readout of left integration junction from PASTE insertion of GFP at the ACTB locus. Insertion is analyzed for in-frame and out-of-frame GFP integration experiments as well as for a no prime control. Expected sizes of the PCR fragments are shown using the primers shown in the schematic in subpanel A. e) PCR and gel electrophoresis readout of right integration junction from PASTE insertion of GFP at the ACTB locus. Insertion is analyzed for in-frame and out-of-frame GFP integration experiments as well as for a no prime control. Expected sizes of the PCR fragments are shown using the primers shown in the schematic in subpanel A. f) Sanger sequencing shown for the right integration junction for an in-frame fusion of GFP via PASTE to the N-terminus of ACTB. g) Sanger sequencing shown for the left integration junction for an in-frame fusion of GFP via PASTE to the N-terminus of ACTB. Data are mean (n= 3) ± s.e.m.
Extended Data Figure 3:
Extended Data Figure 3:. Validation of design rules for efficient PASTE insertion at endogenous genomic loci.
a) Schematic of various parameters that affect PASTE integration of ~1 kb GFP insert. On the atgRNA, the PBS, RT, and AttB lengths can alter the efficiency of AttB insertion. Nicking guide selection also affects overall gene integration efficiency. b) The impact of PBS and RT length on PASTE integration of GFP at the ACTB locus. c) The impact of PBS and RT length on PASTE integration of GFP at the LMNB1 locus. d) The impact of AttB length on PASTE integration of GFP at the ACTB locus. e) The impact of AttB length on PASTE integration of GFP at the LMNB1 locus. f) The impact of AttB length on PASTE integration of GFP at the NOLC1 locus. g) The impact of minimal PBS, RT, and AttB lengths on PASTE integration efficiency of GFP at the ACTB locus. h) The impact of minimal PBS, RT, and AttB lengths on PASTE integration efficiency of GFP at the LMNB1 locus. i) PASTE integration efficiency of EGFP at varying endogenous loci. Data are mean (n= 3) ± s.e.m.
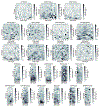
Extended Data Figure 4:
Extended Data Figure 4:. Heatmaps depicting the effect of PBS, RT, and AttB lengths on atgRNA efficiency of attachment site insertion from high-throughput pooled screening of 10,580 guides targeting a variety of loci.
Bar charts indicating normalized summation across relevant PBS, RT, or AttB parameter axes are shown on heatmap sides.
Extended Data Figure 5:
Extended Data Figure 5:. Effect of nicking guides on insertion of diverse cargos.
a) PASTE insertion efficiency at ACTB and LMNB1 loci with two different nicking guide designs. b) Attachment site insertion at the SERPINA1 locus with a panel of different nicking guides at varying distances. c) Effect of nicking guides on PASTE integration efficiency at the LMNB1 locus with two different atgRNA designs. d) PASTE integration efficiency at ACTB and LMNB1 with target and non-targeting spacers and matched atgRNAs with and without BxbINT expression. e) Integration of a panel of different gene cargo at LMNB1 locus via PASTE. Data are mean (n= 3) ± s.e.m.
Extended Data Figure 6:
Extended Data Figure 6:. Further characterization of PASTE specificity and effects on cellular transcriptome.
a) Comparison of indel rates generated by PASTE and HITI mediated insertion of EGFP at the ACTB and LMNB1 loci in HepG2 cells. b) Effect of AttB site integration on protein production. Samples treated with either ACTB, LMNB1 non-targeting guides were harvest and analyzed for protein expression by Western blot. Quantified band intensities relative to GAPDH controls are shown below samples. c) GFP integration activity at predicted BxbINT and PASTE ACTB Cas9 guide off-target sites in the human genome. d) GFP integration activity at predicted HITI ACTB Cas9 guide off-target sites. e) Validation of ddPCR assays for detecting editing at predicted BxbINT off-target sites using synthetic amplicons. f) Validation of ddPCR assays for detecting editing at predicted PASTE ACTB Cas9 guide off-target sites using synthetic amplicons. g) Validation of ddPCR assays for detecting editing at predicted HITI ACTB Cas9 guide off-target sites using synthetic amplicons. h) Analysis of on-target and off-target integration events across 3 single-cell clones for PASTE and 3 single-cell clones for no prime condition. i) Volcano plots depicting the fold expression change of sequenced mRNAs versus significance (p-value). Each dot represents a unique mRNA transcript and significant transcripts are shaded according to either upregulation (red) or downregulation (blue). Fold expression change is measured against ACTB-targeting guide-only expression (including cargo). Significance is determined by moderated t-statistic adjusted for a log-fold cut off of 0.585. j) Top significantly upregulated and downregulated genes for BxbINT-only conditions. Genes are shown with their corresponding Z-scores of counts per million (cpm) for BxbINT only expression, GFP-only expression, PASTE targeting ACTB for EGFP insertion, Prime targeting ACTB for EGFP expression without BxbINT, and guide/cargo only. Data are mean (n= 3) ± s.e.m.
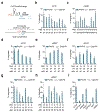
Extended Data Figure 7:
Extended Data Figure 7:. Additional characterization of AttP mutants for improved editing and multiplexing.
a) Integration efficiencies of wildtype and mutant AttP sites with PASTE at the ACTB locus. b) AttP single mutants are characterized for PASTE EGFP integration at the ACTB locus. c) Relative enrichment values (calculated as ratio of integrated reads to total reads) for the wildtype Bxb1 and top 5 mutants from the mutagenesis screen d) Comparison of integration efficiency between PASTEv3 and Twin-PE integration at the ACTB locus, with both single atgRNA (46 bp) or dual atgRNA with PASTE-Replace (38 bp). e) Comparison of integration efficiency and residual AttB formation between PASTEv3 with PASTE-Replace and Twin-PE integration at the NOLC1 locus with dual atgRNAs containing either a 46 bp or 42 bp AttB sequence. f) Comparison of integration efficiency and residual AttB formation between PASTEv3 with PASTE-Replace and Twin-PE integration at the CCR5 locus with dual atgRNAs containing a 38 bp AttB sequence. g) Comparison of residual AttB formation between PASTEv3 with PASTE-Replace and Twin-PE integration at the ACTB locus. h) Characterization of integration of a 5 kb payload at the ACTB locus with all 16 possible dinucleotides for AttB/AttP pairs between the atgRNA and minicircle. i) Schematic of the pooled AttB/AttP dinucleotide orthogonality assay. Each AttB dinucleotide sequence is co-transfected with a barcoded pool of all 16 AttP dinucleotide sequences and BxbINT, and relative integration efficiencies are determined by next generation sequencing of barcodes. All 16 AttB dinucleotides are profiled in an arrayed format with AttP pools. j) Relative insertion preferences for all possible AttB/AttP dinucleotide pairs determined by the pooled orthogonality assay. k) Orthogonality of BxbINT dinucleotides as measured by a pooled reporter assay. Each web logo motif shows the relative integration of different AttP sequences in a pool at a denoted AttB sequence with the listed dinucleotide. l) Representative fluorescence images of multiplexed PASTE gene tagging of ACTB, LMNB1, and NOLC1. Data are mean (n= 3) ± s.e.m.
Extended Data Figure 8:
Extended Data Figure 8:. Therapeutic applications of PASTE and further characterization of integrases.
a) Schematic of protein production assay for PASTE-integrated transgene. SERPINA1 and CPS1 transgenes are tagged with HIBIT luciferase for readout with both ddPCR and luminescence. b) Integration efficiency of SERPINA1 and CPS1 transgenes in HEK293FT cells at the ACTB locus. c) Integration efficiency of SERPINA1 and CPS1 transgenes in HepG2 cells at the ACTB locus. d) Intracellular levels of SERPINA1-HIBIT and CPS1-HIBIT in HepG2 cells. e) Secreted levels of SERPINA1-HIBIT and CPS1-HIBIT in HepG2 cells. f) Integration of SERPINA1 and CPS1 genes that are HIBIT tagged as measured by a protein expression luciferase assay. g) Integration of SERPINA1 and CPS1 genes that are HIBIT tagged as measured by a protein expression luciferase assay normalized to a standardized HIBIT ladder, enabling accurate quantification of protein levels. h) PASTE integration activity with most active integrases compared to BxbINT. i) Characterization of integrase activity on truncated attachment sites using integrase reporters in HEK293FT cells. j) PASTE integration activity with computationally selected integrases with shorter AttB sites. Data are mean (n= 3) ± s.e.m.
Extended Data Figure 9:
Extended Data Figure 9:. Evaluation of viral templates for PASTE and characterization of editing in non-dividing cells.
a) Schematic of PASTE performance in the presence of cell cycle inhibition. Cells are transfected with plasmids for insertion with PASTE or Cas9-induced HDR and treated with aphidicolin to arrest cell division. Efficiency of PASTE and HDR are read out with ddPCR or amplicon sequencing, respectively. b) Editing efficiency of single mutations by HDR at EMX1 locus with two Cas9 guides in the presence or absence of cell division read out with amplicon sequencing. Data are mean (n= 3) ± s.e.m. c) HDR mediated editing of the EMX1 locus is significantly diminished in non-dividing HEK293FT cells blocked by 5 μM aphidicolin treatment. Data are mean (n= 3) ± s.e.m. d) Integration efficiency of various sized GFP inserts up to 13.3 kb at the ACTB locus with PASTE in the presence or absence of cell division. Data are mean (n= 3) ± s.e.m. e) Effect of insert minicircle DNA amount on PASTE-mediated insertion at the ACTB locus in dividing and non-dividing HEK293FT cells blocked by 5 μM aphidicolin treatment. Data are mean (n= 3) ± s.e.m. f) PASTE efficiency of EGFP integration at the ACTB locus in K562 cells. Data are mean (n= 3) ± s.e.m. g) Insertion templates delivered via AAV transduction. Templates were co-delivered via AAV dosing at levels indicated. Data are mean (n= 3) ± s.e.m. h) PASTE integration of GFP at the ACTB locus with the GFP template delivered via AAV in HEK293FT cells. i) PASTE integration of GFP at the ACTB locus with the GFP template delivered via AAV at different doses in HEK293FT cells. Data are mean (n= 3) ± s.e.m. j) Integration efficiency of AdV delivery of integrase, guides, and cargo in HEK293FT and HepG2 cells. BxbINT and guide RNAs or cargo were delivered either via plasmid transfection (Pl), AdV transduction (AdV), or omitted (−). SpCas9-RT was only delivered as plasmid or omitted. Data are mean (n= 3) ± s.e.m. k) Delivery of PASTE system components with mRNA and synthetic guides, paired with either AdV or plasmid cargo. Data are mean (n= 3) ± s.e.m. l) Attachment site insertion efficiency at the LMNB1 locus using PASTE delivered as mRNA with synthetic atgRNA and nicking guides. Data are mean (n= 3) ± s.e.m. m) Integration efficiency at the LMNB1 locus using PASTE delivered as mRNA (Trilink versions), synthetic atgRNA and nicking guides, and adenoviral delivered EGFP cargo. All conditions contain full length PASTE mRNA and are optionally supplemented with additional Bxb1 mRNA as indicated. Data are mean (n = 2) ± s.e.m.
Extended Data Figure 10:
Extended Data Figure 10:. Additional characterization of in vivo liver editing with PASTE.
a) PASTE integration using delivery of circular mRNA with synthetic guides and either AdV or plasmid cargo. Data are mean (n= 3) ± s.e.m. b) PASTE integration of GFP at the ACTB locus with dose titration of PASTE components and GFP cargo delivered as AdV in HepG2 cells. Data are mean (n= 3) ± s.e.m. c) Evaluation of a 3-primer NGS assay for measuring integration efficiency, akin to junctional readouts by ddPCR. Using amplicon standards mixed at predefined ratios (x-axis), we can ascertain the accuracy of the measured editing (y-axis) by NGS. d) Analysis of primary human hepatocyte (PXB-cells®) EGFP integration at the ACTB locus using adenoviral delivery for PASTEv1 and guides and AAV for the EGFP template. Viral doses are as indicated. Shown is mean ± s.e.m with n = 2. e) Analysis of all liver editing outcomes for adenoviral EGFP template integration at the ACTB locus using PASTE in vivo. f) Analysis of AttB site insertion efficiency at the ACTB locus using PASTE in vivo. Data are mean (n = 8). g) Analysis of adenoviral EGFP template integration efficiency into available AttB sites at the ACTB locus using PASTE in vivo. Data are mean (n = 8). h) Analysis of indel frequency at the ACTB locus using PASTE in vivo. Data are mean (n = 8). i) Analysis of AttB-site associated indels during in vivo integration with PASTE via alignment of representative reads to the ACTB locus containing the desired AttB site.
Figure 1:
Figure 1:. PASTE editing allows for programmable gene insertion independent of DNA repair pathways.
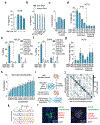
a) Schematic of programmable gene insertion with PASTE. The PASTE system involves insertion of landing sites via Cas9-directed reverse transcriptases, followed by landing site recognition and integration of cargo via Cas9-directed integrases. b) Schematic of PASTE insertion at the ACTB locus, showing guide and target sequences. c) Comparison of GFP cargo integration efficiency between BxbINT and Cre recombinase at the 5’ end of the ACTB locus. d) Comparison of PASTE integration efficiency of GFP with a panel of integrases targeting the 5’ end of the ACTB locus. Both orientations of landing sites are profiled (F, forward; R, reverse). e) Optimization of PASTE constructs with a panel of linkers and RT modifications for EGFP integration at the ACTB and LMNB1 loci with different payloads. f) Gel electrophoresis showing complete insertion by PASTE for multiple cargo sizes. g) Effect of cargo size on PASTEv3 insertion efficiency at the endogenous ACTB and LMNB1 targets. Cargos were transfected with fixed molar amounts. h) PASTEv3 insertion of 36 kb cargo template at the ACTB locus. Data are mean (n= 3) ± s.e.m.
Figure 2:
Figure 2:. Evaluating design rules for efficient PASTE insertion at endogenous genomic loci.
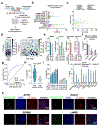
a) Schematic of pooled oligo library design for high-throughput screening of atgRNA designs at endogenous gene targets. b) Box plots depicting the editing rates of AttB addition at the different endogenous targets across 10,580 different atgRNA designs. Box indicates between 25th and 75th percentiles, whiskers indicate 1.5 times interquartile-range. Center line indicates the 50th percentile. c) Scatter plot depicting AttB site insertion rates versus significance of the editing (−log(p-value)) as measured by a Student’s two-tailed t-test against a no Cas9-RT control. d) Heatmaps depicting percent AttB site insertion for LMNB1 guide 1 across different RT, PBS, and AttB lengths. Bar charts indicating normalized summation across relevant PBS, RT, or AttB parameter axes are shown on heatmap sides. e) Top atgRNA hits from the screen are compared for AttB site insertion against manually designed atgRNAs (grey bars). f) PASTEv3 efficiency for insertion of an EGFP cargo at different endogenous targets is compared between screen validated atgRNAs and manually designed atgRNAs. g) Accuracy results by 5-fold cross validation of a MLP classifier trained on data from the 10,580 atgRNAs. h) PASTE integration rates of previously evaluated atgRNAs predicted by the MLP classifier to be efficient (pos. guides) or not efficient (neg. guides). i) PASTE integration rates of top atgRNAs predicted to be efficient (dark pink) or not efficient (light pink) by the MLP classifier. Solid line indicates median, dotted lines indicate 25th and 75th percentiles. j) PASTE integration rates and indel formation for integration of ten therapeutically relevant payloads at the ACTB locus. k) Endogenous protein tagging with GFP via PASTE by in-frame endogenous gene tagging at four loci (ACTB, SRRM2, NOLC1, and LMNB1). Immunofluorescence images of representative cells are shown. Cells have nuclear DAPI staining and antibody staining of the labeled proteins to show correlation to the endogenous PASTE tagging signal. Data are mean (n= 3) ± s.e.m.
Figure 3:
Figure 3:. Characterization of genome-wide PASTE specificity and purity of integration compared to other integration approaches.
a) Schematic of PASTE, homology-independent targeted integration (HITI), and homology-directed repair (HDR) gene integration approaches. b) Integration of a GFP template by PASTE at the ACTB and LMNB1 loci compared to HITI at the same target. Quantification is by ddPCR. Integration efficiency is compared to the rate of byproduct indel generation. c) GFP integration efficiency at a panel of genomic loci by PASTE compared to insertion rates HITI. d) Integration of a GFP template by PASTE at the ACTB and LMNB1 loci compared to HDR at the same target. Quantification is by single-cell clone counting, since HDR homology preclude use of ddPCR. Integration efficiency is compared to the rate of byproduct indel generation. e) Analysis of all possible editing outcomes for PASTEv3 at the ACTB and LMNB1 sites. f) Schematic of next-generation sequencing method to assay genome-wide off-target integration sites by PASTE and HITI. g) Alignment of reads at the on-target ACTB site using our unbiased genome-wide integration assay, showing expected on-target PASTE integration outcomes. h) Manhattan plot of averaged integration events for multiple single-cell clones with PASTE editing. The on-target site is at the ACTB gene on chromosome 7 (labeled). Number of off-targets with greater than 0.1% integration is shown. i) Manhattan plot of averaged integration events for multiple single-cell clones with HITI editing. The on-target site is at the ACTB gene on chromosome 7 (labeled). Number of off-targets with greater than 0.1% integration is shown. Data are mean (n= 3) ± s.e.m.
Figure 4:
Figure 4:. Multiplexed and orthogonal gene insertion with PASTE.
a) Schematic for AttP mutagenesis screen for identifying AttP mutants that promote higher integration efficiencies with PASTE. b) Evaluation of two AttP variants from the pooled screen for PASTE integration activity at the ACTB and LMNB1 loci. c) AttB site replacement efficiency with the PASTE-Replace system at the LMNB1 locus. d) EGFP gene replacement efficiency with the PASTE-Replace system at the LMNB1 locus using payloads with either AttP mutant 1 or WT AttP. e) Schematic of multiplexed integration of different cargo sets at specific genomic loci. Three fluorescent cargos (GFP, mCherry, and YFP) are inserted orthogonally at three different loci (ACTB, LMNB1, NOLC1) for in-frame gene tagging. f) Orthogonality of top 4 AttB/AttP dinucleotide pairs evaluated for GFP integration with PASTE at the ACTB locus. g) Efficiency of multiplexed PASTE insertion of combinations of fluorophores at ACTB, LMNB1, and NOLC1 loci. Data are mean (n= 3) ± s.e.m.
Figure 5:
Figure 5:. Discovery of phage-derived integrases for programmable gene integration with PASTE.
a) Schematic of integrase discovery pipeline from bacterial and metagenomic sequences. b) Phylogenetic tree of discovered integrases showing distinct subfamilies. Synthesized orthologs are shown as orange dots. c) Domain architecture of the five integrase sub-families. RES, resolvase (cd00338); REC, recombinase (PF07508); ZR, zinc ribbon (PF13408); DF, unknown domain (DUF4368), SMRES, resolvase (smart00857). d) Screening integrase integration activity using reporters in HEK293FT cells compared to BxbINT and phiC31. e) PASTE integration activity with BceINT and BcyINT with truncated attachment sites compared to BxbINT. f) PASTE integration activity with SscINT and SacINT with truncated attachment sites compared to BxbINT. g) Integration of EGFP at different endogenous gene targets for PASTE with either BceINT or BxbINT. Data are mean (n= 3) ± s.e.m.
Figure 6:
Figure 6:. PASTE is compatible with multiple delivery approaches and can be delivered to primary cell types and in vivo animal models.
a) PASTE integration efficiency with single vector designs in primary human T cells. Data are mean (n= 3) ± s.e.m. b) PASTE integration efficiency with single vector designs in primary human hepatocytes. Data are mean (n= 3) ± s.e.m. c) Schematic of the adenoviral constructs used to deliver PASTE and the EGFP payload template. d) AdV delivery of all PASTE components in HEK293FT and HepG2 cells. Data are mean (n= 3) ± s.e.m. e) Integration efficiency of AdV delivery of integrase, guides, and cargo in primary human hepatocytes (PXB-cells®). Viral components were listed at dosages indicated. (n= 1). f) Adenoviral EGFP template integration efficiency at the human ACTB locus in the liver of a liver-humanized mouse model using adenovirally delivered PASTE. Integration efficiency is measured 4 weeks post-injection. For integration conditions, points represent different regions of the liver analyzed for editing. At the top is shown a schematic for in vivo targeted gene integration with PASTE via retroorbital injection. Data are mean (n = 8).

Comment in

References

    1. Hsu PD, Lander ES & Zhang F Development and applications of CRISPR-Cas9 for genome engineering. Cell 157, 1262–1278 (2014). - PMC - PubMed
    1. Anzalone AV, Koblan LW & Liu DR Genome editing with CRISPR-Cas nucleases, base editors, transposases and prime editors. Nat. Biotechnol 38, 824–844 (2020). - PubMed
    1. Wright AV, Nuñez JK & Doudna JA Biology and Applications of CRISPR Systems: Harnessing Nature’s Toolbox for Genome Engineering. Cell 164, 29–44 (2016). - PubMed
    1. Nami F et al. Strategies for In Vivo Genome Editing in Nondividing Cells. Trends Biotechnol. 36, 770–786 (2018). - PubMed
    1. Suzuki K et al. In vivo genome editing via CRISPR/Cas9 mediated homology-independent targeted integration. Nature 540, 144–149 (2016). - PMC - PubMed

Publication types