Temporal and spatial characteristics of tumor evolution in a mouse model of oral squamous cell carcinoma
- PMID: 36424557
- PMCID: PMC9694863
- DOI: 10.1186/s12885-022-10256-5
Temporal and spatial characteristics of tumor evolution in a mouse model of oral squamous cell carcinoma
Abstract
Objectives: We aimed to elucidate the temporal and spatial characteristics of tumor evolution in an oral squamous cell carcinoma (OSCC) mouse model with higher burden of lymphatic metastasis through high-throughput sequencing.
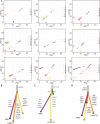
Methods: The OSCC model was established in 9 mice. DNA was extracted from the tumors of primary tongue lesions and disseminated tumor cells (DTCs) of submandibular gland lymph nodes and bone marrow, and then whole genome sequencing was performed. After bioinformatics analysis, somatic single-nucleotide variants (SSNVs) and copy number variations (CNVs) data were obtained. Based on SSNVs, clonal architecture and ancestor-descendant relationships among tumor cell subclones were elucidated.
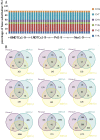
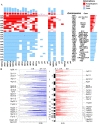
Results: A total of 238 tumor-related SSNVs with 120 high-frequency mutated genes were obtained from 36 samples of 9 mice by whole-genome sequencing. The number of unique SSNVs in the primary lesion, submandibular lymph node and bone marrow was greater than the number of shared SSNVs. Furthermore, the primary lesion-originated subclones, which were identified by SSNVs, were also detected in submandibular lymph nodes in the early stage of oral carcinogenesis. Moreover, at different histopathological stages, unique subclones were also identified in DTCs isolated from lymph nodes.
Conclusion: Tumor heterogeneity is significant in primary tumor cells and disseminated tumor cells. OSCC cells probably disseminate to lymph nodes in the early stage of oral carcinogenesis. OSCC is characterized by polyclonal dissemination, and the evolutionary trajectory of DTCs is potentially dominated by the tumor microenvironment.
Keywords: Disseminated tumor cells (DTCs); Genetic heterogeneity; Oral squamous cell carcinoma (OSCC); Tumor evolution; Tumor microenvironment; Whole genome sequencing.
© 2022. The Author(s).
Conflict of interest statement
The authors declare that they have no known competing financial interests or personal relationships that could have appeared to influence the work reported in this paper.
Figures


Similar articles
-
Mesenchymal-epithelial transition in lymph node metastases of oral squamous cell carcinoma is accompanied by ZEB1 expression.J Transl Med. 2023 Apr 19;21(1):267. doi: 10.1186/s12967-023-04102-w. J Transl Med. 2023. PMID: 37076857 Free PMC article.
-
Early discovery of disseminated tumor cells during carcinogenesis in a 4NQO-induced mouse model of oral squamous cell carcinoma.Int J Clin Exp Pathol. 2018 Jul 1;11(7):3328-3337. eCollection 2018. Int J Clin Exp Pathol. 2018. PMID: 31949709 Free PMC article.
-
Comparing Genomic Landscapes of Oral and Cutaneous Squamous Cell Carcinoma of the Head and Neck: Quest for Novel Diagnostic Markers.Mod Pathol. 2023 Aug;36(8):100190. doi: 10.1016/j.modpat.2023.100190. Epub 2023 Apr 18. Mod Pathol. 2023. PMID: 37080394
-
Oral squamous cell carcinoma: Insights into cellular heterogeneity, drug resistance, and evolutionary trajectories.Cell Biol Toxicol. 2025 Jun 12;41(1):101. doi: 10.1007/s10565-025-10048-0. Cell Biol Toxicol. 2025. PMID: 40504271 Free PMC article. Review.
-
Extranodal extension in oral cancer: A role for the nodal microenvironment?J Oral Pathol Med. 2019 Nov;48(10):863-870. doi: 10.1111/jop.12870. Epub 2019 May 21. J Oral Pathol Med. 2019. PMID: 31087397 Review.
Cited by
-
Genomic and Transcriptomic Landscape of an Oral Squamous Cell Carcinoma Mouse Model for Immunotherapy.Cancer Immunol Res. 2023 Nov 1;11(11):1553-1567. doi: 10.1158/2326-6066.CIR-23-0133. Cancer Immunol Res. 2023. PMID: 37669022 Free PMC article.
-
Single-Cell Molecular Profiling of Head and Neck Squamous Cell Carcinoma Reveals Five Dysregulated Signaling Pathways Associated With Circulating Tumor Cells.Cancer Control. 2024 Jan-Dec;31:10732748241251571. doi: 10.1177/10732748241251571. Cancer Control. 2024. PMID: 38869038 Free PMC article.
-
Unravelling the heterogeneity of oral squamous cell carcinoma by integrative analysis of single-cell and bulk transcriptome data.J Cell Mol Med. 2024 Feb;28(3):e18108. doi: 10.1111/jcmm.18108. Epub 2024 Jan 26. J Cell Mol Med. 2024. PMID: 38279519 Free PMC article.
References
MeSH terms
LinkOut - more resources
Full Text Sources
Medical

