. 2022 Nov;1(11):1084-1100.
doi: 10.1038/s44161-022-00162-1. Epub 2022 Nov 11.

Generation and Comparative Analysis of an Itga8-CreER T2 Mouse with Preferential Activity in Vascular Smooth Muscle Cells

Affiliations

Generation and Comparative Analysis of an Itga8-CreER T2 Mouse with Preferential Activity in Vascular Smooth Muscle Cells

Ganesh Warthi et al. Nat Cardiovasc Res. 2022 Nov.

Erratum in

Abstract

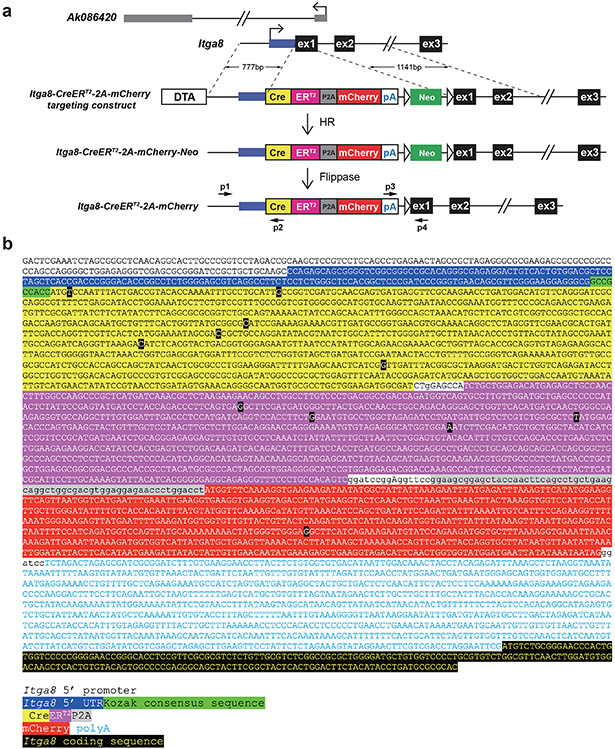
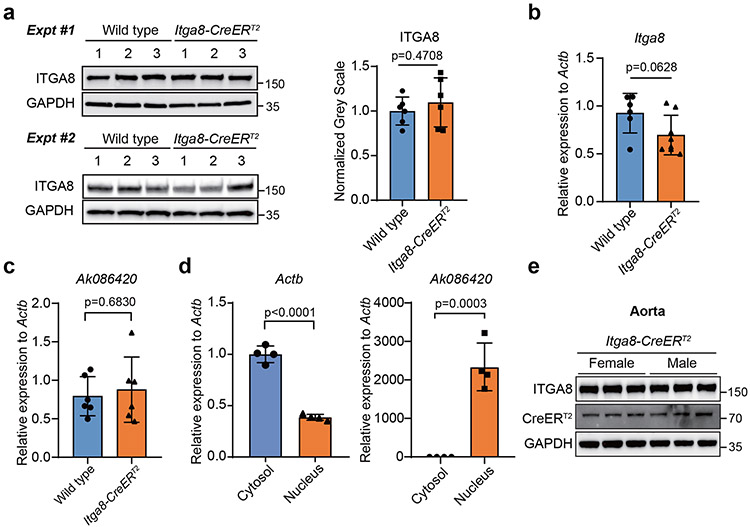
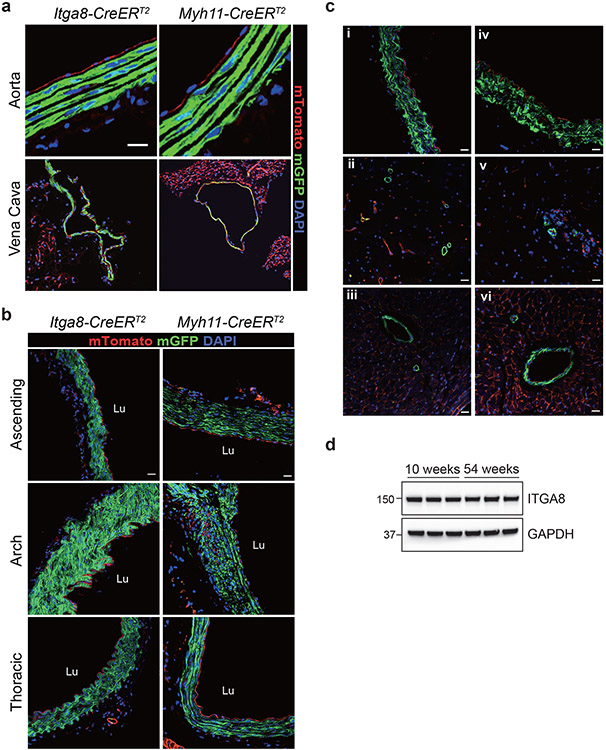
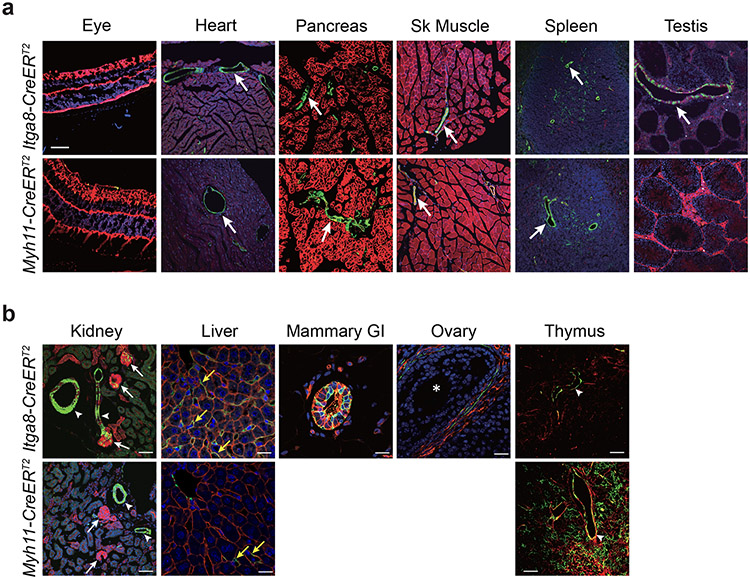
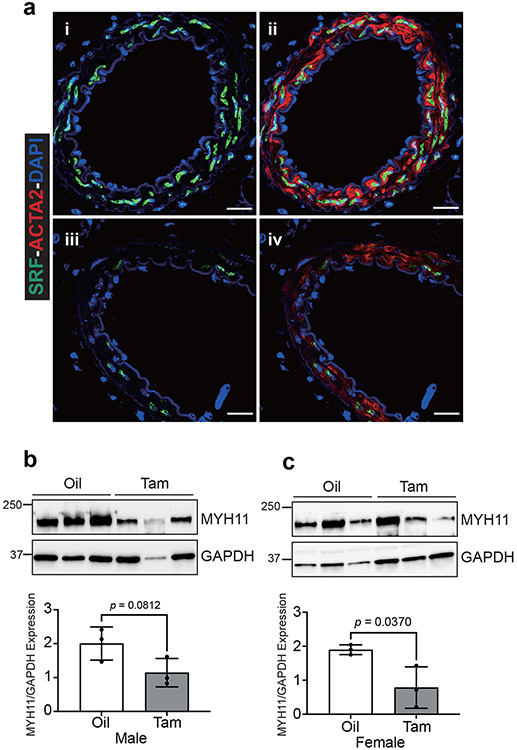
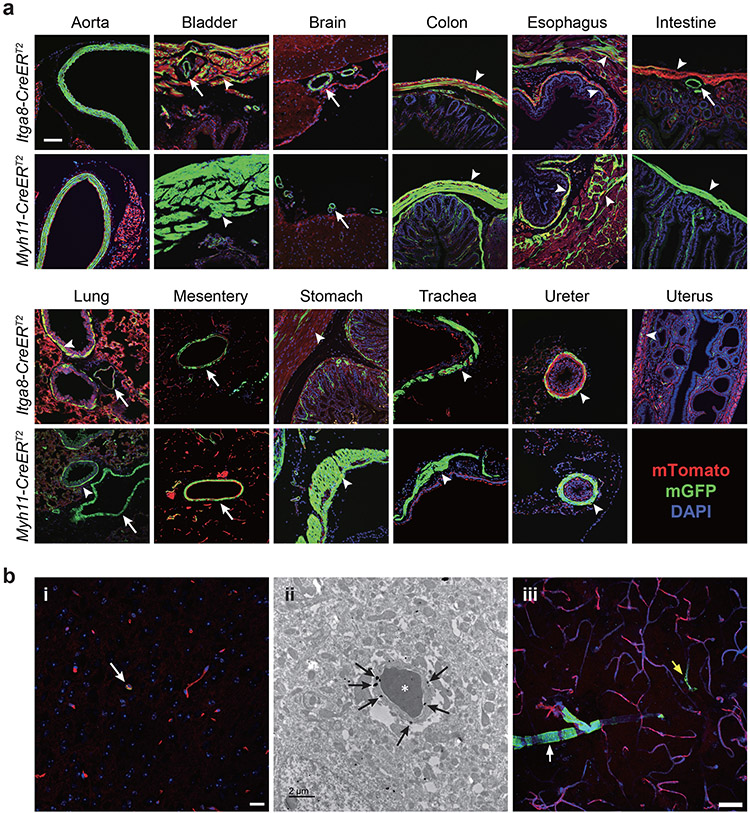
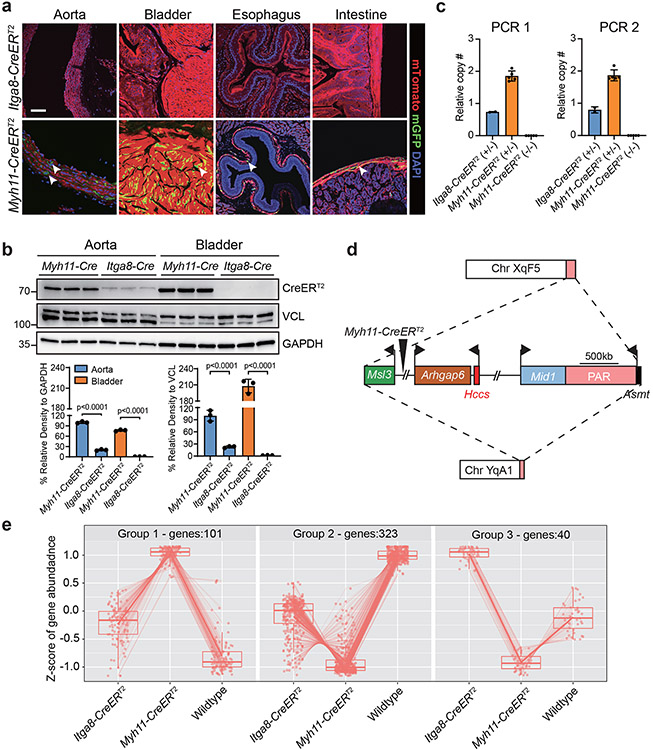
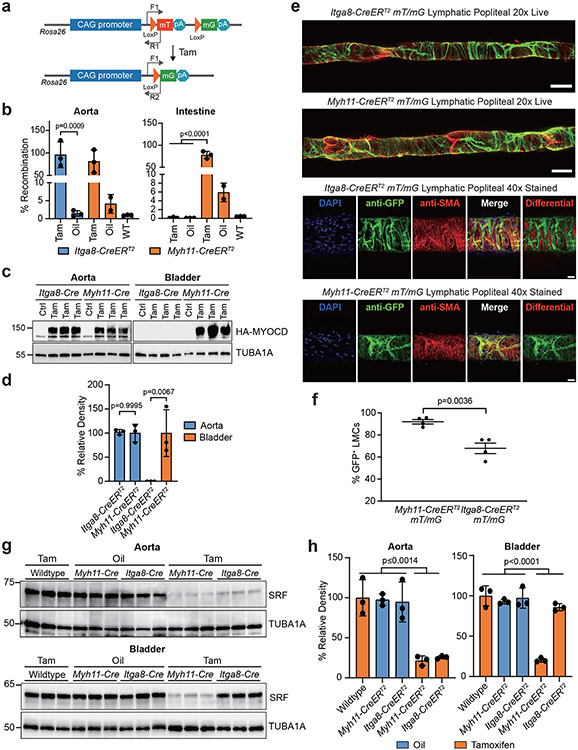
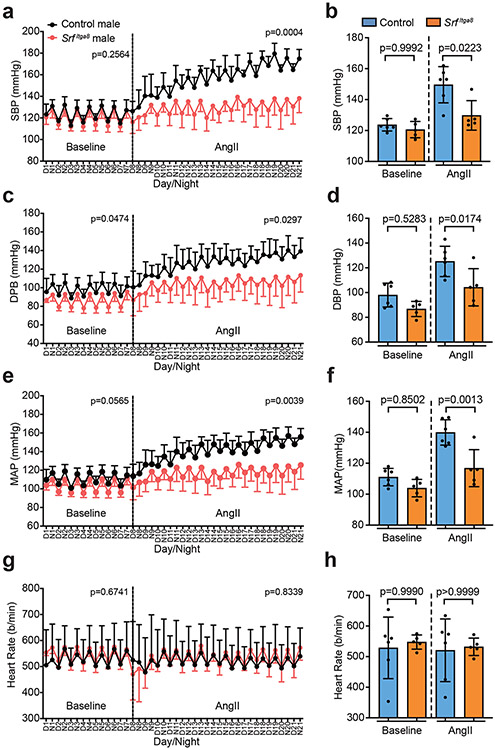
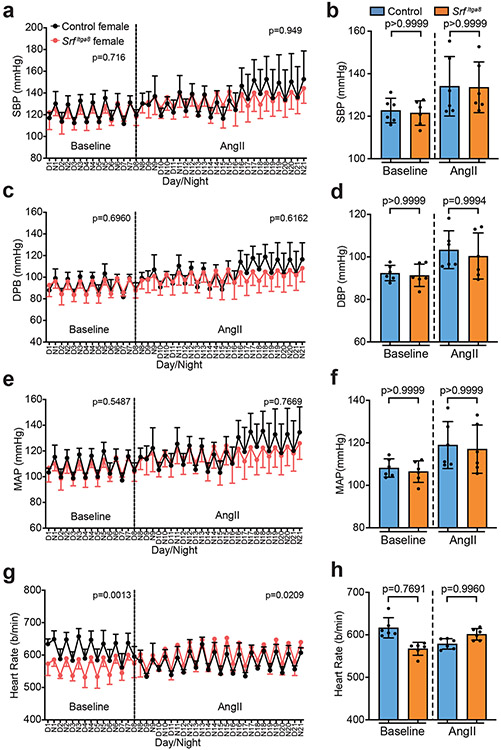
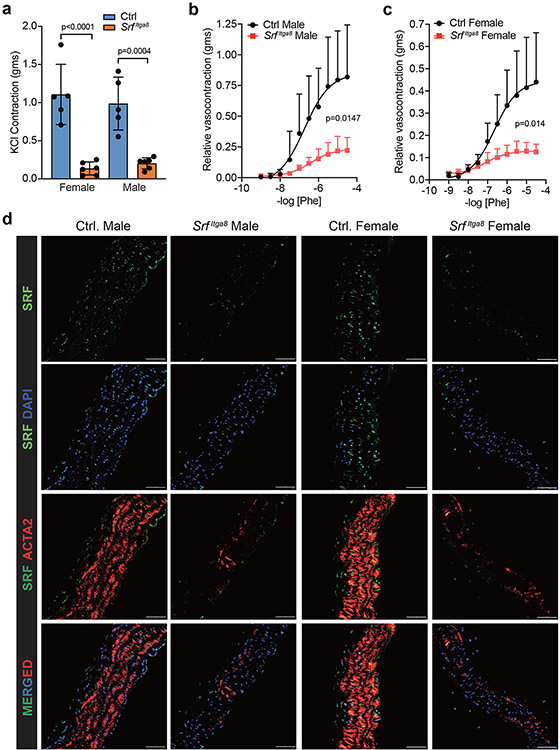
All current smooth muscle cell (SMC) Cre mice similarly recombine floxed alleles in vascular and visceral SMCs. Here, we present an Itga8-CreER T2 knock-in mouse and compare its activity with a Myh11-CreER T2 mouse. Both Cre drivers demonstrate equivalent recombination in vascular SMCs. However, Myh11-CreER T2 mice, but not Itga8-CreER T2 mice, display high activity in visceral SMC-containing tissues such as intestine, show early tamoxifen-independent activity, and produce high levels of CreERT2 protein. Whereas Myh11-CreER T2 -mediated knockout of serum response factor (Srf) causes a lethal intestinal phenotype precluding analysis of the vasculature, loss of Srf with Itga8-CreER T2 (Srf Itga8 ) yields viable mice with no evidence of intestinal pathology. Male and female Srf Itga8 mice exhibit vascular contractile incompetence, and angiotensin II causes elevated blood pressure in wild type, but not Srf Itga8 , male mice. These findings establish the Itga8-CreER T2 mouse as an alternative to existing SMC Cre mice for unfettered phenotyping of vascular SMCs following selective gene loss.

Keywords: Cre recombinase; integrin alpha 8; knockout; mouse; serum response factor; smooth muscle.


Figures

Extended Data Fig. 1
Extended Data Fig. 1. Strategy and sequence validation of Itga8-CreERT2.
a, Partial Itga8 locus, overlapping long noncoding RNA, and general strategy for mouse ESC targeting. The 22 amino acid P2A self-cleaving cassette (GSGATNFSLLKQAGDVEENPGP) allows for concurrent detection of the CreERT2 fusion and the mCherry reporter; however, mCherry fluorescence was not easily detected and therefore not pursued in this study. Small horizontal arrows (p1-p4) denote primers for PCR genotyping of mice. b, Nucleotide sequence of targeted knock-in cassette following Flippase-mediated removal of the Neo gene. Colors correspond to the schematic in a. Bases highlighted in black boxes represent codon-optimized substitutions from original sequences. HR, homologous recombination.
Extended Data Fig. 2
Extended Data Fig. 2. ITGA8 protein expression in heterozygous Itga8-CreERT2 mice.
a, Western blots of ITGA8 protein in two independent experiments performed by two independent investigators with quantitative data at right. n=6 independent male aortas for each condition. b, qRT-PCR analysis of Itga8 mRNA and c, the antisense Ak086420 long noncoding RNA in wild type versus Itga8-CreERT2 heterozygous aorta. n=6 male aortas per genotype. d, qRT-PCR of cytosolic versus nuclear Ak086420 expression in wild type aorta (n=4 male aortas). Error bars represent the mean ± standard deviation; p-values determined by two-tailed, unpaired Student’s t-test. e, Western blot of ITGA8 and CreERT2 in aorta of seven week-old male and female Itga8-CreERT2 heterozygous mice (n=3 independent mice of each sex). Molecular weight markers at right here and below are in kilodaltons.
Extended Data Fig. 3
Extended Data Fig. 3. Recombination activity of different SMC Cre mice in myeloid cells.
a, Representative flow cytometry of GFP labeled cells from wild type C57BL/6J mice (i); mT/mG reporter mice (ii); and mT/mG in Sm22-Cre (iii); tamoxifen-treated male Myh11-CreERT2 (iv); tamoxifen-treated male Itga8-CreERT2 (v); tamoxifen-treated female Itga8-CreERT2 (vi) mice. Quantitative data for GFP+ circulating cells in upper left quadrant Q1 (vii) and upper right quadrant Q2 (viii) are shown for each Cre driver line (n=3 male mice per Cre line, save the Itga8CreERT2 line which represent male, n=2, and female, n=2, samples pooled for the graphs shown). The horizontal axis was set to the same threshold for all panels according to the apparent two populations of cells in the positive control (Sm22-Cre-mT/mG). The vertical axis divides two apparent populations of different sized cells in the Sm22-Cre-mT/mG strain. Note, as we did not gate for any surface markers in this study, we cannot label any quadrant as to cell type. Source of cells was from circulation cleared of red blood cells. Error bars represent the mean ± standard deviation. One-way ANOVA and posthoc testing revealed indicated p-values. See Supplementary Figure 5 for more details. b, Bone marrow aspirates of 10-week-old male Itga8-CreERT2 (i, ii) and Myh11-CreERT2 (iii, iv) mice (n=2 mice/genotype) carrying mT/mG reporter and treated with tamoxifen. Arrows indicate multi-nucleated megakaryocytes. Scale bars are 20μm.
Extended Data Fig. 4
Extended Data Fig. 4. Comparative Cre activity in adult male and female blood vessels.
a, The GFP signal demonstrates recombination of the mT/mG reporter in medial SMCs of both the aorta and vena cava, whereas the red stained endothelium indicates the absence of recombination. Scale bar is 33μm for aorta and 100μm for vena cava. The aorta and vena cava of Itga8-CreERT2 was from a female mouse. b, Activity of each CreERT2 driver in indicated segments of male mouse aorta. Scale bars are 20μm for all panels. Lu, lumen of vessel wall. c, Tamoxifen-treated 54-week-old female (i-iii) and male (iv-vi) mouse thoracic aorta (i, iv), brain (ii, v), and heart (iii, vi). Each panel in a and b is representative of at least two independent male or female mice. Scale bars are all 20μm. d, Western blot of ITGA8 protein in 10-week-old versus 54-week-old female mouse aorta (n=3 independent mice per time point).
Extended Data Fig. 5
Extended Data Fig. 5. Comparative Cre activity in adult mouse tissues.
a, GFP signal restricted to VSMCs in blood vessels (arrows) of each indicated tissue type. b, GFP signal in VSMCs and non-VSMCs of indicated tissue types. White arrowheads, blood vessels of kidney and thymus; white arrows, glomeruli of kidney; yellow arrows, sinusoids of liver. Itga8-CreERT2-mediated GFP signal was also present in myoepithelial cells of mammary gland and thecal cells around mature follicle (white asterisk) of ovary. All images were processed the same except for the Testis panel under Itga8-CreERT2, which was uniformly enhanced to bring out more of the signal that otherwise would be too dark to visualize. Scale bar in a is 100μm for all images; scale bars in b are 50μm for kidney and thymus and 20μm for liver, mammary gland, and ovary. Data are representative of at least two independent male or female mice analyzed over the course of five years in two independent labs.
Extended Data Fig. 6
Extended Data Fig. 6. Leaky CreERT2 activity in aged mice.
Sections of aorta from 24-week-old or 54-week-old male Itga8-CreERT2 and 54-week-old Myh11-CreERT2 mice. The brightness in the 54-week Itga8-CreERT2 image was uniformly enhanced to better appreciate the GFP signal. Scale bars are 20μm for all panels. Images are representative of two independent mice.
Extended Data Fig. 7
Extended Data Fig. 7. Quantitative activity of Myh11-CreERT2 versus Itga8-CreERT2 in popliteal blood vessels.
Representative 2D maximum projections from confocal imaging of live GFP and tdTomato fluorescence popliteal artery (a, b) and vein (c, d) from Myh11-CreERT2 versus Itga8-CreERT2 with quantitation of each in panels e and f, respectively. n=4 male mice per genotype. Scale bars represent 50μm (a, b) and 100μm (c, d). Error bars in panels e-f represented by mean ± standard deviation; p-values determined by two-tailed, unpaired Student’s t-test.
Extended Data Fig. 8
Extended Data Fig. 8. Intestinal phenotype in Myh11-CreERT2 versus Itga8-CreERT2 mediated knockout of serum response factor (Srf).
a, Western blot showing lack of effect of tamoxifen on SRF in wild type aorta (n=3 independent male mice per treatment). b, Quantitation of panel a represented by mean ± standard deviation; p-value determined by two-tailed, unpaired Student’s t-test. c, Anatomy of abdominal cavity in the indicated CreERT2 driver mice used for Srf inactivation. The two SrfMyh11 images were from mice 14 days following tamoxifen administration, whereas the SrfItga8 image was from a mouse 8 weeks after tamoxifen administration. d, Oil (panels i-iii) and Tamoxifen (panels iv-vi) treated SrfMyh11 mice with dissected gross intestine (i, iv), H&E stained intestine (ii, v), and immunostaining for SRF (green) and ACTA2 (red) in intestine (iii, vi). Scale bar is 100μm for ii, iii, v, and vi or 1mm for i and iv. Studies of panel d are representative of at least two independent male or female mice analyzed over the course of five years in two independent labs.
Extended Data Fig. 9
Extended Data Fig. 9. Itga8-CreERT2 mediated inactivation of Srf in adult mouse tissues.
a, Immunofluorescence confocal microscopy of sections of carotid artery (i, iv), bladder (ii, v), and intestine (iii, vi) from tamoxifen-treated male mice carrying homofloxed Srf alleles in the absence (i-iii) or presence (iv-vi) of Itga8-CreERT2 (abbreviated Cre). Sections were stained with antibodies to ACTA2 (red), SRF (green), and DAPI. Arrows and arrowheads point to blood vessels and visceral SMCs, respectively. Scale bar is 20μm for all panels. Data from each panel are representative of at least two independent mice. b, SRF positive VSMCs were counted in sections of carotid arteries from Tam-administered homozygous floxed Srf mice without Cre (HoF+Tam, n=6 male mice per condition) or homozygous floxed Srf mice with Cre (HoF+Cre+Tam, n=5 male mice per condition). c, Same quantitative measures as in panel b only from intestine (n=3 mice per condition). Western blots of SRF in aorta (d) and bladder (e) of indicated genotypes, all treated with the same schedule of tamoxifen. Corresponding quantitative data are shown for mouse aorta (f) and bladder (g) (n=3 mice per genotype). HeF, heterozygous floxed Srf; HoF, homozygous floxed Srf. Error bars are mean ± standard deviation. Student unpaired, one-tailed t-test was applied in b and c, and one-way ANOVA with Tukey’s t-test for f and g to reveal indicated p-values in each graph.
Extended Data Fig. 10
Extended Data Fig. 10. Contractile activity of mesenteric artery in SrfItga8 conditional knockout mice.
a, Confocal immunofluorescence microscopy of SRF and DAPI alone (i, iii) and merged with ACTA2 (ii, iv) in mesenteric arteries of Oil control (i, ii) versus tamoxifen-treated (iii, iv) homozygous SrfItga8 mice; scale bars are 20μm. Results shown are of two independent mice for each condition. Western blots of SRF target, MYH11, in Oil versus Tam-induced SrfItga8 homozygous male (b) and female (c) mesenteric arteries. n=3 independent animals for each condition. Error bars represented by mean ± standard deviation; p-values determined by two-tailed, unpaired Student’s t-test.
Fig. 1
Fig. 1. Comparative recombination activity of Itga8-CreERT2 versus Myh11-CreERT2 in adult tissues.
a, Paired tissues from 10-week-old mice carrying indicated CreERT2 and mT/mG reporter. Green fluorescent protein (GFP), reflecting CreERT2-mediated excision of tdTomato cassette in the mT/mG reporter, is primarily confined to SMCs. DAPI indicates nuclear staining. White arrows indicate blood vessels; white arrowheads indicate visceral smooth muscle cells. Scale bar represents 100μm for aorta and uterus and 50μm for all other panels. b, Minimal Itga8-CreERT2 activity in pericytes of brain shown by mT/mG-derived GFP fluorescence (arrow in panel i), immunogold (arrows) electron microscopy (ii), and 2D maximum projection confocal microscopy (iii). An arteriole (white arrow) and capillary (yellow arrow) are highlighted in panel iii. Asterisk in panel ii denotes a red blood cell. Scale bars are 20μm, 2μm, and 50μm for panels i, ii, and iii, respectively. Data are representative of at least two independent male or female mice analyzed over the course of five years in two independent labs.
Fig. 2
Fig. 2. Distinguishing features of the Myh11-CreERT2 mouse.
a, Tamoxifen-independent recombination activity in 10-week-old male Myh11-CreERT2 tissues. Arrowheads point to SMCs with leaky activity. Images of aorta and bladder replicated in two additional animals from two independent labs; images of esophagus and intestine replicated in one independent experiment. b, Western blot of CreERT2 protein from 8-week-old male mice from each CreERT2 driver (n=3 mice per genotype). Units of measure for molecular weight markers here and in all subsequent blots is in kilodaltons. p values determined by one-way ANOVA with Tukey’s Student’s t-test. c, qPCR of Myh11-CreERT2 transgene from adult spleen (n=5 wild type and Myh11-CreERT2 mice; n=2 Itga8-CreERT2 mice). Two primer pairs (PCR 1 and PCR 2) used that amplify non-overlapping sequences in ERT2. d, Long read sequence mapping of approximate site-of-integration for Myh11-CreERT2 transgene (large triangle). Dashed lines represent initial translocation of the Myh11-CreERT2 transgene from X chromosome (top) carrying X-linked genes surrounding the Myh11-CreERT2 transgene (middle) to Y chromosome (bottom). Bent arrows indicate transcription start sites of each gene. Scale bar is an approximation. PAR, pseudoautosomal region. e, Bulk RNA-seq summary of differentially expressed genes in the absence of tamoxifen in 8-week-old male mice (n=3 mice per genotype). Group 1 represents significantly elevated genes in Myh11-CreERT2 aorta versus Itga8-CreERT2 and wild type; Group 2 represents significantly elevated genes in wild type aorta; Group 3 represents significantly elevated genes in Itga8-CreERT2 aorta. A list of differentially expressed genes is provided in Supplementary Table 2. Values for box whisker plots can be found in the source data file.
Fig. 3
Fig. 3. Recombination efficiency of Itga8-CreERT2 versus Myh11-CreERT2.
a, Schematic of mT/mG reporter at the Rosa26 locus and position of primers (arrows) for measuring recombination. b, qPCR of genomic DNA following Oil or Tamoxifen (Tam) administration in each strain of CreERT2 (n=3 mice per condition and genotype, save Oil-treated Myh11-CreERT2 condition with n=2). Note leaky activity in Oil-treated Myh11-CreERT2. c, Similar study design as in panel b only an inducible Myocd transgenic mouse was bred to each CreERT2 driver for Oil (Ctrl) or tamoxifen (Tam) administration and Western blotting for the presence of the HA-tagged MYOCD protein. d, Quantitative data of Western blots in panel c; (n=3 independent mice per genotype). e, Representative 2D maximum projections of popliteal lymphatic vessels isolated from each CreERT2 mouse (n=4 mice per genotype). Top panel, stitched maximum projections of live GFP and tdTomato fluorescence imaged with confocal microscopy at 20x. Note presence of GFP negative valves. Bottom panel, popliteal lymphatic vessels fixed and stained with DAPI, anti-GFP and anti-smooth muscle alpha actin (SMA) and imaged with confocal microscopy at 40x. The scale bars are 100μm for stitched images and 25μm for immunostained images. f, Quantitation of GFP+ fluorescence in lymphatic muscle cells (LMCs; n=4 mice per genotype). g, Western blot of SRF protein in aorta and bladders of each indicated genotype with Oil or Tam administration (n=3 mice per genotype). h, Quantitative data of panel g; percent relative density to the TUBA1A loading control (n=3 independent mice per condition). Error bars represented by mean ± standard deviation. p values determined by one-way ANOVA and Tukey’s t-test for panels b and h and unpaired two-tailed Student’s t-test for panels d and f.
Fig. 4
Fig. 4. Chronic blood pressure measurements in Itga8-CreERT2 mediated Srf knockout male mice.
Effects of Srf knockout (SrfItga8) on systolic blood pressure (a, b), diastolic blood pressure (c, d), mean arterial pressure (e, f) and heart rate (g, h) in male mice as measured by radio-telemetry over 3 weeks. Control mice here and in Figures 5 and 6 are oil-treated, homozygous floxed Srf mice carrying Itga8-CreERT2. n=6 oil control and n=5 SrfItga8 mice. Error bars represented by mean ± standard deviation. Each biological replicate represents the mean over days 1-7 (baseline) or days 8-21 (AngII). p values determined by two-way ANOVA for temporal study (a,c,e,g) and one-way ANOVA and Tukey’s t-test for baseline and AngII (b,d,f,h).
Fig. 5
Fig. 5. Chronic blood pressure measurements in Itga8-CreERT2 mediated Srf knockout female mice.
Effects of SrfItga8 on systolic blood pressure (a, b), diastolic blood pressure (c, d), mean arterial pressure (e, f) and heart rate (g, h) in female mice as measured by telemetry over 3 weeks. n=6 mice per condition. Error bars represented by mean ± standard deviation. Each biological replicate represents the mean over days 1-7 (baseline) or days 8-21 (AngII). p values determined by two-way ANOVA for temporal study (a,c,e,g) and one-way ANOVA and Tukey’s t-test for baseline and AngII (b,d,f,h).
Fig. 6
Fig. 6. Vascular contractile activity in Itga8-CreERT2 mediated Srf knockout mice.
a, KCl-stimulated contractile activity in female (n=5) and male (n=6) aorta under control or SrfItga8 condition. The same groups of Male (b) and female (c) mouse aortas were treated with varying doses of Phenylephrine [Phe]. d, Confocal immunofluorescence microscopy of indicated proteins in control (Oil) and SrfItga8 male and female aortic segments from the same mice used in KCl and Phe treatments. Images are representative of two independent mice. The scale bars are 50μm. Error bars represented by mean ± standard deviation. p values determined by one-way ANOVA and Tukey’s t-test (a) or two-way ANOVA (b,c).
Fig. 7
Fig. 7. Bulk RNA-seq of aortas from Itga8-CreERT2 mediated Srf knockout mice.
a, Down-regulated expression of SMC genes in aorta of heterozygous (n=2) versus homozygous (n=3) SrfItga8 knockout mice. b, Volcano plot of differentially expressed genes in SrfItga8 knockout aorta. c, oPOSSUM 3.0 analysis of over-represented transcription factor binding sites in promoter/intron of top 250 down-regulated genes in SrfItga8 knockout aorta. Enrichment scores for gene ontology terms (Molecular Function) related to downregulated (d) or upregulated (e) genes in SrfItga8 knockout aorta.

References

    1. Sauer B Inducible gene targeting in mice using the Cre/lox system. Methods 14, 381–392 (1998). - PubMed
    1. Gu H, Marth JD, Orban PC, Mossmann H & Rajewsky K Deletion of a DNA polymerase beta gene segment in T cells using cell type-specific gene targeting. Science 265, 103–106 (1994). - PubMed
    1. Feil R et al. Ligand-activated site-specific recombination in mice. Proc Natl Acad Sci U S A 93, 10887–10890 (1996). - PMC - PubMed
    1. Majesky MW Developmental basis of vascular smooth muscle diversity. Arteriosclerosis, Thrombosis and Vascular Biology 27, 1248–1258 (2007). - PubMed
    1. Tasian G, Cunha G & Baskin L Smooth muscle differentiation and patterning in the urinary bladder. Differentiation 80, 106–117 (2010). - PMC - PubMed