

The Restrain Food Database: validation of an open-source database of foods that should be eaten more or less as part of a healthy diet
- PMID: 36425519
- PMCID: PMC9682305
- DOI: 10.1098/rsos.220923
The Restrain Food Database: validation of an open-source database of foods that should be eaten more or less as part of a healthy diet
Abstract
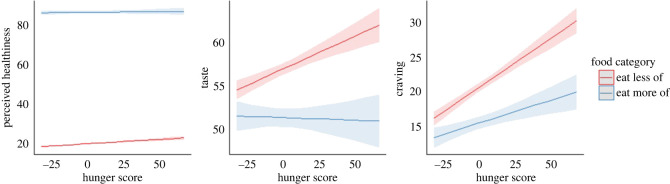
Studies of food-related behaviours often involve measuring responses to pictorial stimuli of foods. Creating these can be burdensome, requiring a significant commitment of time, and with sharing of images for future research constrained by legal copyright restrictions. The Restrain Food Database is an open-source database of 626 images of foods that are categorized as those people could eat more or less of as part of a healthy diet. This paper describes the database and details how to navigate it using our purpose-built R Shiny tool and a pre-registered online validation of a sample of images. A total of 2150 participants provided appetitive ratings, perceptions of nutritional content and ratings of image quality for images from the database. We found support for differences between Food Category on appetitive ratings which were also moderated by state hunger ratings. Findings relating to individual differences in appetite ratings as well as differences between BMI weight categories are also reported. Our findings validate the food categorization in the Restrain Food Database and provide descriptive information for individual images within this investigation. This database should ease the burden of selecting and creating appropriate images for future studies.
Keywords: food; food stimuli; healthy diet; open-source image database; personalization.
© 2022 The Authors.
Conflict of interest statement
C.D.C is a member of the Royal Society Open Science editorial board but had no involvement in the peer review process of this submission. The authors declare no other competing interests.
Figures


Similar articles
-
A Tool to Measure Young Adults' Food Intake: Design and Development of an Australian Database of Foods for the Eat and Track Smartphone App.JMIR Mhealth Uhealth. 2018 Nov 7;6(11):e12136. doi: 10.2196/12136. JMIR Mhealth Uhealth. 2018. PMID: 30404768 Free PMC article.
-
[Study of the categorization process among patients with eating disorders: a new cognitive approach to psychopathology].Encephale. 2005 Jan-Feb;31(1 Pt 1):82-91. doi: 10.1016/s0013-7006(05)82376-0. Encephale. 2005. PMID: 15971644 French.
-
Appropriateness of the food-pics image database for experimental eating and appetite research with adolescents.Eat Behav. 2016 Dec;23:195-199. doi: 10.1016/j.eatbeh.2016.10.007. Epub 2016 Oct 27. Eat Behav. 2016. PMID: 27842263
-
Effects of Whole Grain Intake, Compared with Refined Grain, on Appetite and Energy Intake: A Systematic Review and Meta-Analysis.Adv Nutr. 2021 Jul 30;12(4):1177-1195. doi: 10.1093/advances/nmaa178. Adv Nutr. 2021. PMID: 33530093 Free PMC article.
-
Nutrients and behaviour: research strategies for the investigation of taste characteristics, food preferences, hunger sensations and eating patterns in man.J Psychiatr Res. 1982-1983;17(2):203-12. doi: 10.1016/0022-3956(82)90023-1. J Psychiatr Res. 1982. PMID: 6764938 Review.
Cited by
-
Close to the same: Similarity influences remembered distance between stimuli.Psychon Bull Rev. 2023 Oct;30(5):1814-1828. doi: 10.3758/s13423-023-02267-5. Epub 2023 Mar 29. Psychon Bull Rev. 2023. PMID: 36988892 Free PMC article.
-
Introducing the trier univalence neutrality ambivalence (TUNA) database: A picture database differentiating complex attitudes.PLoS One. 2024 May 16;19(5):e0302904. doi: 10.1371/journal.pone.0302904. eCollection 2024. PLoS One. 2024. PMID: 38753714 Free PMC article.
References
-
- Mela DJ. 2006. Eating for pleasure or just wanting to eat? Reconsidering sensory hedonic responses as a driver of obesity. Appetite 47, 10-17. - PubMed
Associated data
LinkOut - more resources
Full Text Sources
