. 2022 Nov 8:12:1007950.
doi: 10.3389/fcimb.2022.1007950. eCollection 2022.

Bioinformatic analysis identifies HPV-related tumor microenvironment remodeling prognostic biomarkers in head and neck squamous cell carcinoma

Affiliations

Bioinformatic analysis identifies HPV-related tumor microenvironment remodeling prognostic biomarkers in head and neck squamous cell carcinoma

Qimin Zhou et al. Front Cell Infect Microbiol. .

Abstract

Head and neck squamous cell carcinomas (HNSCCs) are highly aggressive tumors with rapid progression and poor prognosis. Human papillomavirus (HPV) infection has been identified as one of the most important carcinogens for HNSCC. As an early event in HNSCC, infection with HPV leads to altered immune profiles in the tumor microenvironment (TME). The TME plays a key role in the progression and transformation of HNSCC. However, the TME in HNSCC is a complex and heterogeneous mix of tumor cells, fibroblasts, different types of infiltrating immune cells, and extracellular matrix. Biomarkers relevant to the TME, and the biological role of these biomarkers, remain poorly understood. To this end, we performed comprehensive analysis of the RNA sequencing (RNA-Seq) data from tumor tissue of 502 patients with HNSCC and healthy tissue of 44 control samples. In total, we identified 4,237 differentially expressed genes, including 2,062 upregulated and 2,175 downregulated genes. Further in-depth bioinformatic analysis suggested 19 HNSCC tumor tissue-specific genes. In the subsequent analysis, we focused on the biomarker candidates shown to be significantly associated with unfavorable patient survival: ITGA5, PLAU, PLAUR, SERPINE1, TGFB1, and VEGFC. We found that the expression of these genes was negatively regulated by DNA methylation. Strikingly, all of these potential biomarkers are profoundly involved in the activation of the epithelial-mesenchymal transition (EMT) pathway in HNSCCs. In addition, these targets were found to be positively correlated with the immune invasion levels of CD4+ T cells, macrophages, neutrophils, and dendritic cells, but negatively correlated with B-cell infiltration and CD8+ T-cell invasion. Notably, our data showed that the expression levels of ITGA5, PLAU, PLAUR, SERPINE1, and TGFB1 were significantly overexpressed in HPV-positive HNSCCs compared to normal controls, indicating the potential role of these biomarkers as transformation and/or malignant progression markers for HNSCCs in patients with HPV infection. Taken together, the results of our study propose ITGA5, PLAU, PLAUR, SERPINE1, and TGFB1 as potential prognostic biomarkers for HNSCCs, which might be involved in the HPV-related TME remodeling of HNSCC. Our findings provide important implications for the development and/or improvement of patient stratification and customized immunotherapies in HNSCC.

Keywords: HPV; biomarkers; head and neck squamous cell carcinoma; immune evasion; immunotherapy; tumor microenvironment.


Conflict of interest statement

The authors declare that the research was conducted in the absence of any commercial or financial relationships that could be construed as a potential conflict of interest. The reviewer WuZ declared a shared affiliation with authors QZ and OY, to the handling editor at the time of review.

Figures

Figure 1
Figure 1
Identification of differentially expressed genes (DEGs) and enriched biological processes in head and neck squamous cell carcinoma (HNSCC). (A) Schematic of the patient samples included in the RNA sequencing (RNA-Seq). (B) Volcano plots showing the fold change (FC) and p-values for the comparisons of tumor tissues and normal tissues. Upregulated (log2FC ≥ 1, p < 0.05) and downregulated (log2FC ≤ −1, p < 0.05) genes are depicted in red and green, respectively. (C) Top 200 DEGs between tumor and normal tissues visualized as heatmaps from RNA-Seq. Data were z-score normalized. (D) Gene Ontology enrichment analysis for the top 200 DEGs between tumor and normal tissues. Only the significant enrichment values (p < 0.05) of the GO terms from the biological process category are listed.
Figure 2
Figure 2
Establishment of the co-expression network modules for the occurrence and progression of head and neck squamous cell carcinoma (HNSCC). (A) Scale independence and mean connectivity of the network in different statistical thresholds. The panel displays the strong correlation of the statistical thresholds with a scale-free fit index. (B) Robust influence of the statistical threshold on mean connectivity. (C) Clustering of the eigengene modules by weighted gene co-expression network analysis (WGCNA) and their correlation with the occurrence and progression of HNSCC. (D) Cluster dendrogram based on the dissimilarity of the topological overlap matrix. Different colours correspond to the co-expression modules in HNSCC. (E) Heatmap of the correlation between the identified modules and clinical features (n = 44 in normal tissues and n = 502 in tumor tissues). The x-axis corresponds to the clinical features, while the y-axis represents the identified modules. The colour scale (blue to red) indicates correlation. Data are presented as the correlation coefficient in the top row and the p-value in the bottom row in parentheses. (F) Significant enriched Gene Ontology (GO) biological process terms for the HNSCC positively associated (black) module. (G) Significant enriched GO biological process terms for the HNSCC negatively associated (red) module. (H) Intersection of the differentially expressed genes in the different modules. Bar charts indicate the number of involved genes in the black or red modules.
Figure 3
Figure 3
Identification and validation of the biomarkers for head and neck squamous cell carcinoma (HNSCC). (A) Venn diagram of the top 30 HNSCC-associated candidates selected by Cytoscape analysis, depending on the MCC (Maximal Clique Centrality), MNC (Maximum Neighborhood Component), EPC (Edge Percolated Component), and Degree algorithms. (B) Significant enriched Gene Ontology (GO) pathway signaling for the 19 potential biomarkers. (C) Significant enriched GO biological process terms for the 19 potential biomarkers. (D) Expression levels of ITGA5, PLAU, PLAUR, SERPINE1, TGFB1, and VEGFC in tumor versus normal tissues. (E) Volcano plots showing the fold change (FC) and p-value of the biomarker candidates for the comparisons of tumor and normal tissues from the GSE138206 dataset. Upregulated (log2FC ≥ 2, p < 0.05) and downregulated (log2FC ≤ −2, p < 0.05) genes are depicted in red and green, respectively. (F) Expression patterns of PLAUR, PLAU, VEGFC, SERPINE1, ITGA5, and TGFB1 in oral squamous cell carcinoma (OSCC) tumor (n = 6) and normal (n = 6) tissues visualized as heatmaps from the microarray. Data were z-score normalized. (G) Representative immunohistochemistry staining images of the ITGA5 and PLAU protein expression levels in tumor and normal tissues. Data were from the Human Protein Atlas database.
Figure 4
Figure 4
Prognostic value of the biomarkers for head and neck squamous cell carcinoma (HNSCC). Kaplan–Meier survival curves of patients with HNSCC based on the high or low expression levels (above or below median expression) of ITGA5, PLAU, PLAUR, SERPINE1, TGFB1, and VEGFC.
Figure 5
Figure 5
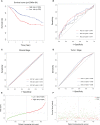
Prognostic and prediction model construction of the biomarkers for head and neck squamous cell carcinoma (HNSCC). (A) Overall survival curve of patients with HNSCC depending on their high (n = 228) and low (n = 229) risk scores defined by the prognostic model. (B–D) Diagnostic receiver operating characteristic (ROC) curves generated using the risk scores (B), the TNM clinical staging system (C), and pathological staging system (D) aiming to predict the 1-, 3-, and 5-year survival of patients with HNSCC. (E) Normalized distribution of the risk scores and the cutoff value for classifying the high- (red curve, n = 228) and low-risk (green curve, n = 229) groups. (F) Distribution of the survival status of individual HNSCC patients (red dots represent dead and green dots represent alive) according to their risk scores (dashed line represents the cutoff value).
Figure 6
Figure 6
The expression levels of the biomarker candidates are regulated by DNA methylation in head and neck squamous cell carcinoma (HNSCC). (A) DNA methylation levels of ITGA5, PLAU, PLAUR, SERPINE1, TGFB1, and VEGFC in HNSCC (n = 530) and normal (n = 50) tissues. (B) Correlation between the DNA methylation levels and gene expression levels of ITGA5, PLAU, PLAUR, SERPINE1, TGFB1, and VEGFC (n = 502 and n = 22 for HNSCC and normal tissues, respectively). * means multiplication.
Figure 7
Figure 7
Biomarkers are involved in tumor microenvironment (TME) remodeling and immune infiltration in head and neck squamous cell carcinoma (HNSCC). (A) Activation/inhibition functionality of ITGA5, PLAU, PLAUR, SERPINE1, TGFB1, and VEGFC on different biological signaling pathways. (B) Interaction map of ITGA5, PLAU, PLAUR, SERPINE1, TGFB1, and VEGFC with potential biological signaling pathways in HNSCC. (C) Relationship between the infiltration levels of six types of immune cells and the expression level of the six biomarkers in patients with HNSCC (n = 522).
Figure 8
Figure 8
Biomarkers are involved in the transformation and progression of head and neck squamous cell carcinoma (HNSCCs) in patients with human papillomavirus (HPV) infection. (A) Expression patterns of 19 differentially expressed genes (DEGs) in HPV-positive HNSCCs (n = 34) and normal controls (n = 44) visualized as heatmaps. (B) Expression levels of ITGA5, PLAU, PLAUR, SERPINE1, TGFB1, and VEGFC in HPV-positive HNSCCs (n = 34) and normal tissues (n = 44). * means multiplication.

References

    1. Akhurst R. J., Hata A. (2012). Targeting the TGFbeta signalling pathway in disease. Nat. Rev. Drug Discov 11, 790–811. doi: 10.1038/nrd3810 - DOI - PMC - PubMed
    1. Arroyo-Solera I., Pavon M. A., Leon X., Lopez M., Gallardo A., Cespedes M. V., et al. . (2019). Effect of serpinE1 overexpression on the primary tumor and lymph node, and lung metastases in head and neck squamous cell carcinoma. Head Neck 41, 429–439. doi: 10.1002/hed.25437 - DOI - PubMed
    1. Bellone G., Aste-Amezaga M., Trinchieri G., Rodeck U. (1995). Regulation of NK cell functions by TGF-β1. J. Immunol. 155, 1066–1073. - PubMed
    1. Braakhuis B. J., Brakenhoff R. H., Leemans C. R. (2012). Treatment choice for locally advanced head and neck cancers on the basis of risk factors: biological risk factors. Ann. Oncol. 23 Suppl 10, x173–x177. doi: 10.1093/annonc/mds299 - DOI - PubMed
    1. Bray F., Ferlay J., Soerjomataram I., Siegel R. L., Torre L. A., Jemal A. (2018). Global cancer statistics 2018: GLOBOCAN estimates of incidence and mortality worldwide for 36 cancers in 185 countries. CA Cancer J. Clin. 68, 394–424. doi: 10.3322/caac.21492 - DOI - PubMed

Publication types

MeSH terms