

Frequency tagging with infants: The visual oddball paradigm
- PMID: 36425830
- PMCID: PMC9679632
- DOI: 10.3389/fpsyg.2022.1015611
Frequency tagging with infants: The visual oddball paradigm
Abstract
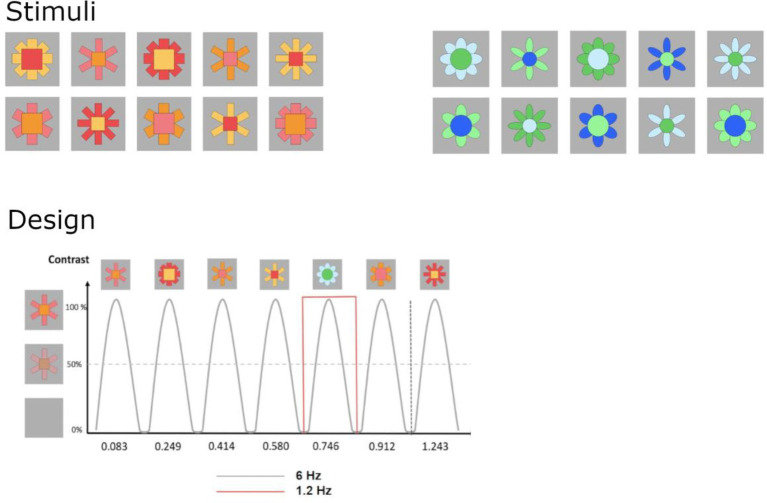
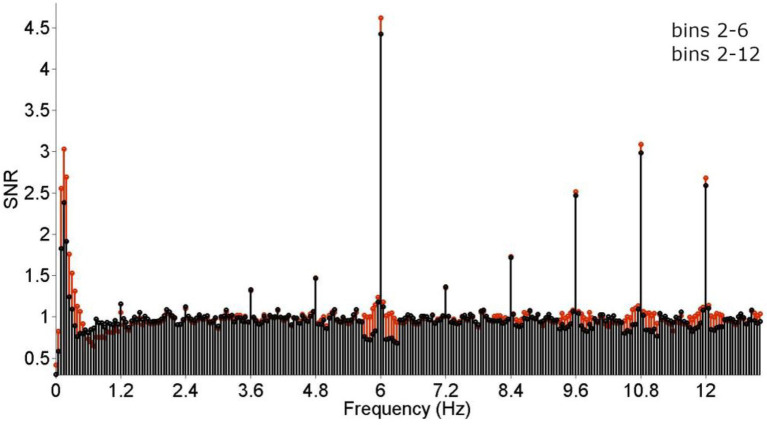
Combining frequency tagging with electroencephalography (EEG) provides excellent opportunities for developmental research and is increasingly employed as a powerful tool in cognitive neuroscience within the last decade. In particular, the visual oddball paradigm has been employed to elucidate face and object categorization and intermodal influences on visual perception. Still, EEG research with infants poses special challenges that require consideration and adaptations of analyses. These challenges include limits to attentional capacity, variation in looking times, and presence of artefacts in the EEG signal. Moreover, potential differences between age-groups must be carefully evaluated. This manuscript evaluates challenges theoretically and empirically by (1) a systematic review of frequency tagging studies employing the oddball paradigm and (2) combining and re-analyzing data from seven-month-old infants (N = 124, 59 females) collected in a categorization task with artifical, unfamiliar stimuli. Specifically, different criteria for sequence retention and selection of harmonics, the influence of bins considered for baseline correction and the relation between fast periodic visual stimulation (FPVS) responses and looking time are analyzed. Overall, evidence indicates that analysis decisions should be tailored based on age-group to optimally capture the observed signal. Recommendations for infant frequency tagging studies are developed to aid researchers in selecting appropriate stimulation and analysis strategies in future work.
Keywords: analysis strategies; categorization; fast periodic visual stimulation; frequency tagging; infants; visual processing.
Copyright © 2022 Peykarjou.
Conflict of interest statement
The author declares that the research was conducted in the absence of any commercial or financial relationships that could be construed as a potential conflict of interest.
Figures


Similar articles
-
Understanding human individuation of unfamiliar faces with oddball fast periodic visual stimulation and electroencephalography.Eur J Neurosci. 2020 Nov;52(10):4283-4344. doi: 10.1111/ejn.14865. Epub 2020 Sep 30. Eur J Neurosci. 2020. PMID: 32542962 Review.
-
The effect of repetition priming on implicit recognition memory as measured by Fast Periodic Visual Stimulation and EEG.Int J Psychophysiol. 2021 Mar;161:44-52. doi: 10.1016/j.ijpsycho.2021.01.009. Epub 2021 Jan 14. Int J Psychophysiol. 2021. PMID: 33454321
-
The Development of Global-Level Categorization: Frequency Tagging EEG Responses.Brain Sci. 2024 May 24;14(6):541. doi: 10.3390/brainsci14060541. Brain Sci. 2024. PMID: 38928541 Free PMC article.
-
Neural responses in a fast periodic visual stimulation paradigm reveal domain-general visual discrimination deficits in developmental prosopagnosia.Cortex. 2020 Dec;133:76-102. doi: 10.1016/j.cortex.2020.09.008. Epub 2020 Sep 29. Cortex. 2020. PMID: 33099077
-
Understanding individual face discrimination by means of fast periodic visual stimulation.Exp Brain Res. 2014 Jun;232(6):1599-621. doi: 10.1007/s00221-014-3934-9. Epub 2014 Apr 12. Exp Brain Res. 2014. PMID: 24728131 Review.
Cited by
-
Communicative signals during joint attention promote neural processes of infants and caregivers.Dev Cogn Neurosci. 2024 Feb;65:101321. doi: 10.1016/j.dcn.2023.101321. Epub 2023 Dec 6. Dev Cogn Neurosci. 2024. PMID: 38061133 Free PMC article.
-
Physiological Entrainment: A Key Mind-Body Mechanism for Cognitive, Motor and Affective Functioning, and Well-Being.Brain Sci. 2024 Dec 24;15(1):3. doi: 10.3390/brainsci15010003. Brain Sci. 2024. PMID: 39851371 Free PMC article. Review.
-
Covert attention modulates the SSVEP in a paradigm suitable for infants and young children.Atten Percept Psychophys. 2025 Oct;87(7):2085-2104. doi: 10.3758/s13414-025-03097-4. Epub 2025 Jun 5. Atten Percept Psychophys. 2025. PMID: 40474052
-
Rhythmic visual stimulation as a window into early brain development: A systematic review.Dev Cogn Neurosci. 2023 Dec;64:101315. doi: 10.1016/j.dcn.2023.101315. Epub 2023 Oct 16. Dev Cogn Neurosci. 2023. PMID: 37948945 Free PMC article.
-
The emergence of visual category representations in infants' brains.Elife. 2024 Dec 23;13:RP100260. doi: 10.7554/eLife.100260. Elife. 2024. PMID: 39714017 Free PMC article.
References
LinkOut - more resources
Full Text Sources