Meta-Analysis
. 2022 Nov 3;4(1):100158.
doi: 10.1016/j.xhgg.2022.100158. eCollection 2023 Jan 12.

CFDP1 is a neuroblastoma susceptibility gene that regulates transcription factors of the noradrenergic cell identity

Affiliations
Meta-Analysis

CFDP1 is a neuroblastoma susceptibility gene that regulates transcription factors of the noradrenergic cell identity

Daniela Formicola et al. HGG Adv. .

Abstract

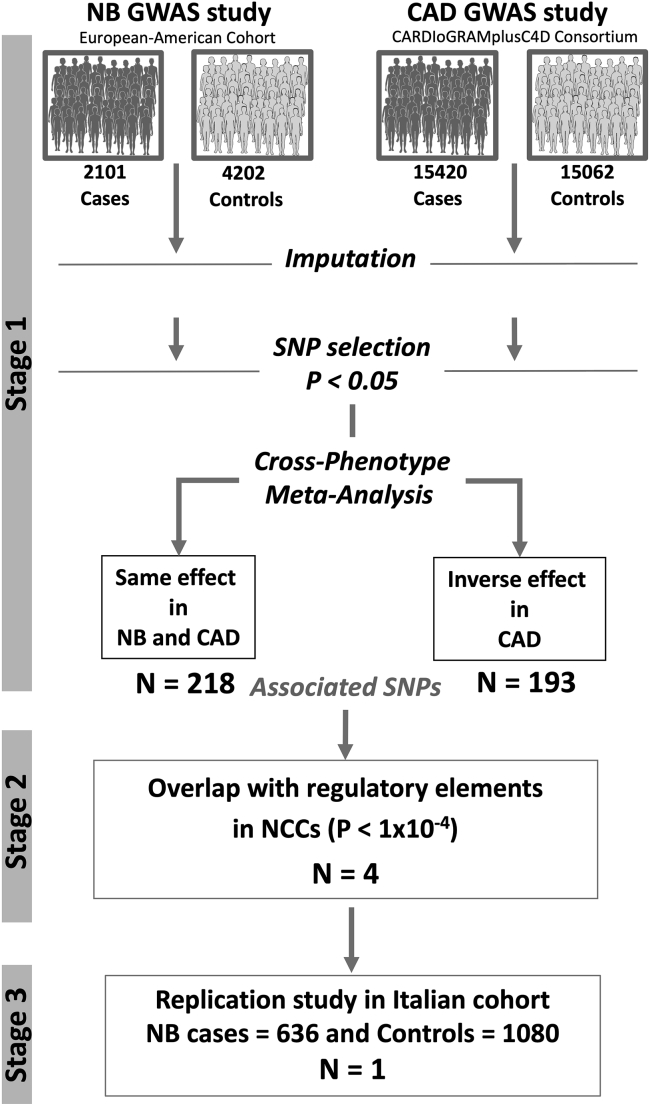
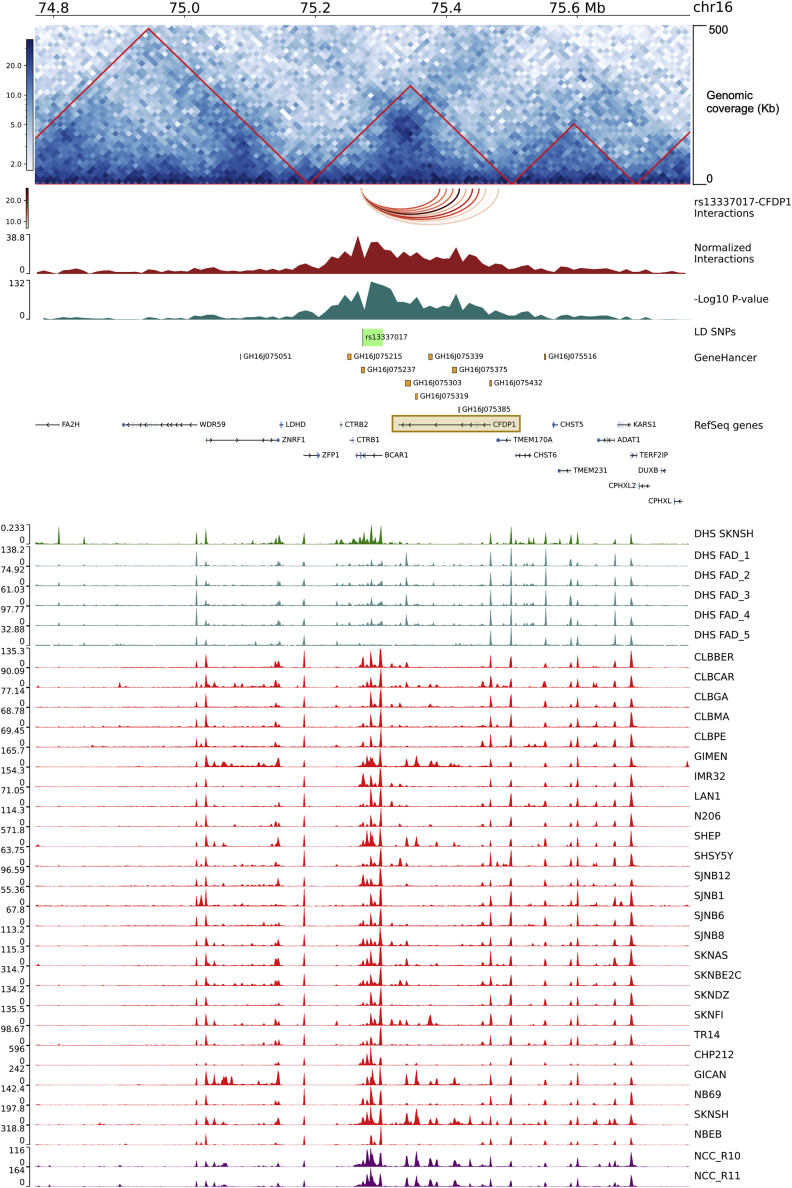
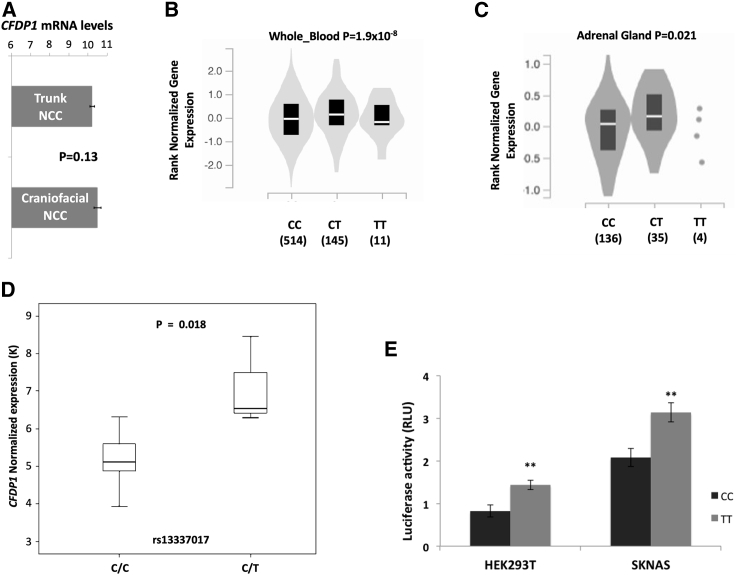
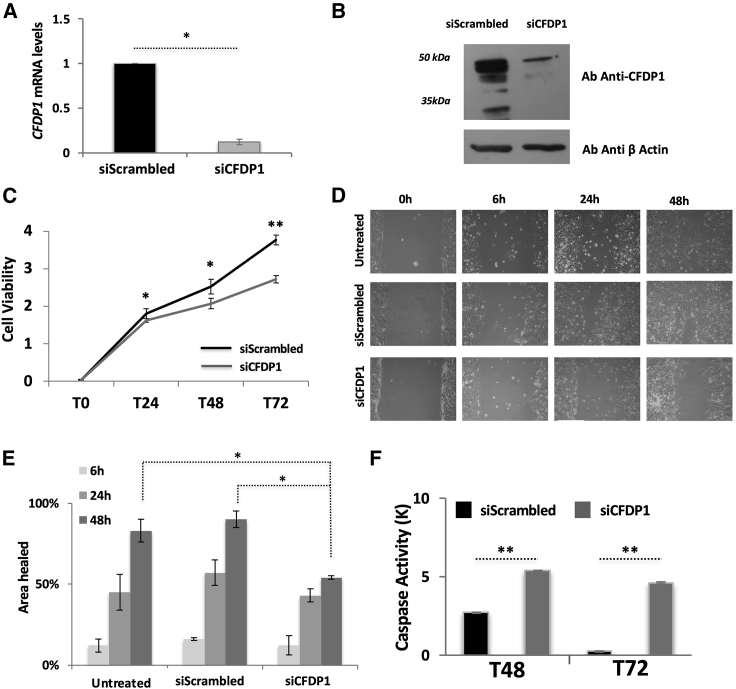
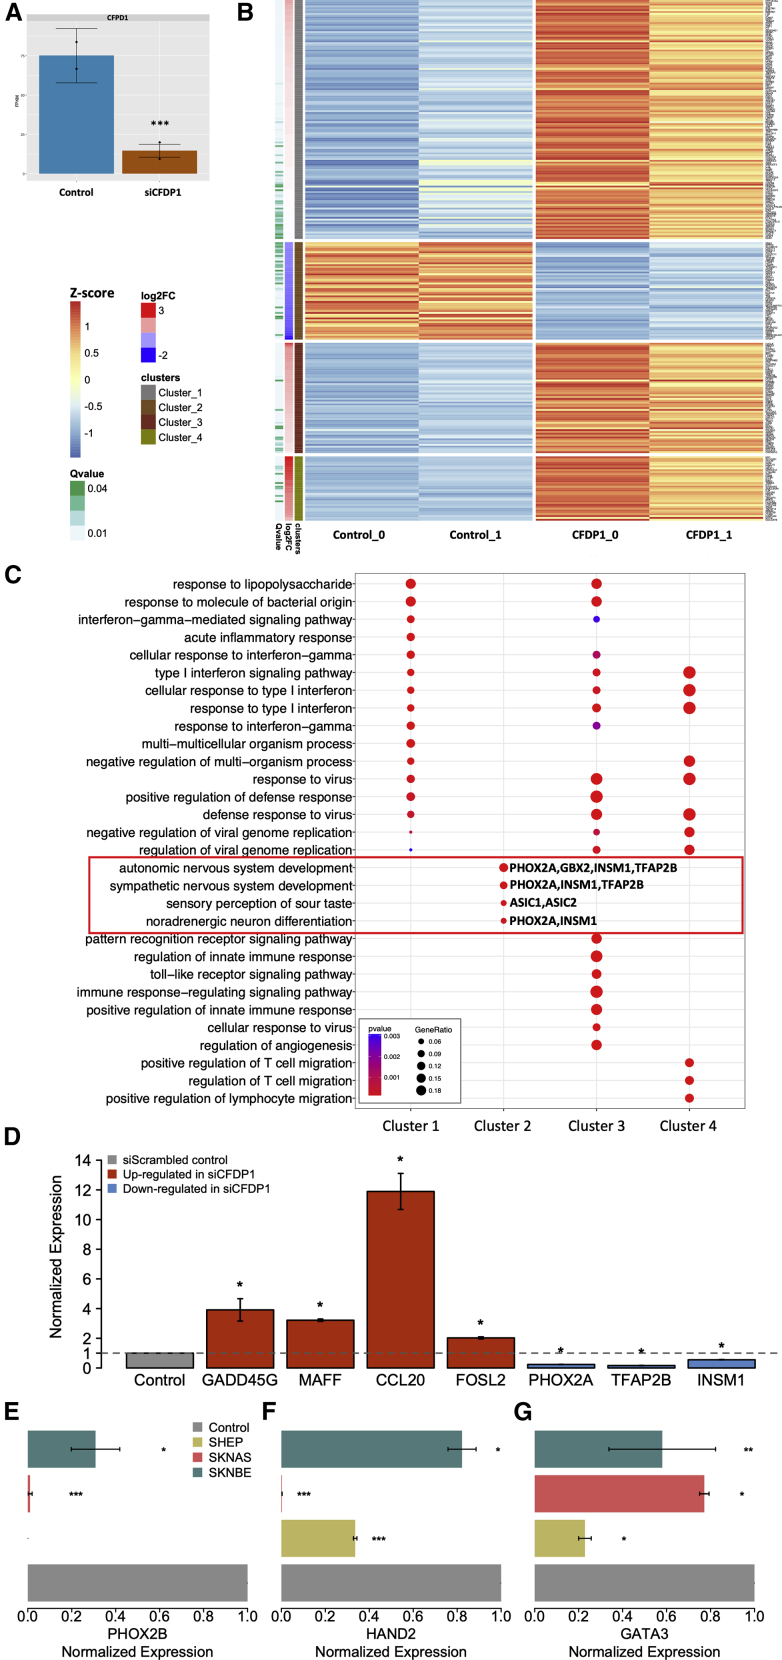
Pleiotropic genetic factors (e.g., DNA polymorphisms) may be involved in the initiation of neuroblastoma (NB) and coronary artery disease (CAD) given their common origin from defects in neural crest development. To discover novel NB susceptibility genes, we conducted a three-stage survey including a meta-analysis of NB and CAD genome-wide association data, prioritization of NB causal variants, and validation in an independent cohort of affected individuals-control subjects. The lead SNP, rs13337397 at the 16q23.1 locus, associated with both diseases in the meta-analysis and with NB in the validation study. All the SNPs in linkage disequilibrium with rs13337397 were annotated using the H3K27ac epigenetic marker of neural crest cells (NCC) and NB cell lines. Indeed, we identified the functional SNP rs13337017, mapping within an enhancer of NCCs and NB cell lines and showing long-range interactions with CFDP1 by Hi-C analysis. Luciferase assays indicated that the risk allele of rs13337017 increased CFDP1 expression in NB cell lines. Of note, CFDP1 high expression associated with unfavorable prognostic markers in an analysis including 498 NB transcriptomes. Moreover, depletion of CFDP1 markedly decreased viability and migration and increased apoptotic rates in NB cell lines. Finally, transcriptome and qPCR analyses revealed that the depletion of CFDP1 may affect noradrenergic neuron differentiation by downregulating master regulators of sympathetic noradrenergic identity, including PHOX2B, HAND2, and GATA3. Our data strongly suggest that CFDP1 acts as oncogene in NB. In addition, we provide evidence that genetic predisposition to NB can be mediated by the alteration of noradrenergic lineage-specific gene expression.

Keywords: GWAS; SNP; cancer predisposition; coronary artery disease; neural crest cells; neuroblastoma; pleiotropic variants.


Conflict of interest statement

The authors declare no competing interests.

Figures

Figure 1
Figure 1
Workflow of the cross-phenotype meta-analysis Stage 1 | Combination of the summary statistics of two large NB and CAD GWAS data using two approaches: (1) meta-analysis study across NB and CAD and (2) meta-analysis study across NB and CAD with inverted effect in CAD. Stage 2 | Identification and prioritization of candidate causal SNPs using epigenomic data. Stage 3 | Replication study in an Italian cohort of 636 NB affected individuals and 1,080 control subjects by direct, PCR-based, genotyping.
Figure 2
Figure 2
rs13337017 showed long-range significant interactions with CFPD1 in SK-N-BE NB cell line The figure reports the genomic interactions from the rs13337017 point of view. The genomic tracks are named from top to bottom and described below. The genomic coordinates are from human genome hg19. The interaction matrix is centered on rs13337017 (chr16:75,272,366-75272367) and extended of 0.5 Mb up- and downstream. Genomic coverage is of 500 Kb and the matrix resolution is of 10 Kb (the interactions are calculated between bins of 10 Kb). Red-bordered triangles represent the Topologically Associated Domains (TADs). The arcs track shows the interactions between rs13337017 and CFPD1 annotated bins. The normalized number of interactions (a measure of the strength of interactions). The minus Log10 of the FDR adjusted p value. The region of 30,631 bp containing the list of 58 in Linkage Disequilibrium SNPs (LD SNPs) with rs13337017 is in green. The GeneHancer track reports the regulatory elements, from the GeneHancer database, showing strong associations with CFDP1 (see materials and methods). The NCBI RefSeq genes (we plotted the longest transcript for each gene). A brown-bordered rectangle highlights the CFDP1 locus. The ChIP peak-based tracks show, from top to bottom, the DNase-I hypersensitivity levels (DHS) sites of the SK-N-SH NB cell line in dark green (from ENCODE v3); the DHS signal of fetal adrenal gland (n = 5) tissues from Roadmap Epigenomics Consortium (GEO: GSM530653, GSM817165, GSM1027310, GSM1027311, GSM817167) in dark cyan; the H3K27ac data of NB cell lines (from GEO: GSE90683 and GSE65664) in red; and H3K27ac peaks from two human neural crest cells (NCCs) (from GEO: GSE90683) in purple. Data ranges and heatmap color keys are shown on the left of each track, when needed.
Figure 3
Figure 3
rs13337017 genotypes and CFDP1 expression association (A) Comparison of CFDP1 expression across trunk-NCC and craniofacial-NCC of murine embryos (GEO: GSE39191). (B) Violin plot reporting the eQTL analysis of rs13337017 in whole blood. (C) Violin plot showing eQTL analysis of rs13337017 in adrenal gland tissue. (D) Boxplots reporting CFDP1 expression grouped by rs13337017 genotypes of NB cell lines in GEO: GSE78061. (E) Barplots of luciferase reporter gene assays carried out in HEK293T and SK-N-AS. Data shown are the mean ± standard deviation from nine independent transfection experiments, each done in triplicate and compared with promoter-less control. ∗∗p < 0.001, t test. eQTL analysis performed with GTEx Release v7.
Figure 4
Figure 4
The depletion of CFDP1 correlates with decreased tumorigenicity in SK-N-AS NB cell line (A) Barplots showing the results of expression quantification by quantitative real-time PCR of CFDP1 Control (siScrambled) and CFDP1 silenced cells (siCFDP1). (B) CFDP1 protein levels assessed using western blot analysis in Scrambled and siCFDP1 cells. (C) Line plot reporting cell viability and proliferation measured by MTT assay in Scrambled and siCFDP1 cells. In (A) to (C), the data (mean of three experiments ± standard deviation) are represented as the fold change of siCFDP1 compared with control (siScrambled) cells. (D) Bright-light microscopy images reporting the results of wound-healing assay observed at different time points (6, 24, and 48 h). The wound distance was measured with ImageJ software. (E) Barplots reporting the quantifications of distances obtained in (D). The experiments in (D) and (E) were made in triplicate and conducted on untreated, siScrambled, and siCFDP1 SK-N-AS cells. (F) Barplot of the Caspase-3 activity assay on SK-N-AS cells. The data in siCFDP1 were normalized on the negative (promoter-less) control and reported in thousands (K). Data are shown as the mean ± standard deviation from three independent transfection experiments, each done in triplicate. In Panel (A), (C), (E), and (F), statistical significance was assessed by t test. ∗p < 0.05; ∗∗p < 0.001; ∗∗∗p < 0.0001.
Figure 5
Figure 5
The depletion of CFDP1 affects the expression of gene regulators of NB cell identity (A) Barplots showing the expression levels of CFDP1 in control (siScrambled) and CFDP1 silenced cells (siCFDP1) as measured by RNA-seq in SK-N-AS. (B) Heatmap of the differentially expressed genes grouped according to the k-means clustering algorithm. Color key on the left. (C) Dotplots reporting the Gene Ontology biological process enrichment results of clustered gene lists. (D) Barplot showing the results of expression quantification by quantitative real-time PCR for four up-regulated genes (red) and three down-regulated genes (blue) in SK-N-AS. (E) Expression quantification by quantitative real-time PCR of PHOX2B in SK-N-AS and SK-N-BE NB cell lines. (F) Expression quantification by quantitative real-time PCR of HAND2 in SK-N-AS, SK-N-BE, and SH-EP NB cell lines. (G) Expression quantification by quantitative real-time PCR of GATA3 in SK-N-AS, SK-N-BE, and SH-EP NB cell lines. The data in (D) to (G) are reported as fold-changes of induction in siCFDP1 compared with control cells. In Panel (A), (D), (E), (F), and (G) statistical significance was assessed using a t test. ∗p < 0.05; ∗∗p < 0.001; ∗∗∗p < 0.0001.

References

    1. Matthay K.K., Maris J.M., Schleiermacher G., Nakagawara A., Mackall C.L., Diller L., Weiss W.A. Neuroblastoma. Nat. Rev. Dis. Primers. 2016;2:16078. doi: 10.1038/nrdp.2016.78. - DOI - PubMed
    1. Capasso M., Diskin S.J. Genetics and genomics of neuroblastoma. Cancer Treat Res. 2010;155:65–84. doi: 10.1007/978-1-4419-6033-7_4. - DOI - PubMed
    1. Peifer M., Hertwig F., Roels F., Dreidax D., Gartlgruber M., Menon R., Kramer A., Roncaioli J.L., Sand F., Heuckmann J.M., et al. Telomerase activation by genomic rearrangements in high-risk neuroblastoma. Nature. 2015;526:700–704. doi: 10.1038/nature14980. - DOI - PMC - PubMed
    1. Lasorsa V.A., Cimmino F., Ognibene M., Mazzocco K., Erminio G., Morini M., Conte M., Iolascon A., Pezzolo A., Capasso M. 19p loss is significantly enriched in older age neuroblastoma patients and correlates with poor prognosis. NPJ Genom Med. 2020;5:18. doi: 10.1038/s41525-020-0125-4. - DOI - PMC - PubMed
    1. Pugh T.J., Morozova O., Attiyeh E.F., Asgharzadeh S., Wei J.S., Auclair D., Carter S.L., Cibulskis K., Hanna M., Kiezun A., et al. The genetic landscape of high-risk neuroblastoma. Nat. Genet. 2013;45:279–284. doi: 10.1038/ng.2529. - DOI - PMC - PubMed

Publication types

MeSH terms

Substances