. 2022 Nov 8:13:1011772.
doi: 10.3389/fimmu.2022.1011772. eCollection 2022.

Oropharyngeal tumor cells induce COX-2 expression in peripheral blood monocytes by secretion of IL-1α

Affiliations

Oropharyngeal tumor cells induce COX-2 expression in peripheral blood monocytes by secretion of IL-1α

James A DeVoti et al. Front Immunol. .

Abstract

Oropharyngeal squamous cell cancer (OPC) accounts for 3% of all cancers and greater than 1.5% of all cancer deaths in the United States, with marked treatment-associated morbidity in survivors. More than 80% of OPC is caused by HPV16. Tumors induced by HPV have been linked to impaired immune functions, with most studies focused on the local tumor microenvironment. Fewer studies have characterized the effects of these tumors on systemic responses in OPC, especially innate responses that drive subsequent adaptive responses, potentially creating feed-back loops favorable to the tumor. Here we report that elevated plasma levels of PGE2 are expressed in half of patients with OPC secondary to overexpression of COX-2 by peripheral blood monocytes, and this expression is driven by IL-1α secreted by the tumors. Monocytes from patients are much more sensitive to the stimulation than monocytes from controls, suggesting the possibility of enhanced immune-modulating feed-back loops. Furthermore, control monocytes pre-exposed to PGE2 overexpress COX-2 in response to IL-1α, simulating responses made by monocytes from some OPC patients. Disrupting the PGE2/IL-1α feed-back loop can have potential impact on targeted medical therapies.

Keywords: COX-2; IL-1 alpha; PGE 2; monocytes; oropharyngeal cancer.


Conflict of interest statement

The authors declare that the research was conducted in the absence of any commercial or financial relationships that could be construed as a potential conflict of interest.

Figures

Figure 1
Figure 1
Patients with OPC have elevated levels of plasma PGE2. (A) PGE2 levels in plasma were measured by ELISA. Bars indicate mean ± SD. Plasma levels are significantly increased in patients, 1409 ± 169 pg/mL, n=52, as compared to controls, 372 ± 63 pg/mL, n=24, (*p < 0.0001, two-tailed unpaired t-test). (B) The patients shown in “A” with more advanced cancer (Stage 2 or greater) are more likely to have high plasma PGE2 levels, which we have set at 800 pg/ml. Results shown are not significant due to relatively small numbers, but clearly patients with more advanced disease are more likely to have higher plasma levels. (C) Plasma levels were measured a second time in five patients who were free of disease at least 16 months after surgery and subsequent treatment. Levels dropped in those with elevated PGE2 initially, and mean difference pre vs. post approached significance (p=0.06, paired t-test).
Figure 2
Figure 2
Plasma PGE2 levels correlate with the presence of HPV and gain of function mutations or amplification of PIK3CA. (A) PGE2 levels for the 52 patients in Figure 1 were separated based on presence of HPV-16 in tumor biopsies. There was a significant difference between the two groups (*p=0.006, two-tailed unpaired t-test with Welch’s correction). (B) PGE2 levels were compared in 11 patients with either gene mutations or copy number amplifications, and 41 patients with normal sequence and copy-number. Bars indicate mean ± SD. Levels were significantly higher in the group with altered PIK3CA, 1919 ± 357 pg./mL, compared to wild-type, 1272 ± 188 pg/mL, (*p=0.014, Mann Whitney test).
Figure 3
Figure 3
Expression of COX-2 mRNA in OPC tissues and PBMC. (A) Levels of COX-2 mRNA were assessed by q-RT-PCR in biopsies of OPC tissues (n=10) and clinically normal contralateral tissue (normal adjacent) from patients with OPC (n=15), relative to normal tonsil tissues (n=8.) Bars indicate mean +/- SD. There was a significant increase in expression in the tumor tissues of patients (*p=0.048, unpaired t test with Welch’s correction). (B) COX-2 mRNA levels were measured in PBMC from patients with OPC (n=12) and expressed relative to the lowest measurable level in PBMC from controls (n=5). There was a statistically significant increase in the patients’ PBMC as compared to controls (*p<0.01, Mann-Whitney test).
Figure 4
Figure 4
Tumor cells induce increased COX-2 expression in control and patient-derived monocytes, patient monocytes are hyper-responsive. (A) Monocytes from controls were co-cultured with tumor cells derived from two OPC biopsies for 24 hrs. or incubated with conditioned medium obtained from the tumor cells, and COX-2 mRNA measured by q-RT-PCR (*p=0.004). Normal tonsil keratinocytes and conditioned medium from tonsil cells served as controls. Results shown are relative to monocytes incubated with fresh media. Each dot within a given condition indicates a different preparation of monocytes (n=6), bars indicate mean ± SD. Both the tumor cells and the conditioned medium significantly increased COX-2 mRNA (p=0.004, p=0.004 respectively, Mann-Whitney test). (B) Monocytes from controls were stimulated with conditioned media from 15 different tumor biopsy cultures or early passage tonsil keratinocytes (*p=0.002). Each dot within a given condition is a different preparation of monocytes. Bars indicate mean COX-2 mRNA levels relative to monocytes treated with fresh medium (not shown). (C) OPC patient-derived monocytes were stimulated with conditioned medium from the first nine tumors shown in “B” or with tonsil-conditioned media. Each dot within a given condition is a different preparation of monocytes. Bars indicate mean COX-2 mRNA levels relative to monocytes treated with fresh medium (not shown). (D) Data from tumor-conditioned media results in (B, C) was pooled for both control and patient monocytes and expressed relative to monocytes treated with fresh media (not shown). Bars indicate mean ± SD. There was a significantly increased response by patients’ monocytes compared to control monocytes (p=0.01, Mann-Whitney test).
Figure 5
Figure 5
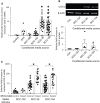
Conditioned media from tumor cell lines increase COX-2 mRNA levels in control and OPC monocytes. (A) Monocytes from controls were stimulated for 24 hrs. with conditioned medium from five OPC/oral cancer cell lines, and COX-2 mRNA levels measured by q-RT-PCR. Each dot within a given condition represents a different isolate of monocytes, bars indicate mean ± SD relative to media. There was a statistically significant increase in COX-2 expression following stimulation with conditioned media from tumor cell lines SCC-25 (*p=0.008) and CC-154 (*p=0.008, Mann-Whitney test). (B) Monocytes from four controls were stimulated with conditioned medium from three of the cell lines, or with fresh media (con.) and cell extracts analyzed by western blot to confirm that COX-2 protein is also elevated. Results shown are one representative blot and the quantification of relative fold increase in COX-2 protein from the four experiments. (C) Monocytes from controls and OPC patients were stimulated with conditioned medium from SCC-152, SCC-25 and SCC-154, or incubated with fresh media (not shown) for 24 hrs. COX-2 mRNA was measured by q-RT-PCR. Each dot within a given condition is a different isolate of monocytes. Bars indicate mean ± SD relative to fresh media. Expression was significantly increased in the patients’ monocytes compared to control monocytes when stimulated with conditioned media from SCC-25, (*p=0.003) and SCC-154, (*p=0.008, Mann-Whitney test) but not with conditioned medium from SCC-152.
Figure 6
Figure 6
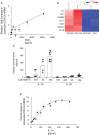
PGE2 is not the inducing factor. IL-1α present in conditioned medium of tumor lines SCC-25 and SCC-154 induces COX-2 expression in monocytes. (A) Control monocytes were stimulated with increasing concentrations of PGE2, and COX-2 mRNA measured by qPCR. Each dot represents the mean and SD of four measurements with different preparations of monocytes. There is a clear dose response, but the levels of COX-2 mRNA at doses below 2000 pg/mL are very low compared to the response of monocytes to conditioned media from tumor cells. The arrow indicates the mean level of PGE2 in conditioned medium from cultures of three tumor biopsies. (B) RNA-seq analysis of two OPC/oral cancer cell lines that induced COX-2 compared to two cell lines that did not. The top genes selectively expressed by the inducing lines are shown. (C) Concentrations of IL-1α and IL-1β in conditioned medium from cell lines and primary OPC biopsy cultures were measured by ELISA. Dots represent different batches of media; bars are mean ± SD. (D) Control monocytes were stimulated with increasing concentrations of recombinant IL-1α for 18 hrs., and COX-2 mRNA measured by q-RT PCR. Each dot is the mean ± SD of 3-4 measurements with separate isolates of monocytes. Approximately 50 pg/mL IL-1α is required to elicit a two-fold increase in COX-2 mRNA, saturating at 300-400 pg/mL.
Figure 7
Figure 7
Inhibiting IL-1 signaling when stimulating monocytes with tumor line-conditioned medium reduces expression of COX-2 but does not eliminate it. (A) Control monocytes from four individuals were treated with increasing concentrations of anakinra, a small molecule inhibitor of the IL-1 receptor, and then stimulated with conditioned medium from SCC-25 and SCC-154. COX-2 mRNA was measured by q-RT PCR. Bars indicate mean ± SD relative to control fresh medium. Only a subset of monocytes showed a reduction in COX-2 mRNA. (B) Control monocytes from four individuals were treated with anakinra as in “A”, then stimulated with increasing concentrations of recombinant IL-1α. Bars indicate mean ± SD relative to fresh medium (Con.) COX-2 mRNA levels were reduced almost to control levels at all concentrations of anakinra, confirming that the inhibitor is effective and in excess. (C) Conditioned medium from SCC-25 and SCC-154 was pre-incubated with increasing concentrations of rilonacept, a recombinant IL-1 trap, and used to stimulate control monocytes from five individuals. COX-2 mRNA was measured by q-RT PCR. Results are expressed relative to monocytes stimulated with fresh medium (Con.) Bars indicate mean ± SD. Only a subset of monocytes was completely blocked from responding. The highest level of COX-2 mRNA expression at each concentration of rilonacept represents monocytes from the same donor. (D) Monocytes from four patients were stimulated with rilonacept-treated conditioned medium as described in “C”. Results are expressed relative to monocytes stimulated with fresh medium (Con). Bars indicate mean ± SD. Again, there was heterogeneity in response of monocytes to reduction in IL-1α stimulation although all patient-derived monocytes showed complete inhibition with the highest concentration of rilonacept-treated medium from SCC-154. Together, this data suggests that IL-1 is a major tumor paracrine factor inducing COX-2 in monocytes, but monocytes from some individuals are responding to additional factors secreted from the tumor cells.
Figure 8
Figure 8
Pre-treatment of monocytes with PGE-2 increases the response to tumor line conditioned media and recombinant IL-1alpha. Control monocytes from four individuals were cultured for 20 hrs. ± 5,000 pg/mL PGE2, stimulated for 24 hrs with conditioned media from SCC152, SCC-25, SCC-154 or with 200 pg/mL IL-1α, and COX-2 mRNA measured by RT-Q-PCR. Bars indicate mean +/- SD relative to untreated cells with no stimulation (Con.) Pre-treatment with PGE2 significantly increased response to conditioned media from SCC25 and SCC154 and recombinant IL-1α (p<0.03), but not the response to conditioned medium from SCC152. *p<0.03.

Similar articles

Cited by

References

    1. Wang H, Wang S, Tang Y, Chen Y, Zheng M, Tang Y, et al. . The double-edged sword-how human papillomaviruses interact with immunity in head and neck cancer. Front Immunol (2019) 10:653. doi: 10.3389/fimmu.2019.00653 - DOI - PMC - PubMed
    1. Chow L. Head and neck cancer. New Engl J Med (2020) 382:60–72. doi: 10.1056/NEJMra1715715 - DOI - PubMed
    1. Mehta P, Tolar J. Fanconi anemia. GeneReviews (2002) 19:1–15.
    1. Bonagura VR, Du Z, Ashouri E, Luo L, Hatam LJ, Devoti JA, et al. . Activating killer cell immunoglobulin-like receptors 3DS1 and 2DS1 protect against developing the severe form of recurrent respiratory papillomatosis. Hum Immunol (2010) 71:212–9. doi: 10.1016/j.humimm.2009.10.009 - DOI - PMC - PubMed
    1. Bonagura VR, Hatam LJ, Rosenthal DW, De Voti JA, Lam F, Steinberg BM, et al. . Recurrent respiratory papillomatosis: a complex defect in immune responsiveness to human papillomavirus-6 and -11. APMIS (2010) 118:455–70. doi: 10.1111/j.1600-0463.2010.02617.x - DOI - PMC - PubMed

Publication types