. 2022 Nov 17:24:100545.
doi: 10.1016/j.lanepe.2022.100545. eCollection 2023 Jan.

Presentation, management, and outcomes of cauda equina syndrome up to one year after surgery, using clinician and participant reporting: A multi-centre prospective cohort study

Collaborators, Affiliations

Presentation, management, and outcomes of cauda equina syndrome up to one year after surgery, using clinician and participant reporting: A multi-centre prospective cohort study

Julie Woodfield et al. Lancet Reg Health Eur. .

Abstract

Background: Cauda equina syndrome (CES) results from nerve root compression in the lumbosacral spine, usually due to a prolapsed intervertebral disc. Evidence for management of CES is limited by its infrequent occurrence and lack of standardised clinical definitions and outcome measures.

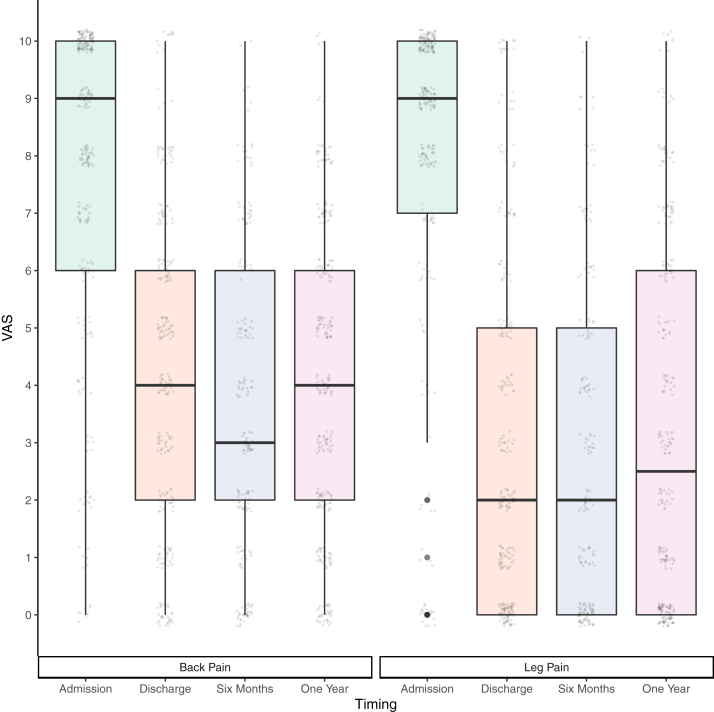
Methods: This is a prospective multi-centre observational cohort study of adults with CES in the UK. We assessed presentation, investigation, management, and all Core Outcome Set domains up to one year post-operatively using clinician and participant reporting. Univariable and multivariable associations with the Oswestry Disability Index (ODI) and urinary outcomes were investigated.

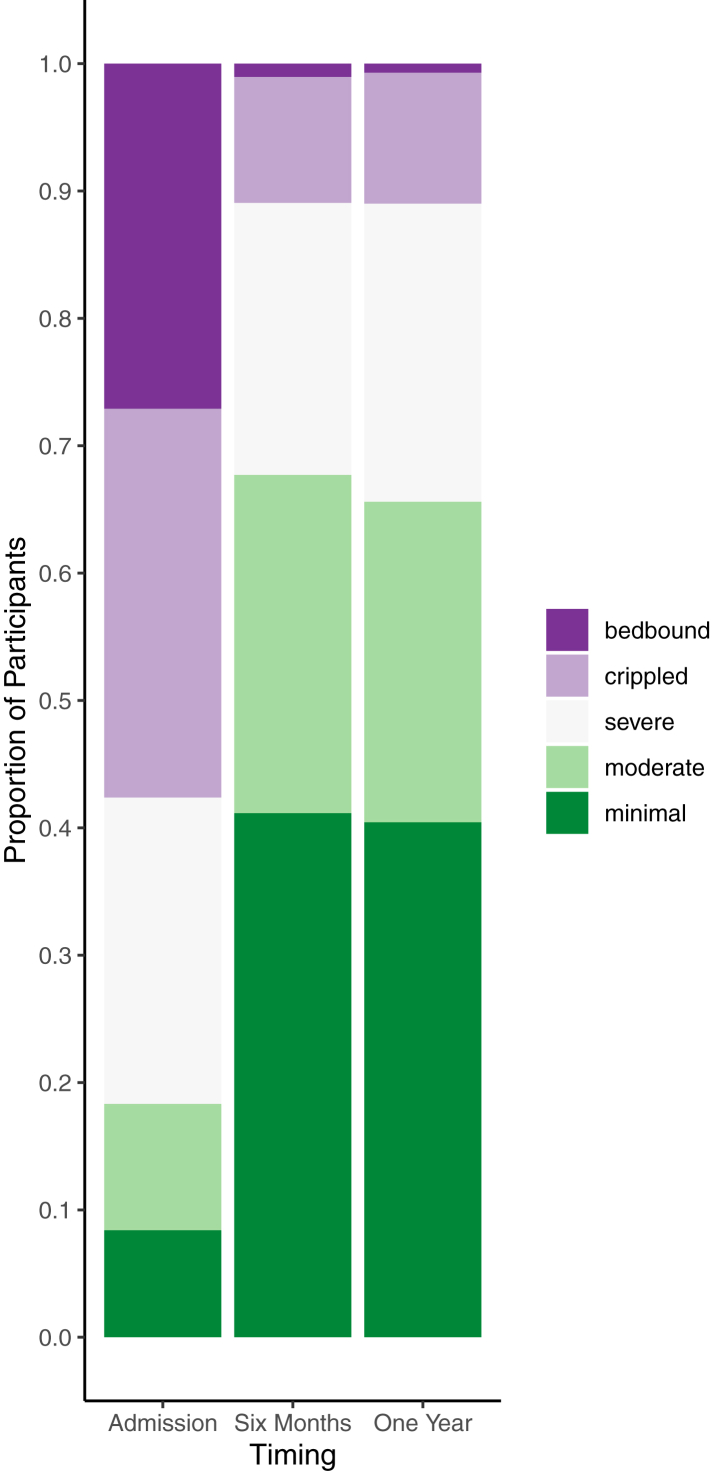
Findings: In 621 participants with CES, catheterisation for urinary retention was required pre-operatively in 31% (191/615). At discharge, only 13% (78/616) required a catheter. Median time to surgery from symptom onset was 3 days (IQR:1-8) with 32% (175/545) undergoing surgery within 48 h. Earlier surgery was associated with catheterisation (OR:2.2, 95%CI:1.5-3.3) but not with admission ODI or radiological compression. In multivariable analyses catheter requirement at discharge was associated with pre-operative catheterisation (OR:10.6, 95%CI:5.8-20.4) and one-year ODI was associated with presentation ODI (r = 0.3, 95%CI:0.2-0.4), but neither outcome was associated with time to surgery or radiological compression. Additional healthcare services were required by 65% (320/490) during one year follow up.

Interpretation: Post-operative functional improvement occurred even in those presenting with urinary retention. There was no association between outcomes and time to surgery in this observational study. Significant healthcare needs remained post-operatively.

Funding: DCN Endowment Fund funded study administration. Castor EDC provided database use. No other study funding was received.

Keywords: Back pain; Cauda equina syndrome; Cohort study; Spinal surgery; Urinary retention.


Conflict of interest statement

JW, AABJ, JJ, SL, SP, CJH, AW, LH, RDCM, SD, HR, PCC, MTCP, NS, GG, NE, and PJS declare no conflicts of interest during the study or within 3 years of the work being submitted. IH declares support for attending meetings and payment or honoraria for speaking about functional neurological disorders (including persistent postural perceptual dizziness) at conferences and meetings. IH has received payment for expert testimony on idiopathic urinary retention. PFXS has received payment for expert testimony, acting for a number of both claimants and defenders in cases of Cauda Equina Syndrome, roughly in the proportion 2/3 defender, 1/3 claimant over about 20 years. PT has received payment for expert testimony for Cauda Equina Syndrome cases for DAC Beachcroft, Aspire Law, Bevan Brittan LLP, Stephensons LLP, Moore Barlow Ltd, Scott Rees & Co, and Premex/Premex +. AKD declares payment or honoraria for speaking for Integra, Stryker, and Safe Orthopaedics. AKD declares leadership board roles (unpaid) for Global Neuro Foundation and European Association of Neurosurgical Societies.

Figures

Fig. 1
Fig. 1
Study Flow Diagram. Participant identification, eligibility, inclusion, and reasons for missing follow up data. Black outlines represent clinician entered data. Purple outlines represent participant entered data. Questionnaires and consent were available only in English, but non English speaking participants were included where local interpretation services were available. At one year, participants who had not completed paper or online questionnaires were telephoned to check if they still wished to participate and to check contact details for questionnaires. More detail at each study time point is available in Supplementary Fig. S1 (expanded flow diagram).
Fig. 2
Fig. 2
Oswestry Disability Index. Oswestry Disability Index (ODI) categories at admission, six months, and one year post operatively. ODI index scores were calculated by dividing the total score by the total possible score of completed items and multiplying by 100. ODI categories are: minimal disability (0–20%), moderate disability (21–40%), severe disability (41–60%), crippled (61–80%), and bed-bound 81–100%). Bars represent all participants completing the ODI at each time point. (Admission: n = 262, mean: 62.5, SD: 24.4; Six months: n = 192, mean:30.4, SD: 21.3; One year: n = 282, mean: 31.1, SD: 22.4). Data for those who returned all three questionnaires were similar (n = 168, Admission: mean: 62.5, SD: 25.7, Six months: mean: 30.2, SD: 21.4, One year: mean: 30.1, SD:21.2).
Fig. 3
Fig. 3
Pain Scores. The box plots show pain scores for back pain and worst leg pain at admission, discharge, six months, and one year post-operatively. Circles represent individual pain scores. Participants rated their pain on a scale of 0–10 using an electronic slider or marked on a paper scale. Only whole numbers could be selected. Scores for back pain and pain in the worst leg are shown. All participants who completed pain scores at each time point are shown (back pain: admission = 259, discharge = 253, six months = 193, one year = 278; leg pain: admission = 253, discharge = 253, six months = 187, one year = 272). Pain scores were similar for those completing all four time points (back pain: n = 153, median scores: admission = 9, discharge = 4, six months = 3, one year = 4; leg pain: n = 142, median scores: admission = 9, discharge = 2, six months = 2, one year = 2).
Fig. 4
Fig. 4
Mobility. Mobility is shown at admission, discharge, six months, and one year post-operatively. Both clinicians and participants reported mobility at admission and discharge on the same tick box scale. Bars represent all of those with data available at each time point (clinician reported: admission = 613, discharge = 610; participant reported: admission = 237; discharge = 247; six months = 171; one year = 245). The clinician reported mobility was similar for those with participant reported mobility available and not available (see Supplementary Fig. S2).
Fig. 5
Fig. 5
Time From Symptom Onset To Imaging and Operation. Time from symptom onset in hours is shown on the x axis. Each bar represents a single participant. Participants are ordered from shortest to longest time to operation. Time to imaging is shown in light blue and time from imaging to operation is shown in purple. The vertical dotted line marks 48 h from symptom onset. Only those undergoing surgery as an emergency or on the next day list are shown. Those undergoing surgery on a planned theatre date are not shown (n = 41). Those undergoing surgery with imaging that was performed prior to the onset of CES symptoms are not shown (n = 24). Times to surgery from symptom onset longer than 30 days (720 h) are not shown (n = 38). Where intervals in hours are available, these are plotted (n = 226). For participants where intervals are only available in days, these have been converted to hours by multiplying by 24, except zero days, which is represented as 12 h to allow visualisation of time to surgery (n = 203). Where intervals were converted from days to hours and hours to imaging and surgery were the same, the time to imaging is set 4 h prior to surgery to allow data visualisation (n = 101).

References

    1. Gleave J.R., Macfarlane R. Cauda equina syndrome: what is the relationship between timing of surgery and outcome? Br J Neurosurg. 2002;16(4):325–328. [published Online First: 2002/10/23] - PubMed
    1. Fraser S., Roberts L., Murphy E. Cauda equina syndrome: a literature review of its definition and clinical presentation. Arch Phys Med Rehabil. 2009;90(11):1964–1968. doi: 10.1016/j.apmr.2009.03.021. [published Online First: 2009/11/06] - DOI - PubMed
    1. Machin J.T., Hardman J., Harrison W., et al. Can spinal surgery in England be saved from litigation: a review of 978 clinical negligence claims against the NHS. Eur Spine J. 2018;27(11):2693–2699. doi: 10.1007/s00586-018-5739-1. [published Online First: 2018/08/29] - DOI - PubMed
    1. McCarthy M.J., Aylott C.E., Grevitt M.P., et al. Cauda equina syndrome: factors affecting long-term functional and sphincteric outcome. Spine. 2007;32(2):207–216. doi: 10.1097/01.brs.0000251750.20508.84. - DOI - PubMed
    1. Qureshi A., Sell P. Cauda equina syndrome treated by surgical decompression: the influence of timing on surgical outcome. Eur Spine J. 2007;16(12):2143–2151. doi: 10.1007/s00586-007-0491-y. [published Online First: 20070909] - DOI - PMC - PubMed