. 2022 Dec 31;43(12):1198-1210.
doi: 10.1093/carcin/bgac092.

Dysregulation of HNF1B/Clusterin axis enhances disease progression in a highly aggressive subset of pancreatic cancer patients

Affiliations

Dysregulation of HNF1B/Clusterin axis enhances disease progression in a highly aggressive subset of pancreatic cancer patients

Shouhui Yang et al. Carcinogenesis. .

Abstract

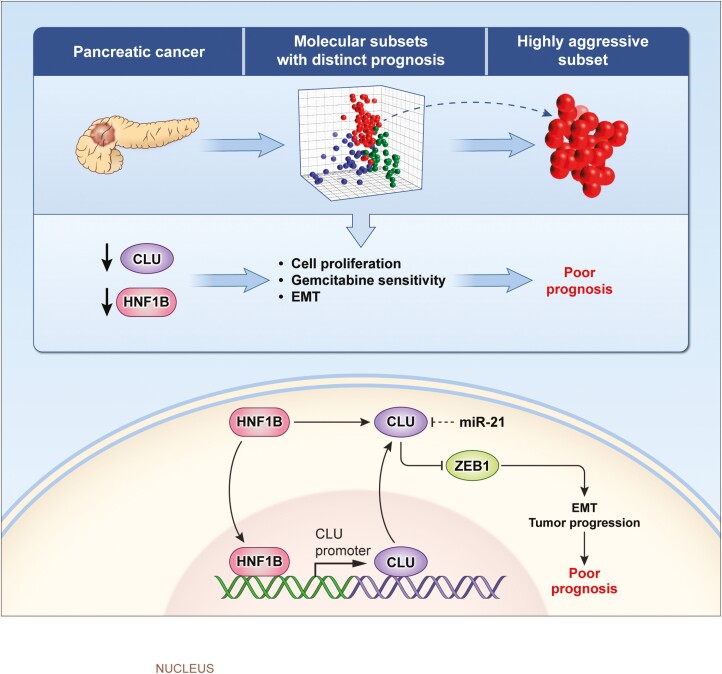
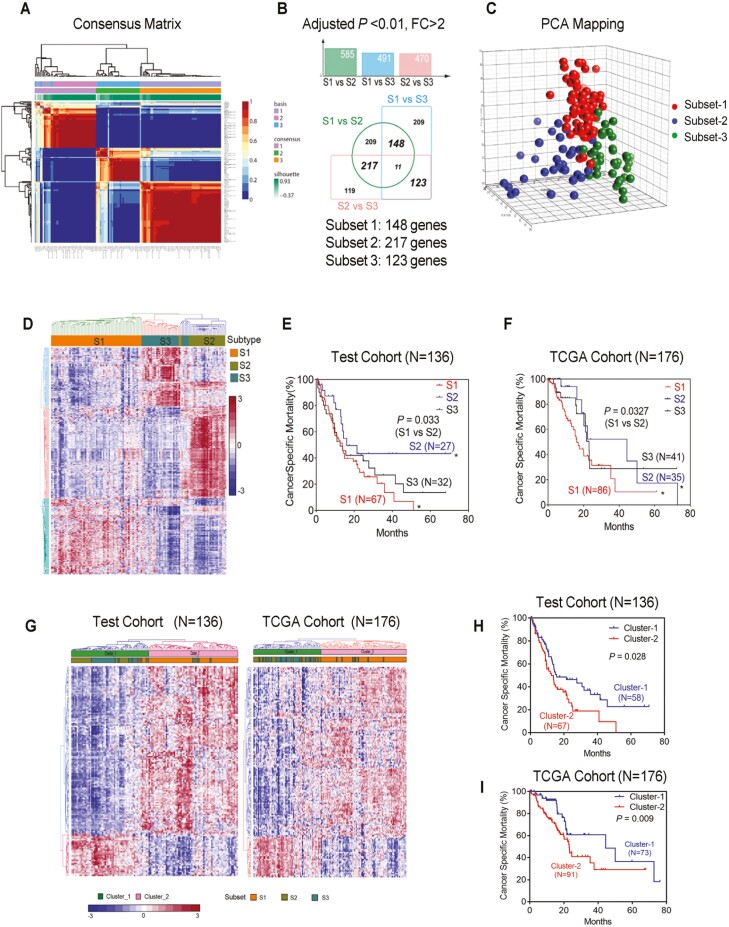
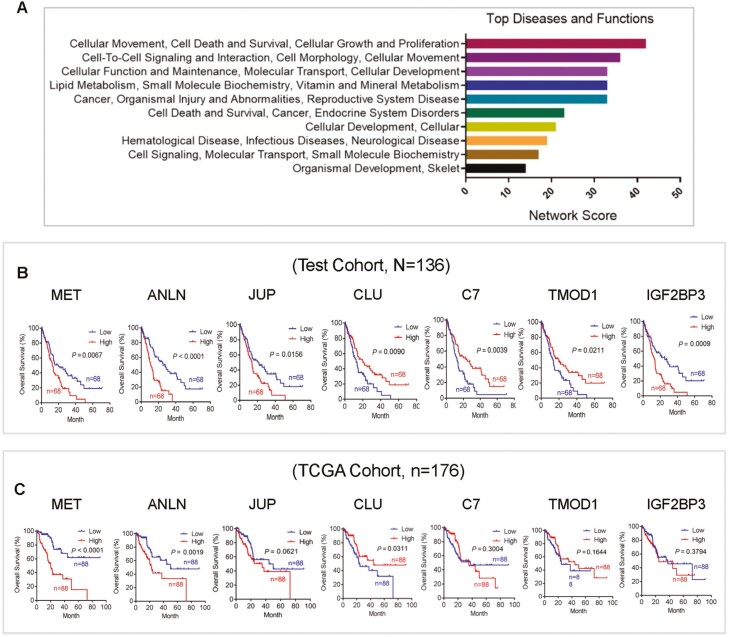
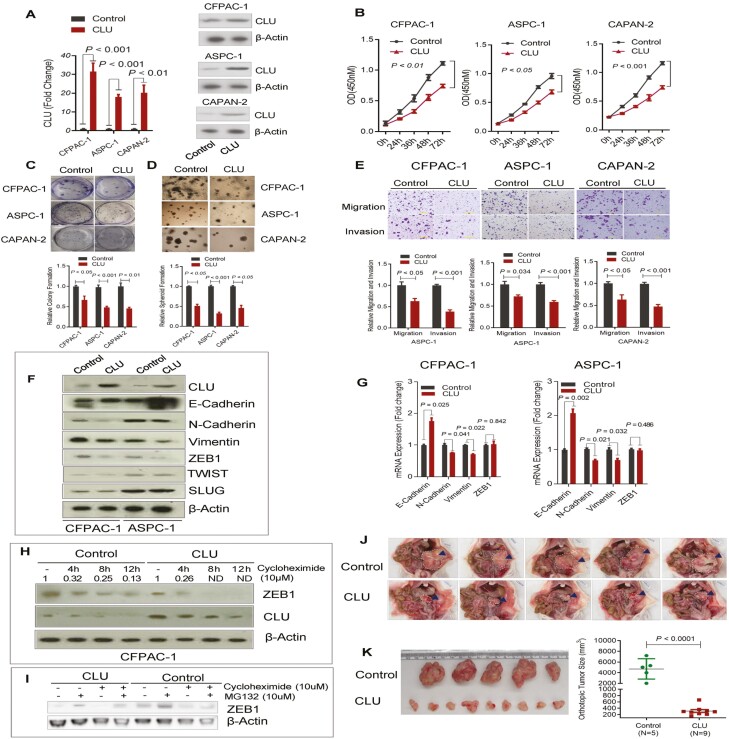
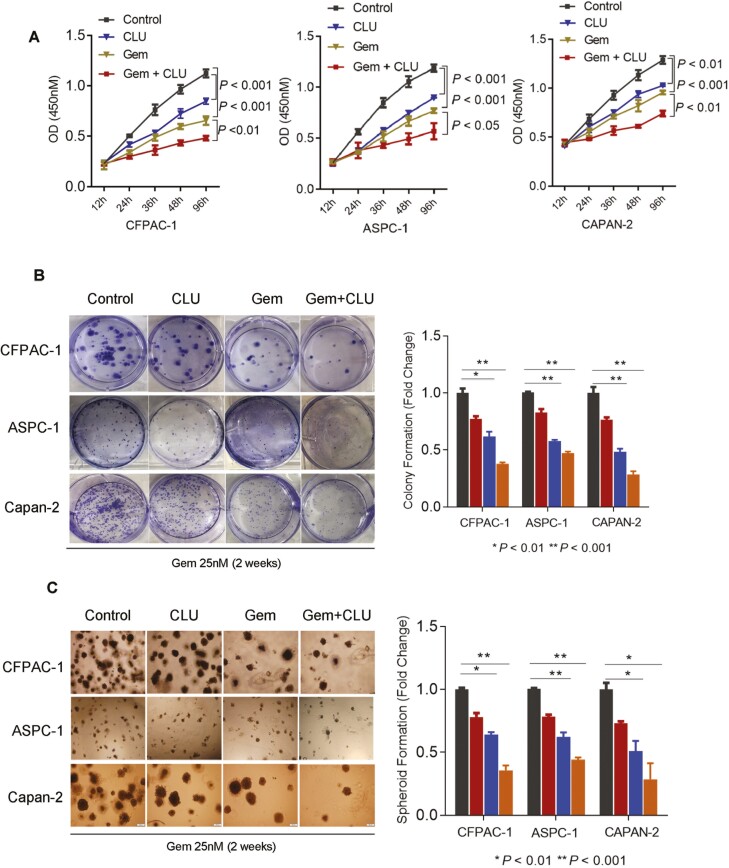
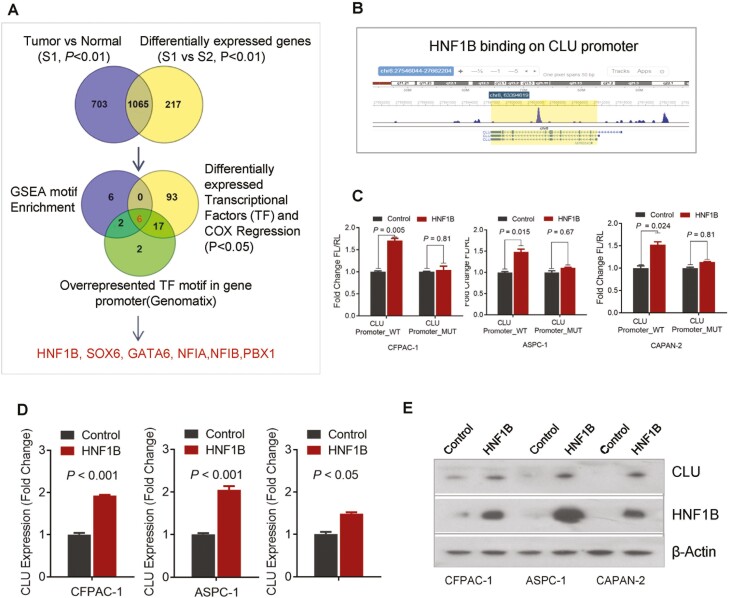
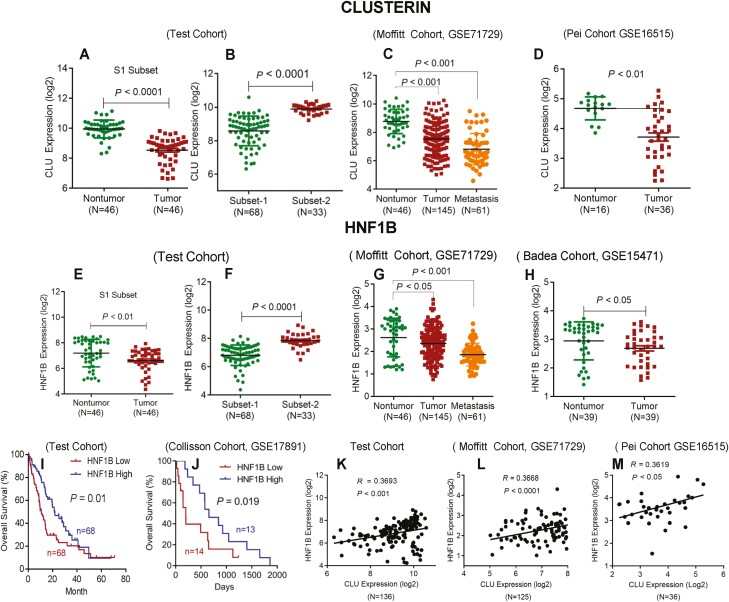
Pancreatic ductal adenocarcinoma (PDAC) is a lethal malignancy and is largely refractory to available treatments. Identifying key pathways associated with disease aggressiveness and therapeutic resistance may characterize candidate targets to improve patient outcomes. We used a strategy of examining the tumors from a subset of PDAC patient cohorts with the worst survival to understand the underlying mechanisms of aggressive disease progression and to identify candidate molecular targets with potential therapeutic significance. Non-negative matrix factorization (NMF) clustering, using gene expression profile, revealed three patient subsets. A 142-gene signature specific to the subset with the worst patient survival, predicted prognosis and stratified patients with significantly different survival in the test and validation cohorts. Gene-network and pathway analysis of the 142-gene signature revealed dysregulation of Clusterin (CLU) in the most aggressive patient subset in our patient cohort. Hepatocyte nuclear factor 1 b (HNF1B) positively regulated CLU, and a lower expression of HNF1B and CLU was associated with poor patient survival. Mechanistic and functional analyses revealed that CLU inhibits proliferation, 3D spheroid growth, invasiveness and epithelial-to-mesenchymal transition (EMT) in pancreatic cancer cell lines. Mechanistically, CLU enhanced proteasomal degradation of EMT-regulator, ZEB1. In addition, orthotopic transplant of CLU-expressing pancreatic cancer cells reduced tumor growth in mice. Furthermore, CLU enhanced sensitivity of pancreatic cancer cells representing aggressive patient subset, to the chemotherapeutic drug gemcitabine. Taken together, HNF1B/CLU axis negatively regulates pancreatic cancer progression and may potentially be useful in designing novel strategies to attenuate disease progression in PDAC patients.


Conflict of interest statement

The authors declare no competing financial interest.

Figures

None
Dysregulation of HNF1B/CLU Axis enhances disease progression in PDAC. A decrease in CLU level enhances cell proliferation and EMT, and reduces sensitivity to gemcitabine resulting in enhanced progression and poor patients outcome.
Figure 1.
Figure 1.
Gene expression profile identified subsets of PDAC patients with distinct prognosis. (A) Non-negative matrix factorization (NMF) analysis of 139 PDAC cases from microarray dataset after selecting for genes with SD greater than 0.6. Consensus matrix for cophenetic coefficient occurred for k = 3 are shown. (B) Subset specific signature (subset-1, S1, 148 genes; subset-2, S2, 217 genes; subset-3, S3, 123 genes) showed by Venn diagram illustrating the overlapped genes among S1, S2, S3 subsets. Differentially expressed genes between each of the subsets were identified by using ANOVA (adjusted P < 0.01, fold change >2). (C) Principal components analysis of mRNA expression profile using subset signature reveals three molecular subsets of tumors as shown by consensus clusters. (D) Hierarchical clustering analysis showing distinct gene expression profiles, using three specific subset gene-signature. (E and F) Kaplan-Meier survival curve comparing survival of patients in S1, S2 and S3 subsets in the test and TCGA cohort. P value is obtained by Log-rank test. (G) Hierarchical clustering analysis using 148 S1 gene-signature showing two distinct clusters (cluster-1 and cluster-2) of PDAC cases in both our test cohort (N = 136) and TCGA validation cohort (N = 176). (H and I) Kaplan-Meier survival curve comparing survival of PDAC cases in cluster-1 and cluster-2, in the test and validation cohorts. P values were obtained using Log Rank test.
Figure 2.
Figure 2.
CLU is one of the candidate genes associated with patient outcome. (A) Ingenuity Pathway Analysis of 148 S1-Specific genes identified top network genes associated with cellular movement, growth and proliferation, cell death and survival ranked by network score. (B and C) Kaplan-Meier survival analysis of the top network genes associated with survival (Cox regression analysis), including MET, ANLN, JUP, CLU, C7, TMOD1, IGF2BP3, in test (N = 136) and validated cohort (N = 176). A lower expression of CLU and higher expression of MET and ANLN associated with poor survival in both test and validation cohorts.
Figure 3.
Figure 3.
CLU inhibits proliferation, 3D spheroid growth, migration and invasion and suppresses epithelial-to-mesenchymal transition. (A) Lenti-viral mediated generation of stable pancreatic cancer cell lines overexpressing CLU as determined by quantitative real-time PCR (qRT-PCR) (left panel) and immunobloting (right panel). (B) CLU overexpression suppresses the proliferation of CFPAC-1, ASPC-1 and CAPAN-2 cells. (C) CLU-overexpressing cells showed reduced colony formation as compared with control cells. (D) CLU significantly suppresses spheroid formation in CFPAC-1, ASPC-1 and CAPAN-2 cell lines. (E) CLU overexpression suppresses migration and invasion as assessed by in vitro transwell assays. (FH) CLU regulates EMT through promoting ZEB1 degradation. F, CLU-overexpression resulted in an increase in E-cadherin and decrease in N-cadherin, Vimentin and ZEB1 expression at the protein level as determined by immunoblotting. G, CLU enhances E-cadherin and suppresses N-Cadherin and Vimentin mRNA level as assessed by qRT-PCR. CLU overexpression showed no marked effect on the mRNA level of ZEB1. H, CLU overexpressing or control cells were treated with the 10 µm protein synthesis inhibitor cycloheximide for indicated time period, the protein expression of ZEB1 was measured by Western blot analysis and normalized to actin loading control (ND, not detectable). (I) CFPAC-1 control or CLU-overexpressing cells were treated with 10 μM proteasome inhibitor MG132 and Cycloheximide either alone or in combination for 8 h. ZEB1 expression was determined by western blot. (JK) CLU inhibits pancreatic tumor growth in orthotopic mouse model. CLU significantly inhibited orthotopic tumor growth of CLU-overexpressing cells as compared with controls. (J and K) Orthotopic xenograft of 1 million cells implanted in the pancreas of nude mice showed a significant decrease in the growth of tumors arising from CLU expressing pancreatic cancer cells as compared with control cells. Data represent Mean ± SD.
Figure 4.
Figure 4.
CLU enhances sensitivity to Gemcitabine in pancreatic cancer cell lines. (AC) CLU overexpressing cells showed a higher sensitivity to chemotherapeutic drug gemcitabine (25 nM) as compared with control cells, determined by cell survival index (A), colony formation assay (B) and spheroid formation (C). Data are presented as means ± SD from three independent experiments.
Figure 5.
Figure 5.
HNF1B regulates CLU in pancreatic cancer. (A) Schema depicting integrative approach to identify putative key transcriptional regulator for subset-1 gene signature. Venn diagram showing the integrative bioinformatics strategy, which resulted in the identification of putative transcriptional factors. Pancreatic cancer specific genes from subset-1 patients (Tumor versus normal, P < 0.01) were compared with genes differentially expressed between subsets S1 and S2, which resulted in the identification of 1037 genes, these genes were further subjected to Gene Set Enrichment Analysis (GSEA) motif enrichment assessment, overrepresented transcriptional factor motif analysis by Genomatix, and overlaped with differentially expressed transcriptional factors associated with survival (Cox regression analysis). HNF1B, SOX6, GATA6, NF1A, NF1B and PBX1 were identified as candidate regulators for subset-1 gene signature. (B) Identification of the HNF1B-binding site in the promoter regions of CLU using publicly available data set (18). (C) HNF1B enhanced the luciferase reporter activity of pGL-4-Basic construct containing wild-type CLU promoter sequence but had no effect on mutant construct in CFPAC-1, ASPC-1 and CAPAN-2 cell lines. (D, E) An increase in endogenous CLU mRNA and protein expression by HNF1B overexpression as shown by qRT-PCR and immunoblotting in pancreatic cancer cell lines.
Figure 6.
Figure 6.
Clinical relevance of HNF1B/CLU axis in human pancreatic cancer. (A) A reduced expression of CLU was found in tumor as compared with nontumor tissue. (B) A lower expression of CLU was detected in subset-1 as compared with subset-2 patients in the test cohort (left two panels). (C and D) Validation of CLU expression in publicly available datasets. Metastatic tumors expressed a lower level of CLU as compared with primary tumors and adjacent nontumors pancreas in GSE71729 dataset (C). A lower expression of CLU was found in tumor versus nontumor in GSE16515 Dataset. Dot plots represent the normalized log 2 transformed CLU expression values obtained by gene expression microarray analysis (D). (E) A lower level of HNF1B was found in tumors as compared with adjacent nontumor pancreas. (F) A lower expression of HNF1B in subset-1 as compared with subset-2 patients in the test cohort (left two panels). (G and H) Validation of HNF1B expression in publicly available datasets. A lower level of CLU was found in primary tumors and metastatic tumors as compared with nontumor pancreas in GSE71729 dataset (G); a lower expression of CLU was found in tumor as compared with nontumor pancreas in GSE15471 Dataset (H). (I and J) Kaplan-Meier survival analysis showing a significantly poorer survival in patients with a lower (<median) as compared to patients with a higher HNF1B expression (>median) in test and validation cohorts (Log Rank test). (KM) Pearson correlation analysis showing a positive correlation between CLU and HNF1B expression level in the test and validation cohorts (publicly available datasets GSE71729 and GSET16515). Each data point represents an individual patient with PDAC.

References

    1. Siegel, R.L., et al. . (2022) Cancer statistics, 2022. CA Cancer J. Clin., 72, 7–33. - PubMed
    1. Rahib, L., et al. . (2014) Projecting cancer incidence and deaths to 2030: the unexpected burden of thyroid, liver, and pancreas cancers in the United States. Cancer Res., 74, 29134006–29132921. - PubMed
    1. Bailey, P., et al. . (2016) Genomic analyses identify molecular subtypes of pancreatic cancer. Nature, 531, 47–52. - PubMed
    1. Cancer Genome Atlas Research Network. et al.. (2017) Integrated genomic characterization of pancreatic ductal adenocarcinoma. Cancer Cell, 32, 185–203.e13. - PMC - PubMed
    1. Collisson, E.A., et al. . (2011) Subtypes of pancreatic ductal adenocarcinoma and their differing responses to therapy. Nat. Med., 17, 500–503. - PMC - PubMed

Publication types