. 2023 Jan 3;7(1):pkac080.
doi: 10.1093/jncics/pkac080.

Prediction of tissue-of-origin of early stage cancers using serum miRNomes

Collaborators, Affiliations

Prediction of tissue-of-origin of early stage cancers using serum miRNomes

Juntaro Matsuzaki et al. JNCI Cancer Spectr. .

Abstract

Background: Noninvasive detection of early stage cancers with accurate prediction of tumor tissue-of-origin could improve patient prognosis. Because miRNA profiles differ between organs, circulating miRNomics represent a promising method for early detection of cancers, but this has not been shown conclusively.

Methods: A serum miRNA profile (miRNomes)-based classifier was evaluated for its ability to discriminate cancer types using advanced machine learning. The training set comprised 7931 serum samples from patients with 13 types of solid cancers and 5013 noncancer samples. The validation set consisted of 1990 cancer and 1256 noncancer samples. The contribution of each miRNA to the cancer-type classification was evaluated, and those with a high contribution were identified.

Results: Cancer type was predicted with an accuracy of 0.88 (95% confidence interval [CI] = 0.87 to 0.90) in all stages and an accuracy of 0.90 (95% CI = 0.88 to 0.91) in resectable stages (stages 0-II). The F1 score for the discrimination of the 13 cancer types was 0.93. Optimal classification performance was achieved with at least 100 miRNAs that contributed the strongest to accurate prediction of cancer type. Assessment of tissue expression patterns of these miRNAs suggested that miRNAs secreted from the tumor environment could be used to establish cancer type-specific serum miRNomes.

Conclusions: This study demonstrates that large-scale serum miRNomics in combination with machine learning could lead to the development of a blood-based cancer classification system. Further investigations of the regulating mechanisms of the miRNAs that contributed strongly to accurate prediction of cancer type could pave the way for the clinical use of circulating miRNA diagnostics.


Figures

Figure 1.
Figure 1.
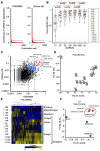
Cancer types can be classified by serum miRNA profiles using machine learning. A) Schematic view of the HEAD machine learning system. The system consists of multiple classifiers with the same architecture. Red narrow boxes with broken lines in the middle and right represent copies of the classifier on the left. Each classifier consists of 3 stages: unsupervised feature extraction in the first stage, various learners in the second stage, and a single classifier in the third stage. The output of previous stages is fed into the next stage. Learners in the figures can be of different types (eg, random forest, logistic regression, extra tree classifier, support vector classifier, k-NN, GBDT, and MLP). The results of prediction classifiers are aggregated using the voting method. For comparison, schematic views of a single classifier and an ensemble learning model are also shown. B) PCA plot showing that miRNA profiles in the GSE59856 dataset do not exhibit clear separation among cancer types. C) Two machine learning–based prediction models (HEAD and GBDT), developed using the training set, were applied to the validation set. The diagnostic sensitivities of 6 cancer types with HEAD and GBDT are shown. BT = biliary tract cancer; CR = colorectal cancer; ES = esophageal squamous cell carcinoma; GA = gastric cancer; GBDT = gradient boosting decision tree; HC = hepatocellular carcinoma; HEAD = Hierarchical Ensemble Algorithm with Deep learning; k-NN = k-nearest neighbors; miRNA = microRNA; MLP = multilayer perceptron; N = benign disease; NT = nontumor; PA = pancreatic cancer; PCA = principal component analysis.
Figure 2.
Figure 2.
The HEAD model enables accurate discrimination of 13 cancer types in the validation set. A) The true prediction rate for each of 13 kinds of solid cancer was greater than 0.8 except for BT, HC, and SA in HEAD. NT samples and PR_N were perfectly discriminated as nontumor. BR_N, GL_N, and OV_N samples were mainly diagnosed as cancer samples in the corresponding organs. B) ROC curve analysis of the HEAD model for discrimination of each cancer type. The discrimination performance for each cancer type among all cancer samples and noncancer samples is indicated after the exclusion of NT control samples. The AUC for detecting each cancer type was greater than 0.95. Numbers inside parentheses indicate 95% confidence interval of AUC. C) The proportion of each sex did not differ between patients diagnosed correctly and incorrectly by HEAD. P, Fisher exact test. D) Age distribution did not differ between correctly and incorrectly diagnosed patients in HEAD. P, student t test. E) The diagnostic sensitivities calculated by HEAD were not associated with the disease stage of cancer samples, indicating that serum miRNA-based tests are feasible for early detection of cancer. P, one-way analysis of variance. F) The diagnostic performance for earlier stage cancers (stages 0, I, and II) and later stage cancers (stages III and IV). The true prediction rate was greater than 0.75 except for BT and HC even in the earlier stage. AUC = area under the ROC curve; BL = bladder cancer; BR = breast cancer; BT = biliary tract cancer; CR = colorectal cancer; ES = esophageal squamous cell carcinoma; GA = gastric cancer; GL = intraparenchymal brain tumor such as glioma; HC = hepatocellular carcinoma; HEAD = Hierarchical Ensemble Algorithm with Deep learning; LU = lung cancer; miRNA = microRNA; N = benign disease; NT = nontumor; OV = ovarian cancer; PA = pancreatic cancer; PR = prostate cancer; ROC = receiver operating characteristic; SA = sarcoma.
Figure 3.
Figure 3.
Correlations between the probability scores and disease stages. Violin plots indicating the distribution of the probability scores in each disease stage in each cancer type. For GL, a violin plot indicating the distribution of the probability scores in each histological subgroup. In BT and PA, the scores were lower in the early stage than in the late stage. Correlation coefficient (R) and P values were calculated by Pearson correlation analysis. Statistically significant R and P values are shown in red. P, one-way analysis of variance. BL = bladder cancer; BR = breast cancer; BT = biliary tract cancer; CR = colorectal cancer; ES = esophageal squamous cell carcinoma; GA = gastric cancer; GL = intraparenchymal brain tumor such as glioma; HC = hepatocellular carcinoma; LU = lung cancer; Meta = metastatic brain tumor; OV = ovarian cancer; PA = pancreatic cancer; PCNSL = primary central nervous system lymphoma; PR = prostate cancer; SA = sarcoma; WHO = World Health Organization.
Figure 4.
Figure 4.
Schematic view of the domain adversarial neural network (DANN). A) The DANN consists of a common feature extraction network (stage 1) and a combination of a classifier for cancer diagnosis prediction and a domain classifier for predicting the source of the dataset (stage 2). A gradient reversal layer reverses the sign of the error back to propagation from the domain prediction bifurcation thus reducing the accuracy of the domain prediction as much as possible. This enables extracting the characteristics of the cancer regardless of the influence of the domain. B) Differences in the true prediction rate for each cancer type between before and after DANN analysis in the GSE59856 dataset. Transfer learning of the DDDmir-DB improved the diagnostic performance in the GSE59856 dataset. Statistically significant P values are shown in red. P, student t test. BT = biliary tract cancer; CR = colorectal cancer; DDDmir-B = Development and Diagnostic Technology for Detection of miRNA in Body Fluids; ES = esophageal squamous cell carcinoma; GA = gastric cancer; HC = hepatocellular carcinoma; miRNA = microRNA; MLP = multilayer perceptron; NT = nontumor; PA = pancreatic cancer.
Figure 5.
Figure 5.
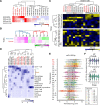
Extraction of highly contributing serum miRNAs for cancer classification. A) The contribution of each miRNA to multiclass discrimination was calculated based on the information obtained by splits in nodes in decision trees. The mean contributions in fivefold cross-validation were plotted. B) Diagnostic sensitivities computed by the HEAD model using the indicated number of strongly contributing miRNAs in DDDmir-DB. Sensitivities reached the optimal levels when 100 miRNAs were used. Statistically significant P values are shown in red. P, paired t test with Bonferroni correction. C) The correlation of the contribution to multiclass discrimination between 2 datasets. miRNAs with a contribution greater than 0.05 or 0.01 for both datasets were plotted as red dots or blue dots, respectively. D) PCA plot of the average serum miRNA levels in 13 cancer types. E) Heatmap with unsupervised clustering of the average serum miRNA levels in 12 cancer types after excluding GL. F) PCA plot of the average serum miRNA levels in histological subtypes of LU (with KRAS- and EGFR-mutation status). BL = bladder cancer; BR = breast cancer; BT = biliary tract cancer; CR = colorectal cancer; DDDmir-B = Development and Diagnostic Technology for Detection of miRNA in Body Fluids; KRAS = V-Ki-Ras2 Kirsten Rat Sarcoma Viral Oncogene Homolog; EGFR = Epidermal Growth Factor Receptor; ES = esophageal squamous cell carcinoma; GA = gastric cancer; HC = hepatocellular carcinoma; HEAD = Hierarchical Ensemble Algorithm with Deep learning; LU = lung cancer; LUad = lung adenocarcinoma; LUsc = lung small cell carcinoma; LUsq = lung squamous cell carcinoma; miRNA = microRNA; mut = mutation; N = benign disease; OV = ovarian cancer; PA = pancreatic cancer; PCA = principal component analysis; PR = prostate cancer; SA = sarcoma; WT = wild type.
Figure 6.
Figure 6.
Comparison of miRNomes between serum and tissue. A) Unsupervised hierarchical clustering analysis of the contributions of the highly contributing 18 miRNAs for multiclass discrimination. Contributions were calculated for all-class in GSE59856, all-class in DDDmir-DB, or 13-class (among cancer samples) in DDDmir-DB. B) Clustering analysis of the correlation coefficient between tissue and serum miRNA levels for each cancer type. In the blue-lined cluster, the correlation coefficient between serum miRNAs and noncancer tissue miRNAs in the corresponding organ was higher than that between serum miRNAs and cancer tissue miRNAs in the corresponding organ. The opposite pattern was observed in the red-lined cluster. C) Clustering analysis of TCGA miRNA data. Red-letter miRNAs are the serum miRNAs that contributed the most to cancer discrimination. D) Clustering analysis of Database of Small Human Noncoding RNAs (v2.0) miRNA data. Red-letter miRNAs are the serum miRNAs that contributed the most to cancer discrimination. E) Distribution of miR-122-5p levels in each cancer type. Gray background indicates the upper quartile and median levels among all samples. x-axis labels indicate the true diagnosis (red letters = greater than upper quartile; blue letters = less than median among all samples). Dot colors and shapes indicate the test results. F) Serum levels of miR-122-5p in each stage in BT or HC participants. P, one-way analysis of variance. AUC = area under the ROC curve; BL = bladder cancer; BR = breast cancer; BT = biliary tract cancer; CR = colorectal cancer; DDDmir-DB = Development and Diagnostic Technology for Detection of miRNA in Body Fluids; ES = esophageal squamous cell carcinoma; GA = gastric cancer; GL = intraparenchymal brain tumor such as glioma; HC = hepatocellular carcinoma; HEAD = Hierarchical Ensemble Algorithm with Deep learning; LU = lung cancer; LUad = lung adenocarcinoma; LUsq = lung squamous cell carcinoma; miR = mature miRNA; miRNA = microRNA; N = benign disease; NT = nontumor; OV = ovarian cancer; PA = pancreatic cancer; PBMC = peripheral blood mononuclear cells; PR = prostate cancer; ROC = receiver operating characteristic; SA = sarcoma; TCGA = The Cancer Genome Atlas.

Comment in

References

    1. Raoof S, Kennedy CJ, Wallach DA, et al.Molecular cancer screening: in search of evidence. Nat Med. 2021;27(7):1139-1142. - PubMed
    1. Cohen JD, Li L, Wang Y, et al.Detection and localization of surgically resectable cancers with a multi-analyte blood test. Science. 2018;359(6378):926-930. - PMC - PubMed
    1. Cristiano S, Leal A, Phallen J, et al.Genome-wide cell-free DNA fragmentation in patients with cancer. Nature. 2019;570(7761):385-389. - PMC - PubMed
    1. Lennon AM, Buchanan AH, Kinde I, et al.Feasibility of blood testing combined with PET-CT to screen for cancer and guide intervention. Science. 2020;369(6499):eabb9601. - PMC - PubMed
    1. Shen SY, Singhania R, Fehringer G, et al.Sensitive tumour detection and classification using plasma cell-free DNA methylomes. Nature. 2018;563(7732):579-583. - PubMed

Publication types