. 2022 Nov 25;8(47):eabo5284.
doi: 10.1126/sciadv.abo5284. Epub 2022 Nov 25.

Tolerogenic nanoparticles induce type II collagen-specific regulatory T cells and ameliorate osteoarthritis

Affiliations

Tolerogenic nanoparticles induce type II collagen-specific regulatory T cells and ameliorate osteoarthritis

Hee Su Sohn et al. Sci Adv. .

Abstract

Local inflammation in the joint is considered to contribute to osteoarthritis (OA) progression. Here, we describe an immunomodulating nanoparticle for OA treatment. Intradermal injection of lipid nanoparticles (LNPs) loaded with type II collagen (Col II) and rapamycin (LNP-Col II-R) into OA mice effectively induced Col II-specific anti-inflammatory regulatory T cells, substantially increased anti-inflammatory cytokine expression, and reduced inflammatory immune cells and proinflammatory cytokine expression in the joints. Consequently, LNP-Col II-R injection inhibited chondrocyte apoptosis and cartilage matrix degradation and relieved pain, while injection of LNPs loaded with a control peptide and rapamycin did not induce these events. Adoptive transfer of CD4+CD25+ T cells isolated from LNP-Col II-R-injected mice suggested that Tregs induced by LNP-Col II-R injection were likely responsible for the therapeutic effects. Collectively, this study suggests nanoparticle-mediated immunomodulation in the joint as a simple and effective treatment for OA.


Figures
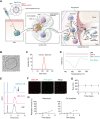
Fig. 1.
Fig. 1.. The hypothesis of this study and characterization of LNPs loaded with type II collagen peptide (Col II) and rapamycin (LNP-Col II-R).
(A) Hypothesis of this study. Intradermal injection of LNP-Col II-R to OA mice would induce Col II–specific Tregs. The Tregs in the synovium would inhibit M1 macrophages and TH1 cells, both of which express inflammatory cytokines (e.g., TNF-α, IFN-γ, and IL-1β) and inhibit chondrocyte apoptosis and matrix destruction in the OA articular cartilage. (B) TEM image and (C) size distribution of LNP-Col II-R. Scale bars, 50 nm. Confirmation of rapamycin loaded in LNP, as evaluated by (D) DSC and (E) HPLC. The arrow indicates rapamycin peak. (F) Confirmation of Col II loaded in LNP by confocal microscopic photographs of LNP-Col II-R. Scale bars, 1 μm. (G) Colloidal stability of LNP-Col II-R in 50% (v/v) serum, as evaluated by DLS (n = 3). (H) Confirmation of released amount of Col II peptide and rapamycin from LNP-Col II-R by BCA protein assay and HPLC, respectively (n = 3).
Fig. 2.
Fig. 2.. LNP-Col II-R–mediated antigen presentation on DCs and subsequent induction of tDCs in vitro.
(A) Effective uptake of LNPs by DCs in vitro. Scale bars, 50 μm. (B) LNP-Col II-R–mediated, effective presentation of antigen (Col II) on DCs in vitro. Scale bars, 10 μm (n = 4). (C) LNP-mediated, effective presentation of antigen (Eα peptide) on MHC class II of DC surface in vitro. Scale bars, 50 μm (n = 4). LNP-Col II-R–mediated, effective induction of tDCs in vitro, as evaluated by DC surface protein analyses with (D) flow cytometry (n = 6), (E) cytokine mRNA analysis with qRT-PCR (n = 6), and (F) ELISA (n = 4). (B) ***P < 0.001. Two-tailed t test. (C to E) #P < 0.001 versus any group, *P < 0.05, **P < 0.01, and ***P < 0.001. One-way ANOVA (multiple comparison) with Tukey’s post hoc test.
Fig. 3.
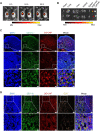
Fig. 3.. Biodistribution of LNP-Col II-R after intradermal injection.
(A) Fluorescence intensity of DiR-labeled LNP-Col II-R at 6, 24, and 48 hours after intradermal injection near the right iLN of mice. (B) Fluorescence intensity of major organs and iLN 24 hours after intradermal injection near the right iLN. (C) Immunostaining of DCs in the right iLN with anti-CD11c antibodies 24 hours after intradermal injection of DiD-labeled LNP-Col II-R, indicating colocalization of LNP-Col II-R and DCs in the right iLN. The photographs of the lowest row are a higher magnification of the rectangular areas (paracortex) of those in the top rows. Scale bars, 100 μm (top row), 50 μm (middle row), and 5 μm (bottom row). (D) Immunostaining of DCs and T cells in the right iLN with anti-CD11c and anti-CD3 antibodies 24 hours after intradermal injection of DiD-labeled LNP-Col II-R, indicating colocalization of LNP-Col II-R, DCs, and T cells in the right iLN. The photographs of the bottom row are a higher magnification of the rectangular areas of those in the top row. Scale bars, 50 μm (top row) and 10 μm (bottom row).
Fig. 4.
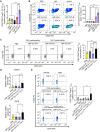
Fig. 4.. In vitro and in vivo generation of antigen-specific Tregs by nanoparticles.
(A) Proportion of OVA-specific Tregs in iLN following intradermal injection of different types of nanoparticles to OT-II transgenic mice that have T cells specific for OVA only, as evaluated by flow cytometry (n = 4). (B) Proportion of Tregs generated in vitro from OT-II CD4+ T cells following coculture of the CD4+ T cells with DCs that had been treated with various types of nanoparticles in vitro (n = 5). (C) Proportion of Tregs in splenocytes. The splenocytes were isolated from wild-type OA mice that had been treated with intradermal injection of different types of nanoparticles and subsequently restimulated in vitro with Col II or OVA (n = 5). (D) Relative mRNA expression of FOXP3 and TGF-β in the splenocytes restimulated in vitro with Col II or OVA (n = 6). (E) Proportion of Tregs in splenocytes analyzed by flow cytometry. The splenocytes were isolated from wild-type OA mice that had been treated with intradermal injection of different types of nanoparticles and subsequently restimulated in vitro with Col II259–273 (epitope) or OVA (n = 5). (A to E) *P < 0.05, **P < 0.01, and ***P < 0.001. One-way ANOVA (multiple comparison) with Tukey’s post hoc test.
Fig. 5.
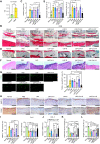
Fig. 5.. Therapeutic effects of LNP-Col II-R in OA mice at 8 weeks.
(A) Level of autoantibodies against Col II in serum of DMM-induced mice (n = 4). (B) Representative Safranin O–Fast Green–stained sections of the joints. Photographs of the bottom row are higher magnification of the rectangular areas of those in the top row. Scale bars, 100 μm. (C) OARSI scores. *P < 0.05, **P < 0.01, and ***P < 0.001 versus any group except LNP-Col II-R. One-way ANOVA with Tukey’s post hoc test (n = 5). (D) Representative Safranin O–Fast Green–stained sections of the joints. The osteophytes are indicated with black arrows. Scale bars, 100 μm. (E) Osteophyte size and maturity analysis. *P < 0.05, **P < 0.01, and §P < 0.001 versus any group except LNP-R and LNP-Col II-R. One-way ANOVA with Tukey’s post hoc test (n = 4). (F) H&E staining of the synovium. Scale bars, 100 μm. (G) TUNEL staining of the cartilage. Scale bars, 100 μm. (H) Immunostaining for MMP13 and Col2a1 in the cartilage (scale bars, 100 μm) and (I) quantification. (J) Relative mRNA expressions of Col II in the joints (n = 4). Pain evaluated by (K) mechanical allodynia (von Frey) test and (L) static weight-bearing test. (A, G, and I to L) *P < 0.05, **P < 0.01, and ***P < 0.001. One-way ANOVA (multiple comparison) with Tukey’s post hoc test (n = 4).
Fig. 6.
Fig. 6.. Immunomodulation in the synovium of OA mice at 8 weeks.
Immunostaining for (A) CD4+CD25+Foxp3+ Tregs, (B) F4/80+iNOS+ M1 macrophages, (C) CD4+IFN-γ+ T cells, (D) CD4+IL-17+ T cells, and (E) Foxp3+IL-10+ Tregs in the synovium. (F) Relative mRNA expressions of IFN-γ, IL-1β, TNF-α, and TGF-β in the joints. n = 5 except for the normal group (n = 4). (A to E) Scale bars, 20 μm (n = 4). (A to F) *P < 0.05, **P < 0.01, and #P < 0.001. One-way ANOVA (multiple comparison) with Tukey’s post hoc test.
Fig. 7.
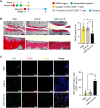
Fig. 7.. Therapeutic effects of adoptive transfer of CD4+CD25+ T cells to OA mice.
CD4+CD25+ T cells were isolated from mice treated with intradermal injection of PBS, LNP-R, or LNP-Col II-R. (A) Timeline of the experiment. (B) Representative Safranin O–Fast Green–stained sections of the cartilages and the OARSI grade 8 weeks after adoptive cell transfer. Photographs of the bottom row are higher magnification of the rectangular areas of those in the top row. Scale bars, 100 μm (n = 5). (C) Immunostaining of Tregs in the synovium. Scale bars, 20 μm (n = 4). (B and C) *P < 0.05 and ***P < 0.001. One-way ANOVA (multiple comparison) with Tukey’s post hoc test.

Comment in

References

    1. De Lucia O., Murgo A., Pregnolato F., Pontikaki I., De Souza M., Sinelli A., Cimaz R., Caporali R., Hyaluronic acid injections in the treatment of osteoarthritis secondary to primary inflammatory rheumatic diseases: A systematic review and qualitative synthesis. Adv. Ther. 37, 1347–1359 (2020). - PMC - PubMed
    1. Davies R. L., Kuiper N. J., Regenerative medicine: A review of the evolution of autologous chondrocyte implantation (ACI) therapy. Bioengineering (Basel) 6, 1–16 (2019). - PMC - PubMed
    1. Kim H., Lee B.-K., Anti-inflammatory effect of adipose-derived stromal vascular fraction on osteoarthritic temporomandibular joint synoviocytes. Tissue Eng. Regen. Med. 17, 351–362 (2020). - PMC - PubMed
    1. Wood M. J., Leckenby A., Reynolds G., Spiering R., Pratt A. G., Rankin K. S., Isaacs J. D., Haniffa M. A., Milling S., Hilkens C. M., Macrophage proliferation distinguishes 2 subgroups of knee osteoarthritis patients. JCI Insight 4, 1–12 (2019). - PMC - PubMed
    1. Robinson W. H., Lepus C. M., Wang Q., Raghu H., Mao R., Lindstrom T. M., Sokolove J., Low-grade inflammation as a key mediator of the pathogenesis of osteoarthritis. Nat. Rev. Rheumatol. 12, 580–592 (2016). - PMC - PubMed