. 2022 Nov 15;10(11):2935.
doi: 10.3390/biomedicines10112935.

mTOR Signaling in BDNF-Treated Guinea Pigs after Ototoxic Deafening

Affiliations

mTOR Signaling in BDNF-Treated Guinea Pigs after Ototoxic Deafening

Annamaria Tisi et al. Biomedicines. .

Abstract

The mammalian target of rapamycin (mTOR) signaling plays a critical role in cell homeostasis, growth and survival. Here, we investigated the localization of the main mTOR signaling proteins in the organ of Corti of normal-hearing and deafened guinea pigs, as well as their possible modulation by exogenously administered brain-derived neurotrophic factor (BDNF) in deafened guinea pigs. Animals were ototoxically deafened by systemic administration of kanamycin and furosemide, and one week later, the right cochleas were treated with gelatin sponge soaked in rhBDNF, while the left cochleas were used as negative controls. Twenty-four hours after treatment, animals were euthanized, and the cochleas were processed for subsequent analysis. Through immunofluorescence, we demonstrated the localization of AKT, pAKT, mTOR, pmTOR and PTEN proteins throughout the cochlea of guinea pigs for the first time, with a higher expression in supporting cells. Moreover, an increase in mTOR immunostaining was observed in BDNF-treated cochleas by means of fluorescence intensity compared to the other groups. Conversely, Western blot analysis showed no significant differences in the protein levels between groups, probably due to dilution of proteins in the neighboring tissues of the organ of Corti. Altogether, our data indicate that mTOR signaling proteins are expressed by the organ of Corti (with a major role for supporting cells) and that the modulation of mTOR may be a protective mechanism triggered by BDNF in the degenerating organ of Corti.

Keywords: BDNF; Western blot; hair cells; hearing loss; immunofluorescence; mTOR; neurotrophins; organ of Corti; supporting cells.


Conflict of interest statement

The authors declare no conflict of interest.

Figures

Figure 1
Figure 1
Schematic illustration of the mTOR signaling. The proteins investigated in the present study are highlighted in yellow. The red P indicates a phosphorylation site. mTOR, Raptor, pras40, deptor, mLST8, tel2 and tti1 form the mTORC1 complex. Abbraviations: PI3K: phosphatidylinositide 3 kinase; PIP2: phosphatidylinositol (4,5)-bisphosphate; PIP3: phosphatidylinositol (3,4,5)-trisphosphate; PTEN: phosphatase and tensin homolog; AKT: protein kinase B; mTOR: mammalian target of rapamycin; pras40: proline-rich AKT substrate of 40 kDa; deptor: DEP domain containing MTOR-interacting protein; raptor: regulatory-associated protein of mTOR.
Figure 2
Figure 2
Schematic Illustration of the experimental design. Group 1 of guinea pigs underwent the deafening procedure; the right ear was treated after 7 days from the injury, while the left ear was left untreated; the animals were euthanized 8 days after deafening. Group 2 is formed by normal-hearing (NH) guinea pigs.
Figure 3
Figure 3
Cochlear cryosection and locations. The image is an overview of a representative midmodiolar cochlear cryosection stained with bisbenzimide nuclear dye obtained by reconstruction of multiple images with 20× objective. Each cochlear location is labeled with a different lettering: basal semi-turns (B1, B2), middle semi-turns (M1, M2), apical semi-turns (A1, A2, A3) and helicotrema (H). The white frame borders the area of the organ of Corti for B1 and is an example showing the location of the organ of Corti in the cochlear turns.
Figure 4
Figure 4
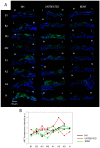
Immunolocalization and fluorescence intensity of AKT. (A) Representative confocal images showing the organ of Corti immunolabelled with anti-AKT (green) and counterstained with bisbenzimide nuclear dye (blue) of all experimental groups and for each cochlear location (from B1 to H). Scale bar: 50 µm. L: lateral, M: medial. (B) Fluorescence intensity analysis of AKT immunostaining for six cochleas (two NH, two untreated and two BDNF-treated). The graph shows the signal intensity of each sample for all cochlear locations (black: NH, red: untreated, green: BDNF-treated). The same symbol was used to identify the BDNF-treated and contralaterally untreated ears within individual animals.
Figure 5
Figure 5
Immunostaining of pAKT in a NH organ of Corti. (A) Representative confocal image of a NH organ of Corti (A1 location) immunolabeled with anti-pAKT (green) and counterstained with bisbenzimide nuclear dye (blue) (L: lateral, M: medial); (B) the same image was acquired with anti-pAKT signal (green) on a bright-field background to show the structure of the organ of Corti, and (C) the Pillar cells were delineated in yellow; scale bar: 50 µm. (D) 3D projection of the same 2D image shown in (B). The green line indicates the central plane of the z-stack and is shown on the right; the white arrow indicates the apical region of pillar cells; scale bar: 25 µm.
Figure 6
Figure 6
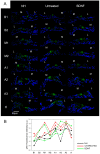
Immunostaining and fluorescence intensity of pAKT. (A) Representative confocal images showing the organ of Corti, immunolabeled with anti-pAKT (green) and counterstained with bisbenzimide nuclear dye (blue), of all experimental groups and for each cochlear location (from B1 to H). Scale bar: 50 µm. L: lateral, M: medial. (B) Fluorescence intensity analysis of pAKT immunostaining. The graph shows the signal intensity of each sample for all cochlear locations (black: NH, red: untreated, green: BDNF-treated). The same symbol was used to identify the BDNF-treated and untreated ears of individual animals.
Figure 7
Figure 7
Protein quantification of AKT and pAKT (Thr 308). (A) Representative Western blot bands (the original whole Western blot bands are shown in Supplementary Figure S1). Western blot analysis of pAKT/AKT (B), pAKT/GAPDH (C) and AKT/GAPDH (D) on organ of Corti samples from all the experimental groups. Histograms show mean ± SD; the dots indicate the densitometric values for individual samples (n = 5; each sample is a pool of two organs of Corti).
Figure 8
Figure 8
Immunolocalization and fluorescence intensity of pmTOR. (A) Representative confocal images showing the organ of Corti immunolabelled with anti-pmTOR (green) and counterstained with bisbenzimide nuclear dye (blue) of all experimental groups and for each cochlear location (from B1 to H). Scale bar: 50 µm. L: lateral, M: medial. (B) Fluorescence intensity analysis of pmTOR immunostaining. The graph shows the signal intensity of each sample for all cochlear locations (black: NH, red: untreated, green: BDNF-treated). The same symbol was used to identify the BDNF-treated and untreated ears of individual animals.
Figure 9
Figure 9
Immunolocalization of the mTOR protein. Top: a representative confocal image of the organ of Corti of a NH cochlea (A1 location) immunolabelled with anti-mTOR (green) and counterstained with bisbenzimide nuclear dye (blue). Bottom: The same image was acquired with a bright-field background to visualize the structure of the organ of Corti; the different cell types were signed with color coding (pillar: yellow, IHC: red, phalangeal: black, Deiters’: white, border: orange, OHC: blue, Hensen’s: pink). L: lateral, M: medial.
Figure 10
Figure 10
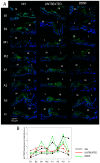
Immunolocalization and fluorescence intensity of mTOR. (A) Representative confocal images showing the organ of Corti immunolabelled with anti-mTOR (green) and counterstained with bisbenzimide nuclear dye (blue) of all experimental groups and for each cochlear location (from B1 to H). Scale bar: 50 µm. L: lateral, M: medial. (B) Fluorescence intensity analysis of mTOR immunostaining. The graph shows the signal intensity of each sample for all cochlear locations (black: NH, red: untreated, green: BDNF-treated). The same symbol was used to identify the BDNF-treated and untreated ears of individual animals.
Figure 11
Figure 11
Protein quantification of pmTOR and mTOR. (A) Representative Western blot bands (original Western blot bands are shown in Supplementary Figure S2). Western blot analysis of pmTOR/mTOR (B), mTOR/GAPDH (C) and pmTOR/GAPDH (D) on organ of Corti samples from all the experimental groups. Histograms show mean ± SD; the dots indicate the densitometric values for individual samples (n = 5; each sample is a pool of two organs of Corti).
Figure 12
Figure 12
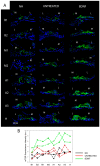
Immunolocalization and fluorescence intensity of PTEN. (A) Representative confocal images showing the organ of Corti immunolabelled with anti-PTEN (green) and counterstained with bisbenzimide nuclear dye (blue) of all experimental groups and for each cochlear location (from B1 to H). Scale bar: 50 µm. L: lateral, M: medial. (B) Fluorescence intensity analysis of PTEN immunostaining. The graph shows the signal intensity of each sample for all cochlear locations (black: NH, red: untreated, green: BDNF-treated). The same symbol was used to identify the BDNF-treated and untreated ears of individual animals.
Figure 13
Figure 13
Protein quantification of PTEN. (A) Representative Western blot bands. (The original Western blot bands are shown in Supplementary Figure S3). (B) Western blot analysis of PTEN/GAPDH on organ of Corti samples from all the experimental groups. The histogram shows mean ± SD; the dots indicate the densitometric values for individual samples (n = 5; each sample is a pool of two organs of Corti).

References

    1. Johnson Chacko L., Blumer M.J.F., Pechriggl E., Rask-Andersen H., Dietl W., Haim A., Fritsch H., Glueckert R., Dudas J., Schrott-Fischer A. Role of BDNF and neurotrophic receptors in human inner ear development. Cell Tissue Res. 2017;370:347–363. doi: 10.1007/s00441-017-2686-9. - DOI - PubMed
    1. Singer W., Panford-Walsh R., Knipper M. The function of BDNF in the adult auditory system. Neuropharmacology. 2014;76:719–728. doi: 10.1016/j.neuropharm.2013.05.008. - DOI - PubMed
    1. Barbacid M. The Trk family of neurotrophin receptors. J. Neurobiol. 1994;25:1386–1403. doi: 10.1002/neu.480251107. - DOI - PubMed
    1. Ramekers D., Versnel H., Grolman W., Klis S.F.L. Neurotrophins and their role in the cochlea. Hear. Res. 2012;288:19–33. - PubMed
    1. Schulze J., Staecker H., Wedekind D., Lenarz T., Warnecke A. Expression pattern of brain-derived neurotrophic factor and its associated receptors: Implications for exogenous neurotrophin application. Hear. Res. 2020;413:108098. doi: 10.1016/j.heares.2020.108098. - DOI - PubMed