The Antagonism of Neuropeptide Y Type I Receptor (Y1R) Reserves the Viability of Bone Marrow Stromal Cells in the Milieu of Osteonecrosis of Femoral Head (ONFH)
- PMID: 36428510
- PMCID: PMC9687204
- DOI: 10.3390/biomedicines10112942
The Antagonism of Neuropeptide Y Type I Receptor (Y1R) Reserves the Viability of Bone Marrow Stromal Cells in the Milieu of Osteonecrosis of Femoral Head (ONFH)
Abstract
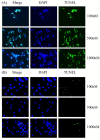
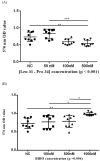
Neuropeptide Y (NPY)-Y1 receptor (Y1R) signaling is known to negatively affect bone anabolism. Our study aimed at investigating the impact of NPY-Y1R signaling in the pathogenesis of glucocorticoid-related osteonecrosis of the femoral head (ONFH). Femoral heads were retrieved from 20 patients with and without ONFH, respectively. The bone marrow stromal cells (BMSCs) from ONFH femoral heads were treated with Y1R agonists and antagonists for subsequent analysis. We showed that the local NPY expression level was lower in ONFH heads. The Y1R agonists and antagonists disturb and facilitate the survival of BMSCs. The transcription of stromal derived factor-1 (SDF-1) was enhanced by Y1R antagonists. Our study showed that the local NPY expression level was lower in ONFH heads. Y1R antagonists facilitate the survival of BMSCs and stimulate the transcription of SDF-1 by BMSCs. These findings shed light on the role of NPY-Y1R signaling in the pathogenesis of ONFH.
Keywords: BIBO3304; neuropeptide Y; osteonecrosis of femoral head (ONFH); stromal derived factor-1 (SDF-1).
Conflict of interest statement
The authors declare no conflict of interest.
Figures


Similar articles
-
Neuropeptide Y1 receptor antagonist promotes osteoporosis and microdamage repair and enhances osteogenic differentiation of bone marrow stem cells via cAMP/PKA/CREB pathway.Aging (Albany NY). 2020 May 7;12(9):8120-8136. doi: 10.18632/aging.103129. Epub 2020 May 7. Aging (Albany NY). 2020. PMID: 32381754 Free PMC article.
-
Stromal-Cell-Derived Factor (SDF) 1-Alpha Overexpression Promotes Bone Regeneration by Osteogenesis and Angiogenesis in Osteonecrosis of the Femoral Head.Cell Physiol Biochem. 2018;46(6):2561-2575. doi: 10.1159/000489684. Epub 2018 May 7. Cell Physiol Biochem. 2018. PMID: 29758548
-
Early treadmill running delays rotator cuff healing via Neuropeptide Y mediated inactivation of the Wnt/β-catenin signaling.J Orthop Translat. 2021 Oct 11;30:103-111. doi: 10.1016/j.jot.2021.08.004. eCollection 2021 Sep. J Orthop Translat. 2021. PMID: 34722153 Free PMC article.
-
Neuropeptide Y Signaling Regulates Recurrent Excitation in the Auditory Midbrain.J Neurosci. 2023 Nov 8;43(45):7626-7641. doi: 10.1523/JNEUROSCI.0900-23.2023. Epub 2023 Sep 13. J Neurosci. 2023. PMID: 37704372 Free PMC article.
-
Stem cell therapy for osteonecrosis of femoral head: Opportunities and challenges.Regen Ther. 2020 Nov 28;15:295-304. doi: 10.1016/j.reth.2020.11.003. eCollection 2020 Dec. Regen Ther. 2020. PMID: 33426232 Free PMC article. Review.
Cited by
-
Dickkopf-1 (DKK1) blockade mitigates osteogenesis imperfecta (OI) related bone disease.Mol Med. 2024 May 21;30(1):66. doi: 10.1186/s10020-024-00838-3. Mol Med. 2024. PMID: 38773377 Free PMC article.
-
Micro Ribonucleic Acid-29a (miR-29a) Antagonist Normalizes Bone Metabolism in Osteogenesis Imperfecta (OI) Mice Model.Biomedicines. 2023 Feb 5;11(2):465. doi: 10.3390/biomedicines11020465. Biomedicines. 2023. PMID: 36831000 Free PMC article.
References
-
- Mastrolia I., Giorgini A., Murgia A., Loschi P., Petrachi T., Rasini V., Pinelli M., Pinto V., Lolli F., Chiavelli C., et al. Autologous Marrow Mesenchymal Stem Cell Driving Bone Regeneration in a Rabbit Model of Femoral Head Osteonecrosis. Pharmaceutics. 2022;14:2127. doi: 10.3390/pharmaceutics14102127. - DOI - PMC - PubMed
Grants and funding
- 110-2314-B-182A-149-/Minister of Science and Technology, Taiwan
- 111-2314-B-182A-055-/Minister of Science and Technology, Taiwan
- 109-2314-B-039-018-MY3/Minister of Science and Technology, Taiwan
- CRRPG8J0071~3/Kaohsiung Chang Gung Memorial Hospital, Taiwan
- DMR-110-111/China Medical University Hospital, Taiwan
LinkOut - more resources
Full Text Sources
Research Materials
Miscellaneous

