. 2022 Nov 14;14(22):5597.
doi: 10.3390/cancers14225597.

The NAMPT Inhibitor FK866 Increases Metformin Sensitivity in Pancreatic Cancer Cells

Affiliations

The NAMPT Inhibitor FK866 Increases Metformin Sensitivity in Pancreatic Cancer Cells

Maxime Parisotto et al. Cancers (Basel). .

Abstract

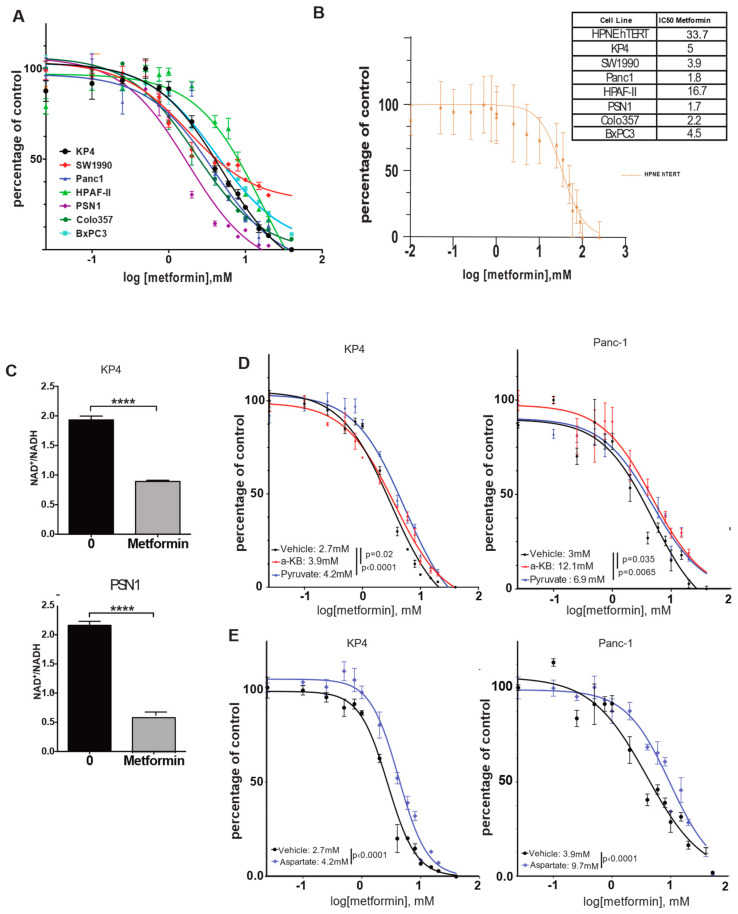
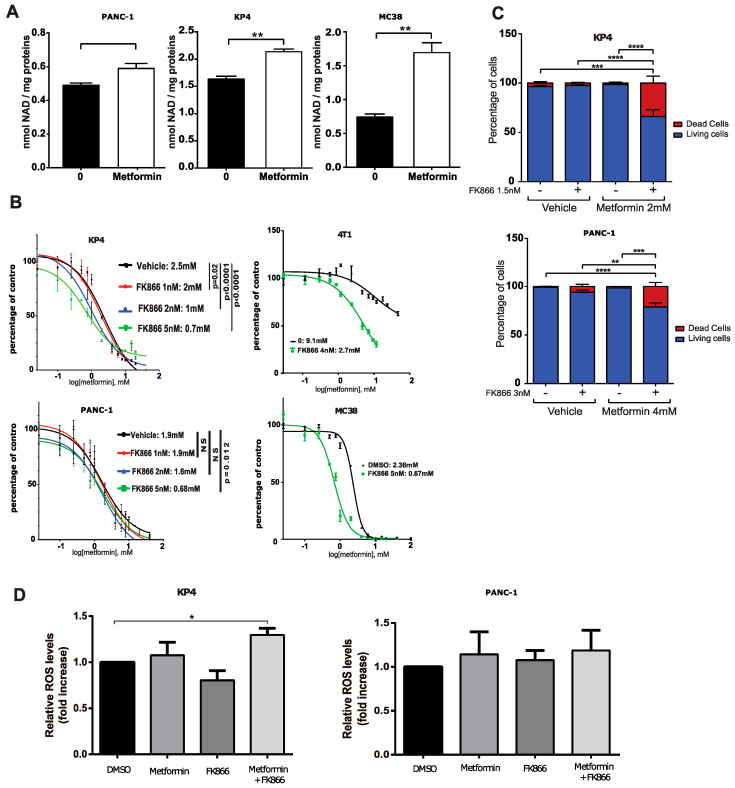
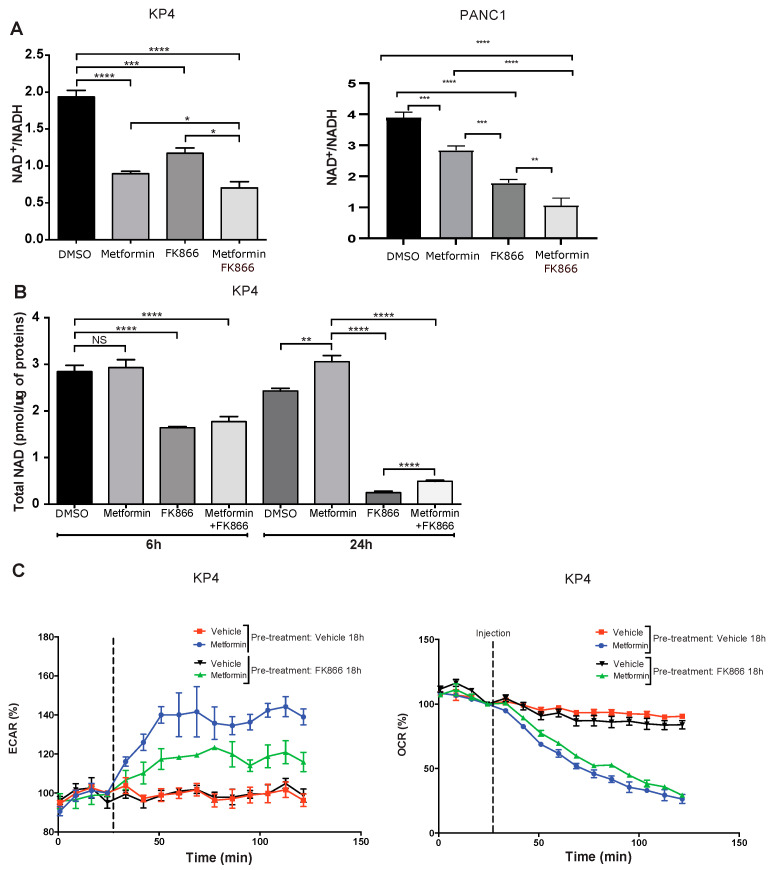
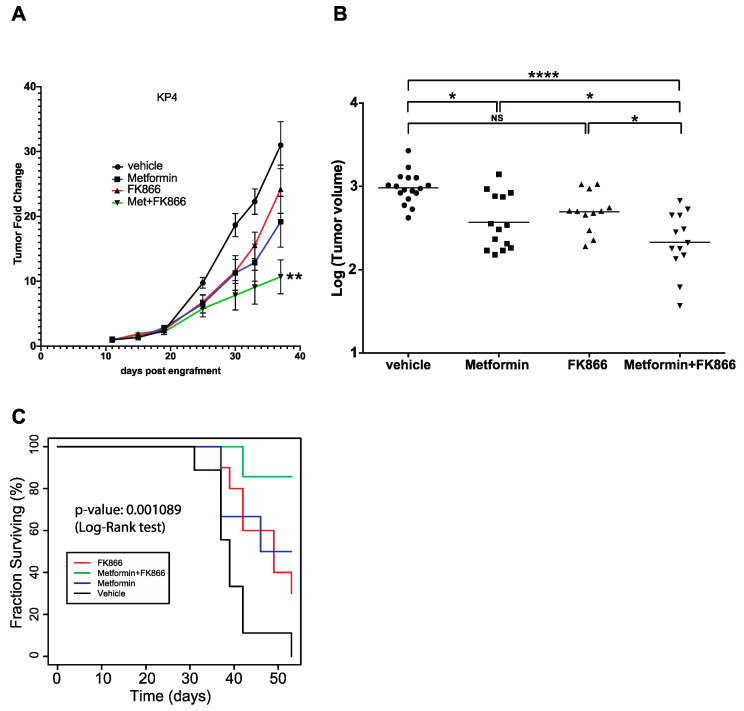
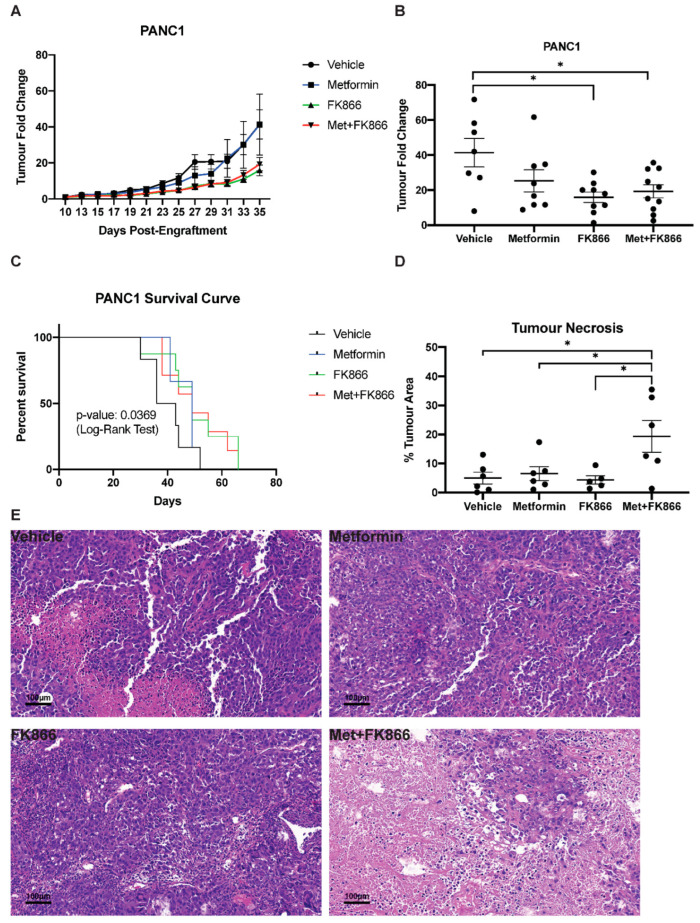
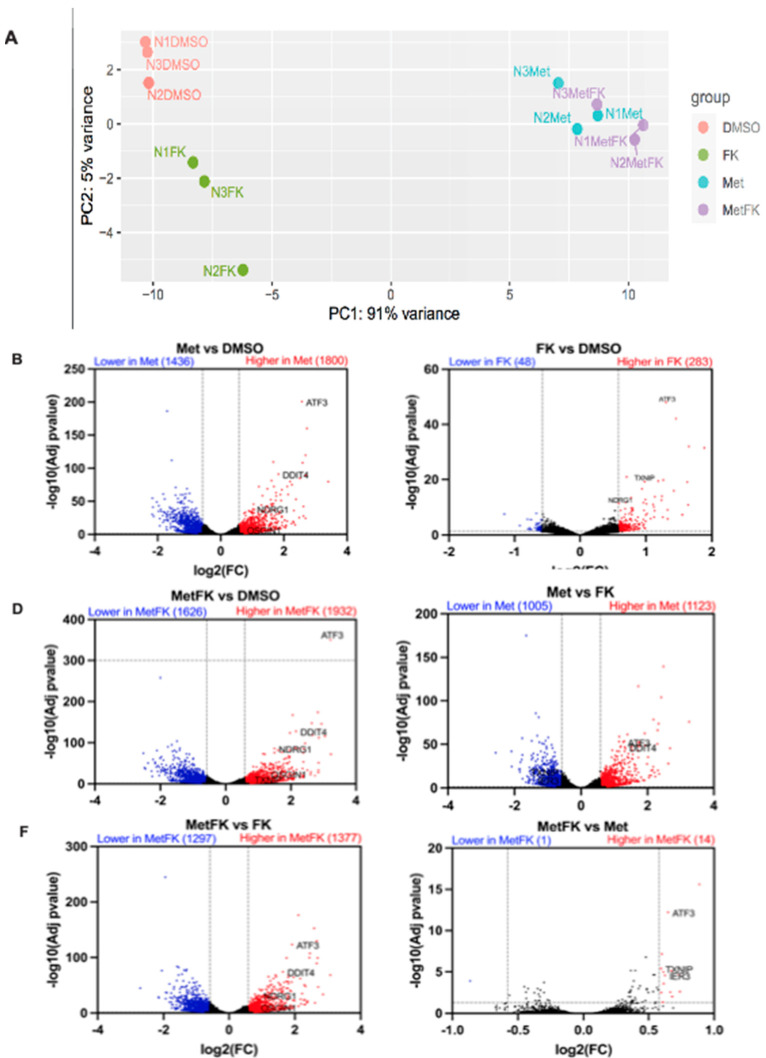
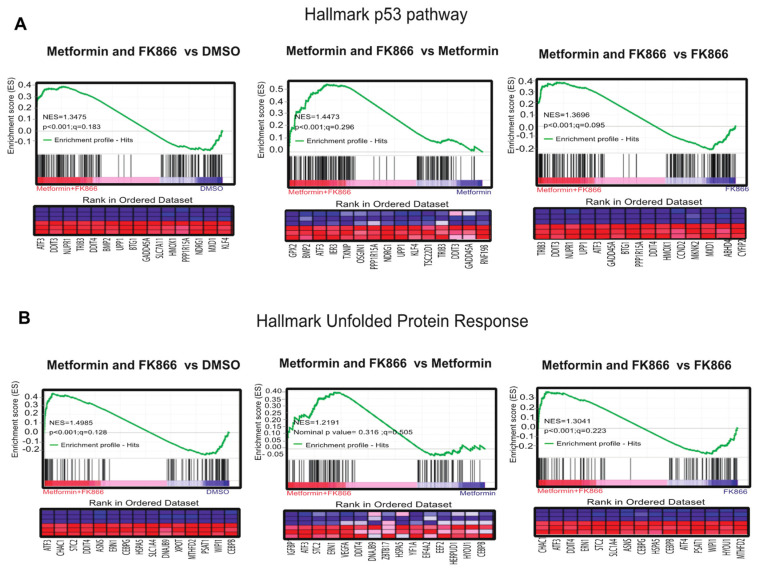
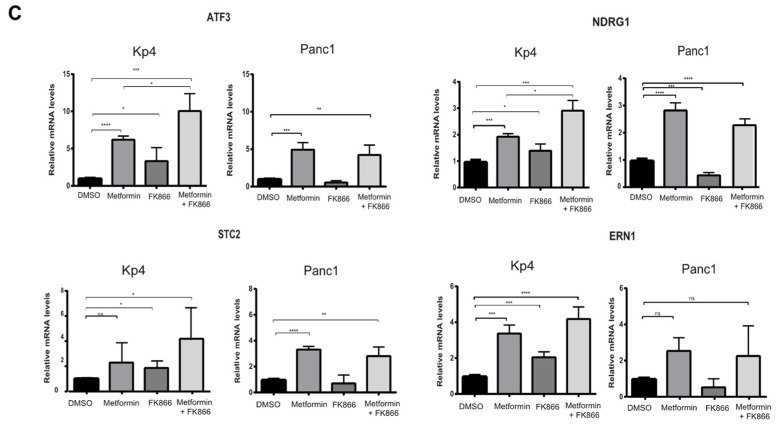
Pancreatic cancer (pancreatic ductal adenocarcinoma: PDAC) is one of the most aggressive neoplastic diseases. Metformin use has been associated with reduced pancreatic cancer incidence and better survival in diabetics. Metformin has been shown to inhibit PDAC cells growth and survival, both in vitro and in vivo. However, clinical trials using metformin have failed to reduce pancreatic cancer progression in patients, raising important questions about molecular mechanisms that protect tumor cells from the antineoplastic activities of metformin. We confirmed that metformin acts through inhibition of mitochondrial complex I, decreasing the NAD+/NADH ratio, and that NAD+/NADH homeostasis determines metformin sensitivity in several cancer cell lines. Metabolites that can restore the NAD+/NADH ratio caused PDAC cells to be resistant to metformin. In addition, metformin treatment of PDAC cell lines induced a compensatory NAMPT expression, increasing the pool of cellular NAD+. The NAMPT inhibitor FK866 sensitized PDAC cells to the antiproliferative effects of metformin in vitro and decreased the cellular NAD+ pool. Intriguingly, FK866 combined with metformin increased survival in mice bearing KP4 cell line xenografts, but not in mice with PANC-1 cell line xenografts. Transcriptome analysis revealed that the drug combination reactivated genes in the p53 pathway and oxidative stress, providing new insights about the mechanisms leading to cancer cell death.

Keywords: NAD; NAMPT; metabolism; metformin; pancreatic cancer.


Conflict of interest statement

The authors declare no conflicts of interest. The funders had no role in the design of the study; in the collection, analyses, or interpretation of data; in the writing of the manuscript, or in the decision to publish the results.

Figures

Figure 1
Figure 1
Metformin decreases growth of PDAC cells through a reduction in NAD+/NADH intracellular ratio in vitro. (A,B) Dose-response curves and IC50s of metformin on a panel of human PDAC cells (A) or HPNE cells (B) over 3 days of growth. Values are means of triplicates ± SEM. (C) Quantification of NAD+/NADH ratio in KP4 and PSN1 PDAC cell lines treated with 10 mM metformin or vehicle for 6 h. Values are means of triplicates ± SEM, **** p-value ≤ 0.0001 (Student’s t-test). (D,E) Dose-response curves and IC50s of metformin when PANC-1 and KP4 cells are on 4 mM α-ketobutyrate (α-KB), 1 mM of pyruvate (D), or 20 mM of aspartate (E) over 3 days of growth. Values are means of triplicates ± SEM. For all experiments, n = 3.
Figure 2
Figure 2
The NAMPT inhibitor FK866 and metformin cooperate to inhibit PDAC cells growth by strongly perturbing NAD metabolism. (A) Total NAD level in PDAC cells grown for 24 h in the presence or absence of 10 mM metformin. * p-value ≤ 0.05, ** p-value ≤ 0.01 (student t-test). (B) Dose-response curves and IC50s of metformin on growth of PDAC cell KP4 and PANC-1, breast cancer cells 4T1, and colon cancer cells MC38 treated with FK866 or vehicle for 3 days. (C) Viability (cell counts with trypan blue staining) of KP4 and PANC-1 cells treated with metformin or vehicle and FK866 or vehicle for 6 days. ** p-value ≤ 0.01, **** p-value ≤ 0.0001 (Student’s t-test). (D) Fluorescence intensity of KP4 and PANC-1 cells stained with DCFDA and measured by flow cytometry. Data show a relative change in median fluorescence intensity over control cells. Treatment for 24 h in the presence or absence of 10 mM metformin, 5 nM of FK866, a combination of metformin and FK866, or with vehicle. (AC) Values are means of triplicates ± SEM, n = 3; for (D), values are means of duplicates ± SEM. ** p-value ≤ 0.01, *** p-value ≤ 0.001, **** p-value ≤ 0.0001 (ANOVA).
Figure 3
Figure 3
FK866 cooperates with metformin to reduce metabolic compensation. (A) Quantification of NAD+/NADH ratio in KP4 and PANC-1 cells treated for 6 h with 10 mM metformin, 5 nM FK866, a combination of metformin and FK866, or vehicle. (B) Quantification of total NAD levels after 6 h or 24 h in KP4 cells treated with 10 mM metformin, 5 nM FK866, Met+FK866, or vehicle. Values are means of triplicates ± SEM. * p-value ≤ 0.05, ** p-value ≤ 0.01, *** p-value ≤ 0.001, **** p-value ≤ 0.0001, NS, not significant (ANOVA), n = 3. (C) ECAR (extracellular acidification rate) and OCR (oxygen consumption rate) of KP4 cells treated with 10 mM metformin, measured by SeaHorse analysis. Cells were either pre-treated or not with FK866 (5 nM) for 18 h prior to SeaHorse analysis in order to deplete NAD levels. Values are means of triplicates ± SEM, n = 3.
Figure 4
Figure 4
Progression of KP4 sub-cutaneous xenografts in nude mice. (A) Xenograft tumor growth of KP4 cells engrafted subcutaneously in nude mice. Metformin (75 mg/kg/d), FK866 (20 mg/kg/d), Met+FK, or vehicle treatments (intraperitoneally 5 days per week) were started 11 days post-engraftment. * p ≤ 0.01, ANOVA. (B) Graph showing the volume of each tumor after 37 days of the different treatments. * p ≤ 0.05, **** p ≤ 0.0001, NS: not significant (ANOVA). (C) Kaplan–Meyer survival curve of KP4 tumor-bearing mice as in (A) over 54 days.
Figure 5
Figure 5
Progression of PANC-1 sub-cutaneous xenografts in nude mice. (A) Tumor fold change in mice bearing PANC-1 xenografts treated with Metformin, FK866, Met+FK, or vehicle (5 days a week). Treatment started 11 days post engraftment. (B) Tumor volume at day 35 from the mice represented in (A). (C) Kaplan–Meyer survival curves of PANC-1 tumor-bearing mice receiving different treatments over 65 days. (D-E) Quantification of % tumor necrosis (D) by H&E staining (E) of PANC-1 tumors, as in (B). (BD) * p ≤ 0.05 (ANOVA).
Figure 6
Figure 6
Differential gene expression in KP4 cells treated with metformin, FK866, or both. (A) Principal component analysis (PCA) and (BG) volcano plots of differentially expressed genes (DEGs) from the RNAseq data obtained from KP4 cells treated as indicated for 24 h. (AG) n = 3.
Figure 7
Figure 7
The combination of Met+FK activates the p53 pathway and the unfolded protein response (UPR). (A) p53 gene set that overlaps with gene expression changes in KP4 cells treated with metformin and FK866 in comparison to vehicle, metformin alone, or FK866 alone. (B) UPR gene set that overlaps with gene expression changes in KP4 cells treated with metformin and FK866 in comparison to vehicle, metformin alone, or FK866 alone. (C) RT-qPCR validation of some gene expression differences found in (A) and (B). Data are normalized over TBP and HMBS and presented as means relative to control cells (vehicle condition). Values are means of triplicates ± SEM. * p-value ≤ 0.05, ** p-value ≤ 0.01, *** p-value ≤ 0.001, **** p-value ≤ 0.0001 (ANOVA), n = 3.
Figure 7
Figure 7
The combination of Met+FK activates the p53 pathway and the unfolded protein response (UPR). (A) p53 gene set that overlaps with gene expression changes in KP4 cells treated with metformin and FK866 in comparison to vehicle, metformin alone, or FK866 alone. (B) UPR gene set that overlaps with gene expression changes in KP4 cells treated with metformin and FK866 in comparison to vehicle, metformin alone, or FK866 alone. (C) RT-qPCR validation of some gene expression differences found in (A) and (B). Data are normalized over TBP and HMBS and presented as means relative to control cells (vehicle condition). Values are means of triplicates ± SEM. * p-value ≤ 0.05, ** p-value ≤ 0.01, *** p-value ≤ 0.001, **** p-value ≤ 0.0001 (ANOVA), n = 3.

References

    1. Siegel R.L., Miller K.D., Fuchs H.E., Jemal A. Cancer Statistics, 2021. CA Cancer J. Clin. 2021;71:7–33. doi: 10.3322/caac.21654. - DOI - PubMed
    1. Bardou M., Le Ray I. Treatment of pancreatic cancer: A narrative review of cost-effectiveness studies. Best Pract. Res. Clin. Gastroenterol. 2013;27:881–892. doi: 10.1016/j.bpg.2013.09.006. - DOI - PubMed
    1. Singh D., Upadhyay G., Srivastava R.K., Shankar S. Recent advances in pancreatic cancer: Biology, treatment, and prevention. Biochim. Biophys. Acta. 2015;1856:13–27. doi: 10.1016/j.bbcan.2015.04.003. - DOI - PubMed
    1. Eibl G., Rozengurt E. Metformin: Review of epidemiology and mechanisms of action in pancreatic cancer. Cancer Metastasis Rev. 2021;40:865–878. doi: 10.1007/s10555-021-09977-z. - DOI - PMC - PubMed
    1. Reni M., Dugnani E., Cereda S., Belli C., Balzano G., Nicoletti R., Liberati D., Pasquale V., Scavini M., Maggiora P., et al. (Ir)relevance of Metformin Treatment in Patients with Metastatic Pancreatic Cancer: An Open-Label, Randomized Phase II Trial. Clin. Cancer Res. 2016;22:1076–1085. doi: 10.1158/1078-0432.CCR-15-1722. - DOI - PubMed