Genomic and Transcriptomic Predictors of Response to Immune Checkpoint Inhibitors in Melanoma Patients: A Machine Learning Approach
- PMID: 36428698
- PMCID: PMC9688789
- DOI: 10.3390/cancers14225605
Genomic and Transcriptomic Predictors of Response to Immune Checkpoint Inhibitors in Melanoma Patients: A Machine Learning Approach
Abstract
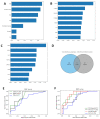
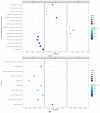
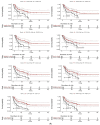
Immune checkpoint inhibitors (ICIs) became one of the most revolutionary cancer treatments, especially in melanoma. While they have been proven to prolong survival with lesser side effects compared to chemotherapy, the accurate prediction of response remains to be an unmet gap. Thus, we aim to identify accurate clinical and transcriptomic biomarkers for ICI response in melanoma. We also provide mechanistic insight into how high-performing markers impose their effect on the tumor microenvironment (TME). Clinical and transcriptomic data were retrieved from melanoma studies administering ICIs from cBioportal and GEO databases. Four machine learning models were developed using random-forest classification (RFC) entailing clinical and genomic features (RFC7), differentially expressed genes (DEGs, RFC-Seq), survival-related DEGs (RFC-Surv) and a combination model. The xCELL algorithm was used to investigate the TME. A total of 212 ICI-treated melanoma patients were identified. All models achieved a high area under the curve (AUC) and bootstrap estimate (RFC7: 0.71, 0.74; RFC-Seq: 0.87, 0.75; RFC-Surv: 0.76, 0.76, respectively). Tumor mutation burden, GSTA3, and VNN2 were the highest contributing features. Tumor infiltration analyses revealed a direct correlation between upregulated genes and CD8+, CD4+ T cells, and B cells and inversely correlated with myeloid-derived suppressor cells. Our findings confirmed the accuracy of several genomic, clinical, and transcriptomic-based RFC models, that could further support the use of TMB in predicting response to ICIs. Novel genes (GSTA3 and VNN2) were identified through RFC-seq and RFC-surv models that could serve as genomic biomarkers after robust validation.
Keywords: immune checkpoint inhibitors; machine learning; melanoma; tumor mutational burden.
Conflict of interest statement
A.S. reports research grants (to institution) from AstraZeneca, Bristol Myers Squibb, Merck, Clovis, Exelixis, Actuate therapeutics, Incyte Corporation, Daiichi Sankyo, Five prime therapeutics, Amgen, Innovent biologics, Dragonfly therapeutics, KAHR medical, Biontech, and advisory board fees from AstraZeneca, Bristol Myers Squibb, Exelixis, Pfizer, and Daiichi Sankyo. The remaining authors have no relevant financial interests to disclose.
Figures


Similar articles
-
Fibroblast growth factor receptor family mutations as a predictive biomarker for immune checkpoint inhibitors and its correlation with tumor immune microenvironment in melanoma.Front Immunol. 2022 Nov 8;13:1030969. doi: 10.3389/fimmu.2022.1030969. eCollection 2022. Front Immunol. 2022. PMID: 36426352 Free PMC article.
-
CCND1 Amplification Profiling Identifies a Subtype of Melanoma Associated With Poor Survival and an Immunosuppressive Tumor Microenvironment.Front Immunol. 2022 Jul 1;13:725679. doi: 10.3389/fimmu.2022.725679. eCollection 2022. Front Immunol. 2022. PMID: 35844619 Free PMC article.
-
AI Model for Predicting Anti-PD1 Response in Melanoma Using Multi-Omics Biomarkers.Cancers (Basel). 2025 Feb 20;17(5):714. doi: 10.3390/cancers17050714. Cancers (Basel). 2025. PMID: 40075562 Free PMC article.
-
Integrated genomic analysis identifies a genetic mutation model predicting response to immune checkpoint inhibitors in melanoma.Cancer Med. 2020 Nov;9(22):8498-8518. doi: 10.1002/cam4.3481. Epub 2020 Sep 24. Cancer Med. 2020. PMID: 32969604 Free PMC article.
-
Tumor Mutational Burden Predicting the Efficacy of Immune Checkpoint Inhibitors in Colorectal Cancer: A Systematic Review and Meta-Analysis.Front Immunol. 2021 Sep 29;12:751407. doi: 10.3389/fimmu.2021.751407. eCollection 2021. Front Immunol. 2021. PMID: 34659255 Free PMC article.
Cited by
-
Informing immunotherapy with multi-omics driven machine learning.NPJ Digit Med. 2024 Mar 14;7(1):67. doi: 10.1038/s41746-024-01043-6. NPJ Digit Med. 2024. PMID: 38486092 Free PMC article. Review.
-
Immunological Aspects of Cancer Cell Metabolism.Int J Mol Sci. 2024 May 13;25(10):5288. doi: 10.3390/ijms25105288. Int J Mol Sci. 2024. PMID: 38791327 Free PMC article. Review.
-
An update on methods for detection of prognostic and predictive biomarkers in melanoma.Front Cell Dev Biol. 2023 Oct 13;11:1290696. doi: 10.3389/fcell.2023.1290696. eCollection 2023. Front Cell Dev Biol. 2023. PMID: 37900283 Free PMC article. Review.
-
A decision support system to recommend appropriate therapy protocol for AML patients.Front Artif Intell. 2024 Mar 6;7:1343447. doi: 10.3389/frai.2024.1343447. eCollection 2024. Front Artif Intell. 2024. PMID: 38510471 Free PMC article.
References
-
- Taube J.M., Klein A., Brahmer J.R., Xu H., Pan X., Kim J.H., Chen L., Pardoll D.M., Topalian S.L., Anders R.A. Association of PD-1, PD-1 ligands, and other features of the tumor immune microenvironment with response to anti-PD-1 therapy. Clin. Cancer Res. 2014;20:5064–5074. doi: 10.1158/1078-0432.CCR-13-3271. - DOI - PMC - PubMed
-
- Binnewies M., Roberts E.W., Kersten K., Chan V., Fearon D.F., Merad M., Coussens L.M., Gabrilovich D.I., Ostrand-Rosenberg S., Hedrick C.C., et al. Understanding the tumor immune microenvironment (TIME) for effective therapy. Nat. Med. 2018;24:541–550. doi: 10.1038/s41591-018-0014-x. - DOI - PMC - PubMed
LinkOut - more resources
Full Text Sources
Other Literature Sources
Research Materials
Miscellaneous

