

Fluorescence-Linked Aptamer Assay for SARS-CoV-2 Spike-Protein: A Step-by-Step Performance Analysis in Clinical Samples
- PMID: 36428893
- PMCID: PMC9689637
- DOI: 10.3390/diagnostics12112829
Fluorescence-Linked Aptamer Assay for SARS-CoV-2 Spike-Protein: A Step-by-Step Performance Analysis in Clinical Samples
Abstract
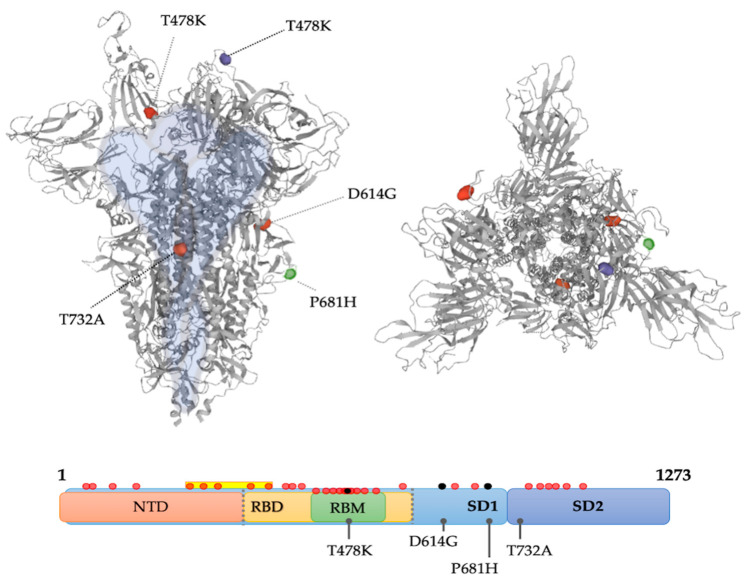
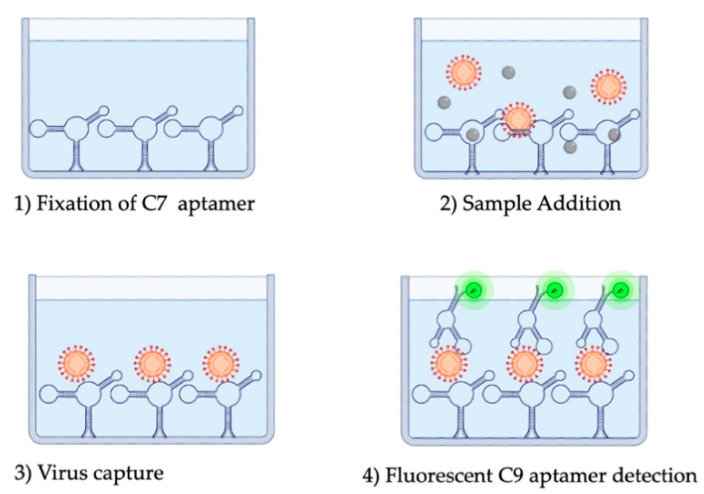
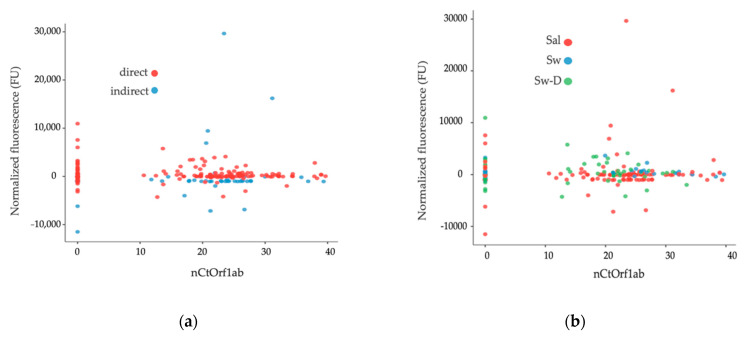
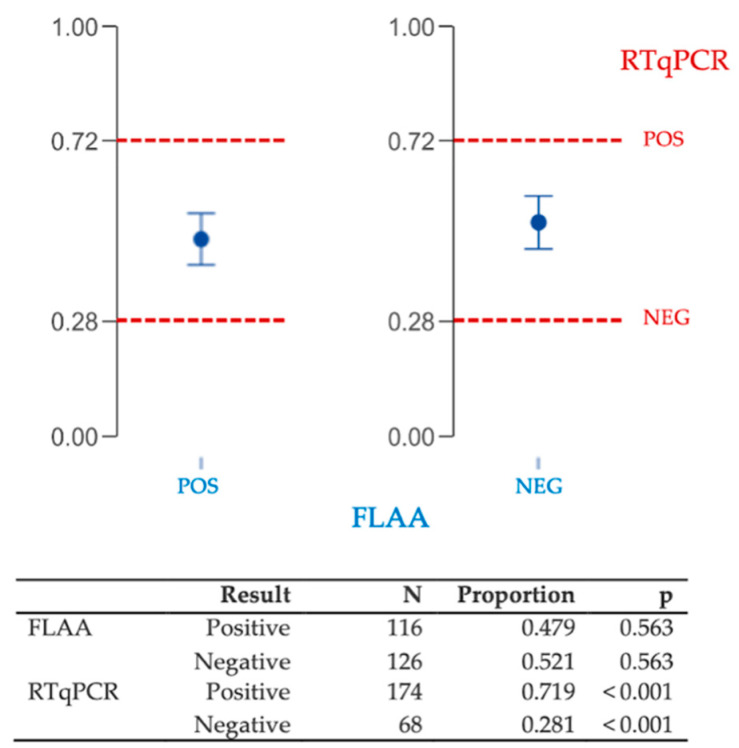
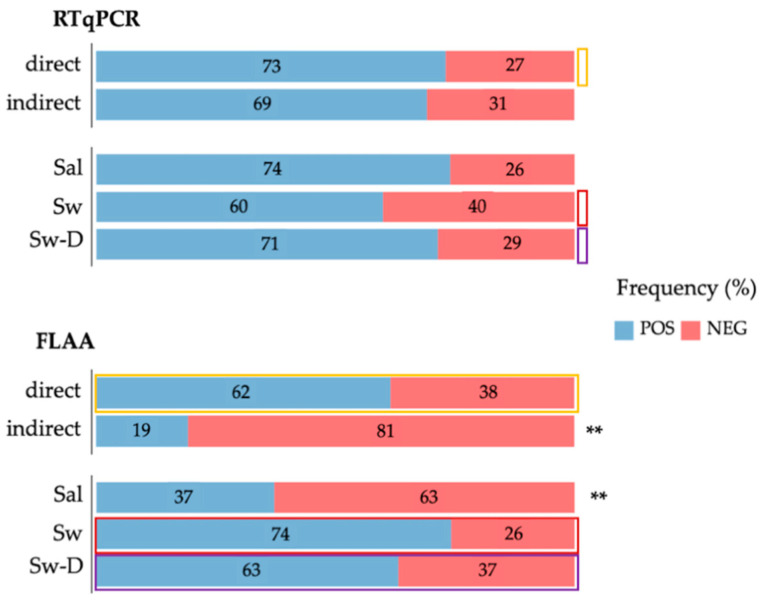
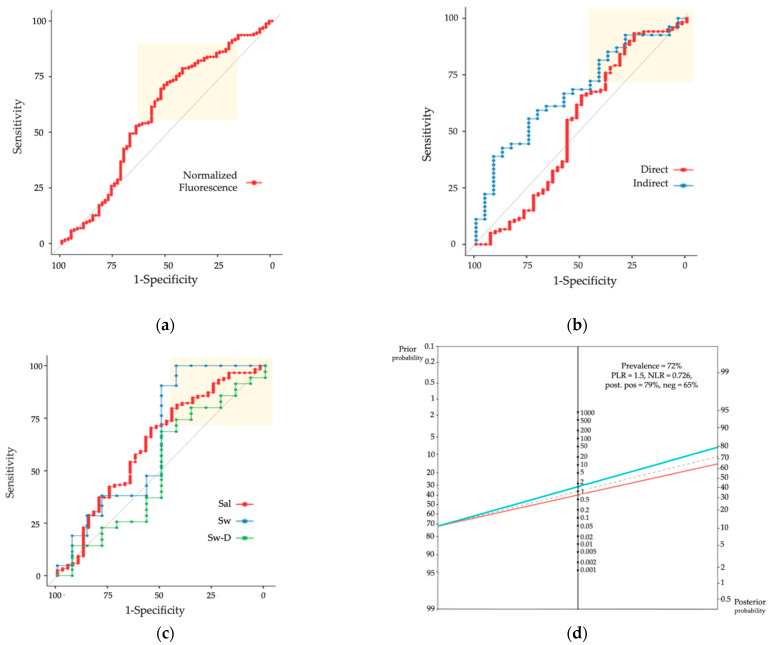
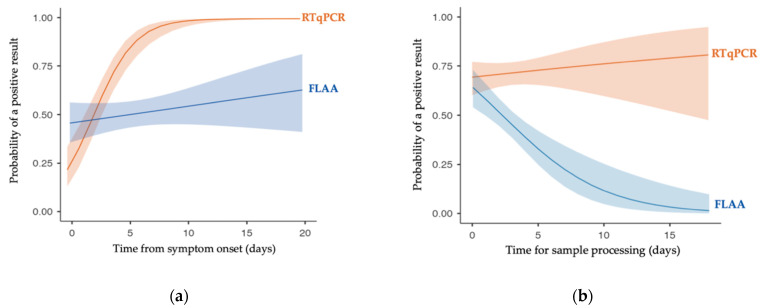
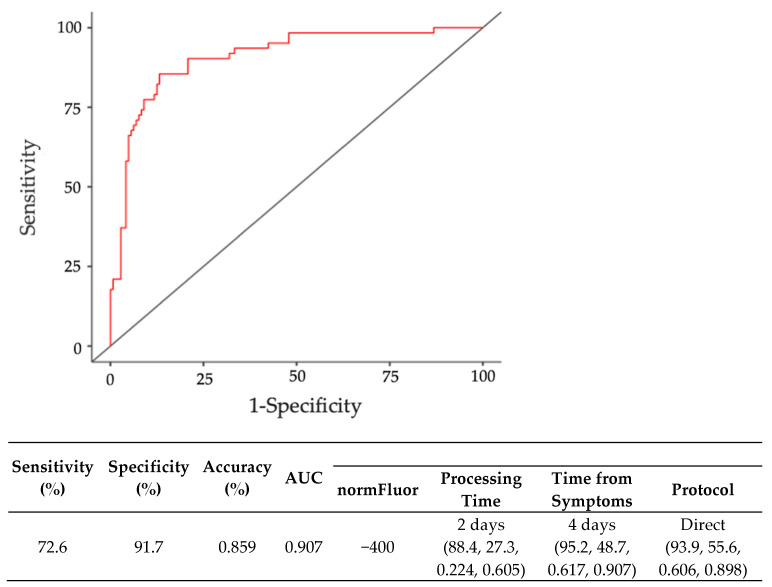
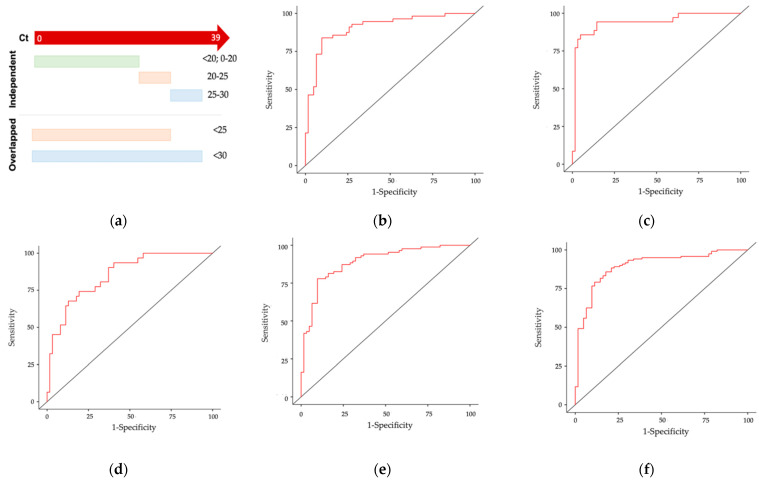
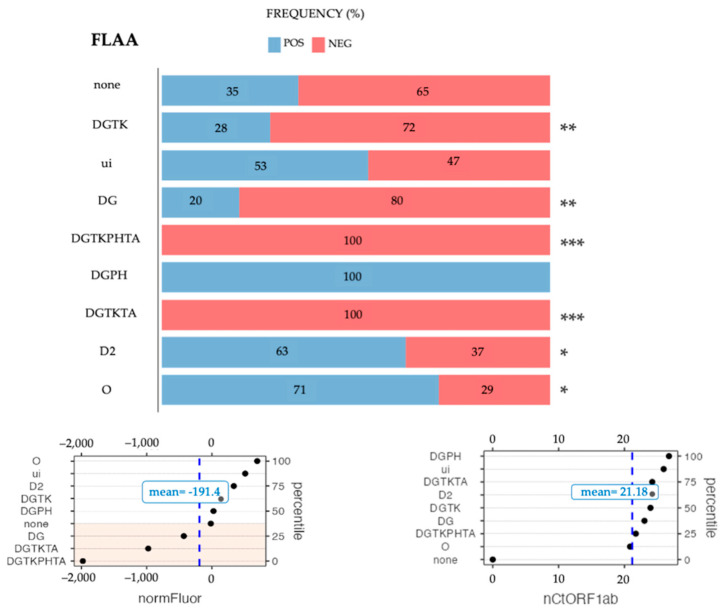
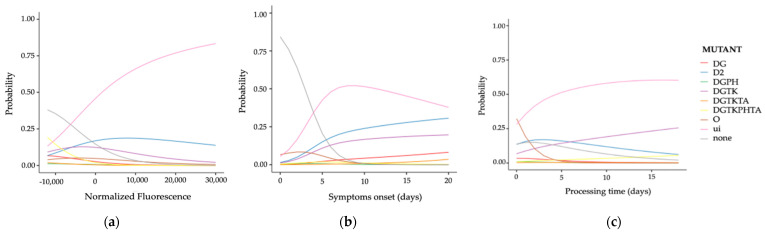
The COVID-19 pandemic has been a main concern over the last two years and has become one of the most important crises in the history of human health. Today, there is still a need for affordable and reliable diagnostic tests for massive disease monitoring. Previously, a set of highly specific DNA-aptamers (C7/C9) binding to the SARS-CoV-2 Spike (S) protein were isolated but its performance in clinical samples remained to be tested. Here, 242 samples were collected through three different methods and subjected to florescence-linked aptamer assays (FLAA) based on C7/C9 aptamers through two readout protocols. Then, a step-by-step statistical approach which included agreement tests, proportion comparisons and binomial and multinomial logistic regressions was used to predict optimal conditions for the novel C7/C9 FLAA test. RTqPCR threshold cycles, symptoms onset and processing time were influential factors on FLAA test results. Naturally occurring mutations on S were also detected and analyzed. Aminoacidic substitutions D614G and T732A appeared relevant for aptamer recognition although further studies are necessary. The methodology presented here is the first step to determine the performance and diagnosis across a range of clinical contexts and it might serve as a base for a complete analysis applicable to other designs of new diagnostic tests.
Keywords: COVID-19; FLAA; SARS-CoV-2; aptamer; diagnostic test; spike protein.
Conflict of interest statement
The authors declare no conflict of interest. The funders had no role in the design of the study; in the collection, analyses, or interpretation of data; in the writing of the manuscript; or in the decision to publish the results.
Figures
Similar articles
-
DNA aptamer selection for SARS-CoV-2 spike glycoprotein detection.Anal Biochem. 2022 May 15;645:114633. doi: 10.1016/j.ab.2022.114633. Epub 2022 Mar 2. Anal Biochem. 2022. PMID: 35247355 Free PMC article.
-
Effectiveness and cost-effectiveness of four different strategies for SARS-CoV-2 surveillance in the general population (CoV-Surv Study): a structured summary of a study protocol for a cluster-randomised, two-factorial controlled trial.Trials. 2021 Jan 8;22(1):39. doi: 10.1186/s13063-020-04982-z. Trials. 2021. PMID: 33419461 Free PMC article.
-
Designing of peptide aptamer targeting the receptor-binding domain of spike protein of SARS-CoV-2: an in silico study.Mol Divers. 2022 Feb;26(1):157-169. doi: 10.1007/s11030-020-10171-6. Epub 2021 Jan 2. Mol Divers. 2022. PMID: 33389440 Free PMC article.
-
In-Silico Selection of Aptamer Targeting SARS-CoV-2 Spike Protein.Int J Mol Sci. 2022 May 22;23(10):5810. doi: 10.3390/ijms23105810. Int J Mol Sci. 2022. PMID: 35628622 Free PMC article.
-
[SARS-CoV-2 and Microbiological Diagnostic Dynamics in COVID-19 Pandemic].Mikrobiyol Bul. 2020 Jul;54(3):497-509. doi: 10.5578/mb.69839. Mikrobiyol Bul. 2020. PMID: 32755524 Review. Turkish.
Cited by
-
Recent Advances in Biological Applications of Aptamer-Based Fluorescent Biosensors.Molecules. 2023 Oct 29;28(21):7327. doi: 10.3390/molecules28217327. Molecules. 2023. PMID: 37959747 Free PMC article. Review.
-
Novel enzyme-linked aptamer-antibody sandwich assay and hybrid lateral flow strip for SARS-CoV-2 detection.J Nanobiotechnology. 2024 Jan 3;22(1):5. doi: 10.1186/s12951-023-02191-9. J Nanobiotechnology. 2024. PMID: 38169397 Free PMC article.
-
Aptamers and Nanobodies as New Bioprobes for SARS-CoV-2 Diagnostic and Therapeutic System Applications.Biosensors (Basel). 2024 Mar 15;14(3):146. doi: 10.3390/bios14030146. Biosensors (Basel). 2024. PMID: 38534253 Free PMC article. Review.
-
Recent Advances in Aptamer-Based Point-of-Care Testing.Sensors (Basel). 2025 Jun 6;25(12):3587. doi: 10.3390/s25123587. Sensors (Basel). 2025. PMID: 40573474 Free PMC article. Review.
References
-
- Gupta A., Anand A., Jain N., Goswami S., Anantharaj A., Patil S., Singh R., Kumar A., Shrivastava T., Bhatnagar S., et al. A Novel G-Quadruplex Aptamer-Based Spike Trimeric Antigen Test for the Detection of SARS-CoV-2. Mol. Ther. Nucleic Acids. 2021;26:321–332. doi: 10.1016/j.omtn.2021.06.014. - DOI - PMC - PubMed
Grants and funding
LinkOut - more resources
Full Text Sources
Research Materials
Miscellaneous
