

The CRK5 and WRKY53 Are Conditional Regulators of Senescence and Stomatal Conductance in Arabidopsis
- PMID: 36428987
- PMCID: PMC9688832
- DOI: 10.3390/cells11223558
The CRK5 and WRKY53 Are Conditional Regulators of Senescence and Stomatal Conductance in Arabidopsis
Abstract
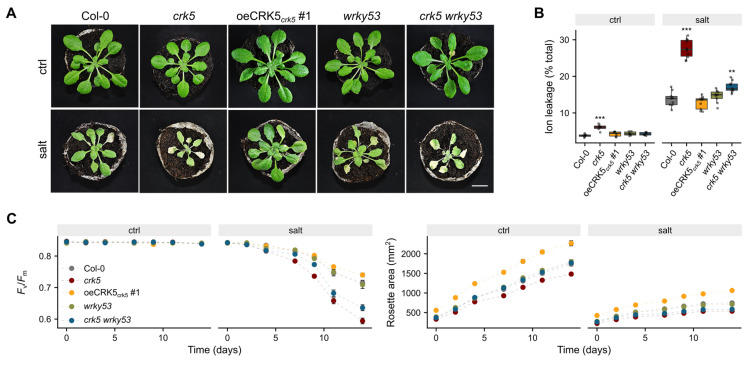
In Arabidopsis thaliana, cysteine-rich receptor-like kinases (CRKs) constitute a large group of membrane-localized proteins which perceive external stimuli and transduce the signal into the cell. Previous reports based on their loss-of-function phenotypes and expression profile support their role in many developmental and stress-responsive pathways. Our study revealed that one member of this family, CRK5, acts as a negative regulator of leaf aging. Enrichment of the CRK5 promoter region in W-box cis-elements demonstrated that WRKY transcription factors control it. We observed significantly enhanced WRKY53 expression in crk5 and reversion of its early-senescence phenotype in the crk5 wrky53 line, suggesting a negative feedback loop between these proteins antagonistically regulating chlorophyll a and b contents. Yeast-two hybrid assay showed further that CRK5 interacts with several proteins involved in response to water deprivation or calcium signaling, while gas exchange analysis revealed a positive effect of CRK5 on water use efficiency. Consistent with that, the crk5 plants showed disturbed foliar temperature, stomatal conductance, transpiration, and increased susceptibility to osmotic stress. These traits were fully or partially reverted to wild-type phenotype in crk5 wrky53 double mutant. Obtained results suggest that WRKY53 and CRK5 are antagonistic regulators of chlorophyll synthesis/degradation, senescence, and stomatal conductance.
Keywords: development; foliar temperature; osmotic stress; receptor-like kinase; senescence; stomatal conductance; transcription factor; water-use efficiency.
Conflict of interest statement
The authors declare no conflicts of interest.
Figures


Similar articles
-
Cysteine-rich receptor-like kinase CRK5 as a regulator of growth, development, and ultraviolet radiation responses in Arabidopsis thaliana.J Exp Bot. 2015 Jun;66(11):3325-37. doi: 10.1093/jxb/erv143. Epub 2015 May 11. J Exp Bot. 2015. PMID: 25969551 Free PMC article.
-
Overexpression of an Arabidopsis cysteine-rich receptor-like protein kinase, CRK5, enhances abscisic acid sensitivity and confers drought tolerance.J Exp Bot. 2016 Sep;67(17):5009-27. doi: 10.1093/jxb/erw266. Epub 2016 Jul 12. J Exp Bot. 2016. PMID: 27406784 Free PMC article.
-
The single-stranded DNA-binding protein WHIRLY1 represses WRKY53 expression and delays leaf senescence in a developmental stage-dependent manner in Arabidopsis.Plant Physiol. 2013 Oct;163(2):746-56. doi: 10.1104/pp.113.223412. Epub 2013 Aug 6. Plant Physiol. 2013. PMID: 23922267 Free PMC article.
-
The complex regulation of WRKY53 during leaf senescence of Arabidopsis thaliana.Eur J Cell Biol. 2010 Feb-Mar;89(2-3):133-7. doi: 10.1016/j.ejcb.2009.10.014. Epub 2009 Dec 9. Eur J Cell Biol. 2010. PMID: 20004496 Review.
-
Stomatal patterning and development.Curr Top Dev Biol. 2010;91:267-97. doi: 10.1016/S0070-2153(10)91009-0. Curr Top Dev Biol. 2010. PMID: 20705185 Review.
Cited by
-
Abolishing ANAC017-Mediated Mitochondria Retrograde Signalling Alleviates Ammonium Toxicity in Arabidopsis thaliana.Physiol Plant. 2025 Jul-Aug;177(4):e70353. doi: 10.1111/ppl.70353. Physiol Plant. 2025. PMID: 40598746 Free PMC article.
-
Crosstalk Between Abiotic and Biotic Stresses Responses and the Role of Chloroplast Retrograde Signaling in the Cross-Tolerance Phenomena in Plants.Cells. 2025 Jan 23;14(3):176. doi: 10.3390/cells14030176. Cells. 2025. PMID: 39936968 Free PMC article. Review.
-
Deletion of the sugar importer gene OsSWEET1b accelerates sugar starvation-promoted leaf senescence in rice.Plant Physiol. 2024 Jun 28;195(3):2176-2194. doi: 10.1093/plphys/kiae098. Plant Physiol. 2024. PMID: 38423969 Free PMC article.
-
The Contribution of PGPR in Salt Stress Tolerance in Crops: Unravelling the Molecular Mechanisms of Cross-Talk between Plant and Bacteria.Plants (Basel). 2023 Jun 1;12(11):2197. doi: 10.3390/plants12112197. Plants (Basel). 2023. PMID: 37299176 Free PMC article. Review.
References
-
- Guo Y., Cai Z., Gan S. Transcriptome of Arabidopsis leaf senescence. Plant Cell Environ. 2004;27:521–549. doi: 10.1111/j.1365-3040.2003.01158.x. - DOI
Publication types
MeSH terms
Substances
LinkOut - more resources
Full Text Sources
Molecular Biology Databases
