Upregulation of YKL-40 Promotes Metastatic Phenotype and Correlates with Poor Prognosis and Therapy Response in Patients with Colorectal Cancer
- PMID: 36428997
- PMCID: PMC9688424
- DOI: 10.3390/cells11223568
Upregulation of YKL-40 Promotes Metastatic Phenotype and Correlates with Poor Prognosis and Therapy Response in Patients with Colorectal Cancer
Abstract
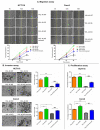
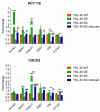
YKL-40 is a heparin- and chitin-binding glycoprotein that belongs to the family of glycosyl hydrolases but lacks enzymatic properties. It affects different (patho)physiological processes, including cancer. In different tumors, YKL-40 gene overexpression has been linked to higher cell proliferation, angiogenesis, and vasculogenic mimicry, migration, and invasion. Because, in colorectal cancer (CRC), the serological YKL-40 level may serve as a risk predictor and prognostic biomarker, we investigated the underlying mechanisms by which it may contribute to tumor progression and the clinical significance of its tissue expression in metastatic CRC. We demonstrated that high-YKL-40-expressing HCT116 and Caco2 cells showed increased motility, invasion, and proliferation. YKL-40 upregulation was associated with EMT signaling activation. In the AOM/DSS mouse model, as well as in tumors and sera from CRC patients, elevated YKL-40 levels correlated with high-grade tumors. In retrospective analyses of six independent cohorts of CRC patients, elevated YKL-40 expression correlated with shorter survival in patients with advanced CRC. Strikingly, high YKL-40 tissue levels showed a predictive value for a better response to cetuximab, even in patients with stage IV CRC and mutant KRAS, and worse sensitivity to oxaliplatin. Taken together, our findings establish that tissue YKL-40 overexpression enhances CRC metastatic potential, highlighting this gene as a novel prognostic candidate, a predictive biomarker for therapy response, and an attractive target for future therapy in CRC.
Keywords: YKL-40; biomarkers; colorectal cancer; metastasis.
Conflict of interest statement
The authors declare no conflict of interest.
Figures


Similar articles
-
Plasma YKL-40 in patients with metastatic colorectal cancer treated with first line oxaliplatin-based regimen with or without cetuximab: RESULTS from the NORDIC VII Study.PLoS One. 2014 Feb 3;9(2):e87746. doi: 10.1371/journal.pone.0087746. eCollection 2014. PLoS One. 2014. PMID: 24498368 Free PMC article. Clinical Trial.
-
Elevated pretreatment serum concentration of YKL-40: an independent prognostic biomarker for poor survival in patients with colorectal cancer.Med Oncol. 2014 Aug;31(8):85. doi: 10.1007/s12032-014-0085-6. Epub 2014 Jul 5. Med Oncol. 2014. PMID: 24996799
-
YKL-40 expression could be a poor prognostic marker in the breast cancer tissue.Tumour Biol. 2014 Jan;35(1):277-86. doi: 10.1007/s13277-013-1036-0. Epub 2013 Aug 6. Tumour Biol. 2014. PMID: 23918300
-
Role of chitinase-like proteins in cancer.Biol Chem. 2016 Mar;397(3):231-47. doi: 10.1515/hsz-2015-0269. Biol Chem. 2016. PMID: 26733160 Review.
-
Serum YKL-40, a new prognostic biomarker in cancer patients?Cancer Epidemiol Biomarkers Prev. 2006 Feb;15(2):194-202. doi: 10.1158/1055-9965.EPI-05-0011. Cancer Epidemiol Biomarkers Prev. 2006. PMID: 16492905 Review.
Cited by
-
Potential Roles and Future Perspectives of Chitinase 3-like 1 in Macrophage Polarization and the Development of Diseases.Int J Mol Sci. 2023 Nov 9;24(22):16149. doi: 10.3390/ijms242216149. Int J Mol Sci. 2023. PMID: 38003338 Free PMC article. Review.
-
Chemosensitizing effect of pentoxifylline in sensitive and multidrug-resistant non-small cell lung cancer cells.Cancer Drug Resist. 2024 May 20;7:19. doi: 10.20517/cdr.2024.04. eCollection 2024. Cancer Drug Resist. 2024. PMID: 38835347 Free PMC article.
-
Heparin-binding of the human chitinase-like protein YKL-40 is allosterically modified by chitin oligosaccharides.Biochem Biophys Rep. 2024 Dec 24;41:101908. doi: 10.1016/j.bbrep.2024.101908. eCollection 2025 Mar. Biochem Biophys Rep. 2024. PMID: 39811191 Free PMC article.
-
Interaction of Ceramic Implant Materials with Immune System.Int J Mol Sci. 2023 Feb 20;24(4):4200. doi: 10.3390/ijms24044200. Int J Mol Sci. 2023. PMID: 36835610 Free PMC article. Review.
-
Chitinase 3-like 1 expression associated with lymphatic metastasis and prognosis in urothelial carcinoma of the bladder.Clin Transl Immunology. 2024 Apr 15;13(4):e1505. doi: 10.1002/cti2.1505. eCollection 2024. Clin Transl Immunology. 2024. PMID: 38623539 Free PMC article.
References
-
- Cutsem E.V., Lenz H.J., Kohne C.H., Heinemann V., Tejpar S., Melezínek I., Beier F., Stroh C., Rougier P., van Krieken J.H.J.M., et al. Fluorouracil, leucovorin, and irinotecan plus cetuximab treatment and RAS mutations in colorectal cancer. J. Clin. Oncol. 2015;33:692–700. doi: 10.1200/JCO.2014.59.4812. - DOI - PubMed
Publication types
MeSH terms
Substances
LinkOut - more resources
Full Text Sources
Medical
Miscellaneous

