. 2022 Nov 12;11(22):3579.
doi: 10.3390/cells11223579.

S100A8-Mediated NLRP3 Inflammasome-Dependent Pyroptosis in Macrophages Facilitates Liver Fibrosis Progression

Affiliations

S100A8-Mediated NLRP3 Inflammasome-Dependent Pyroptosis in Macrophages Facilitates Liver Fibrosis Progression

Yan Liu et al. Cells. .

Abstract

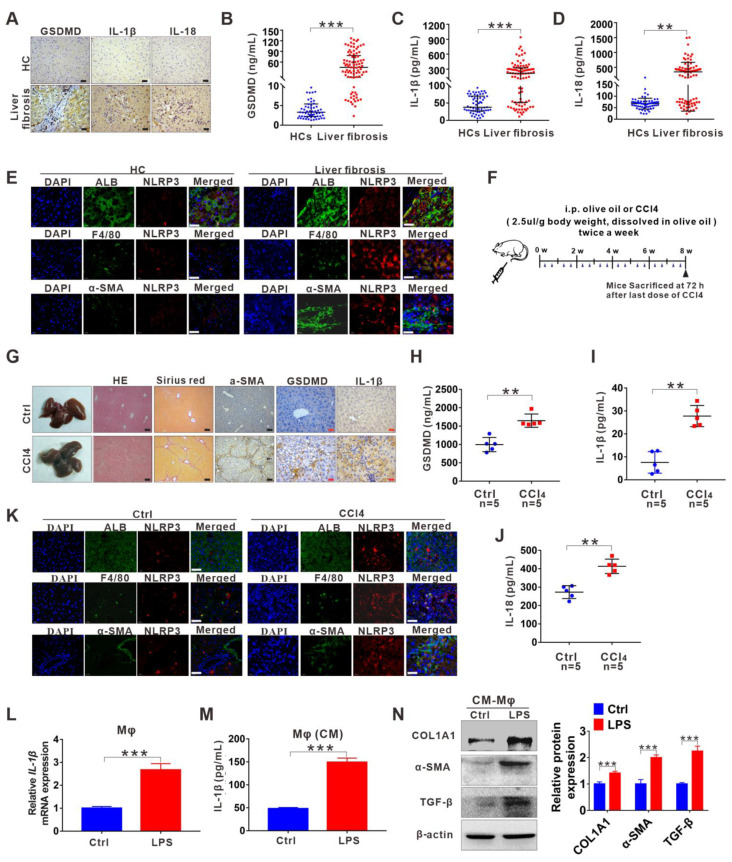
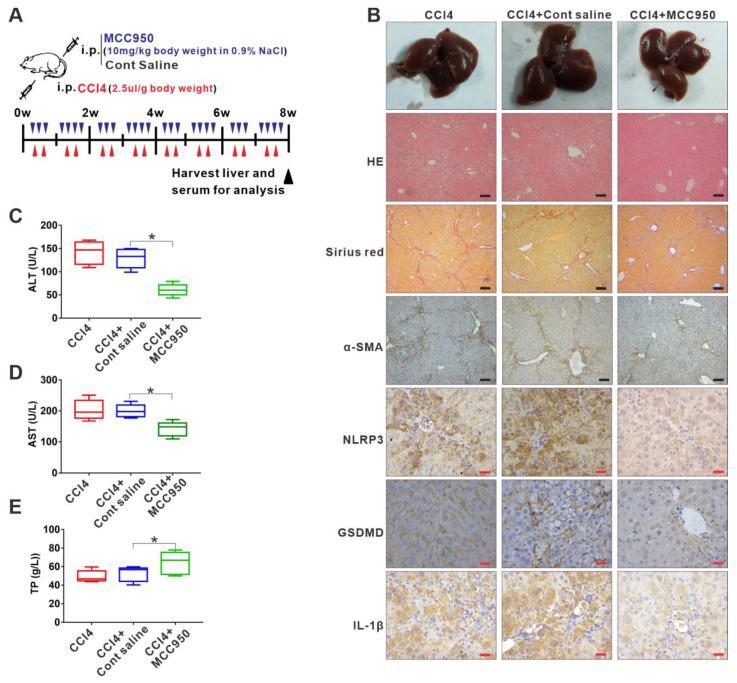
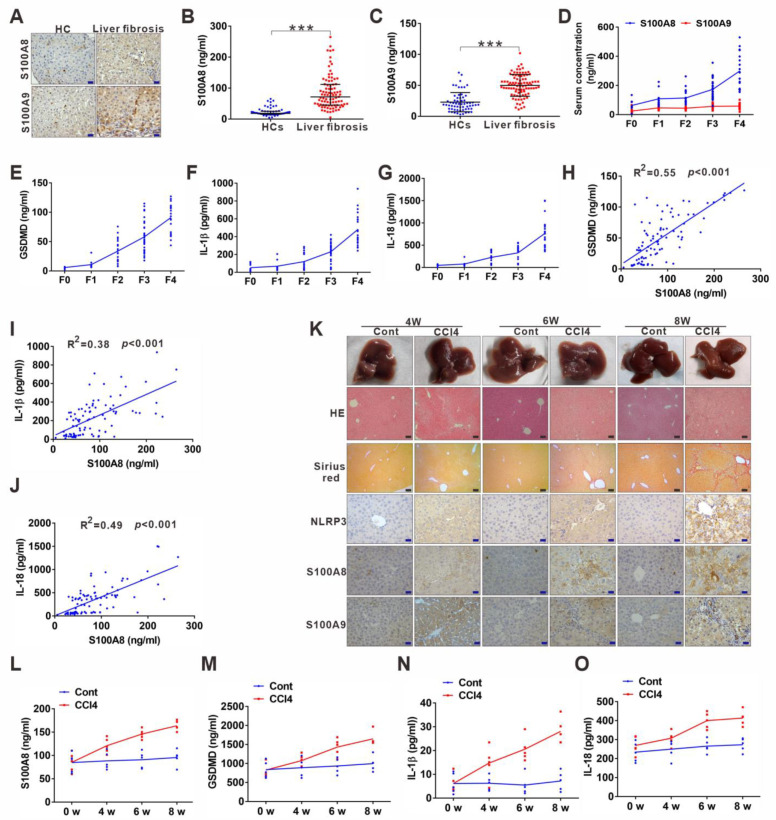
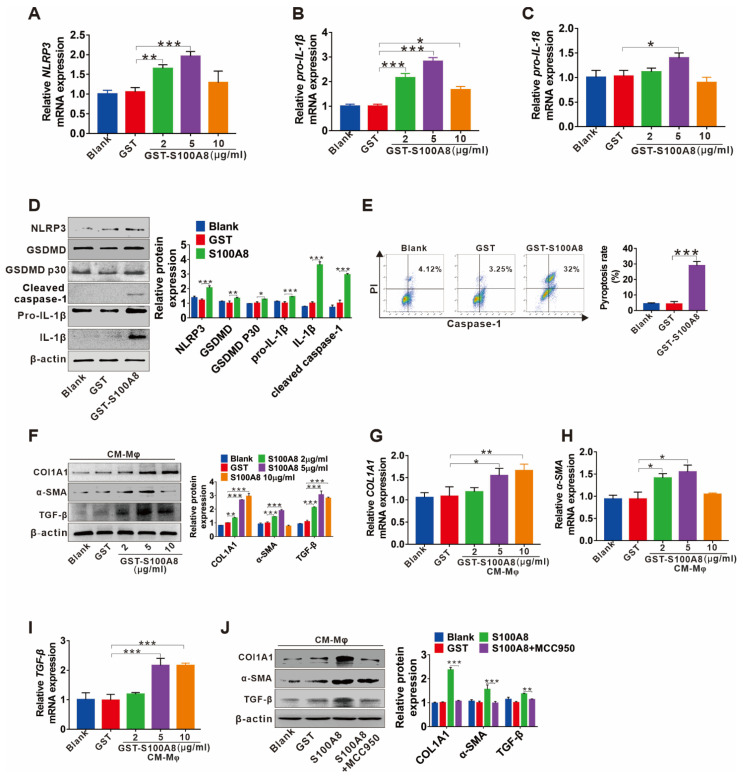
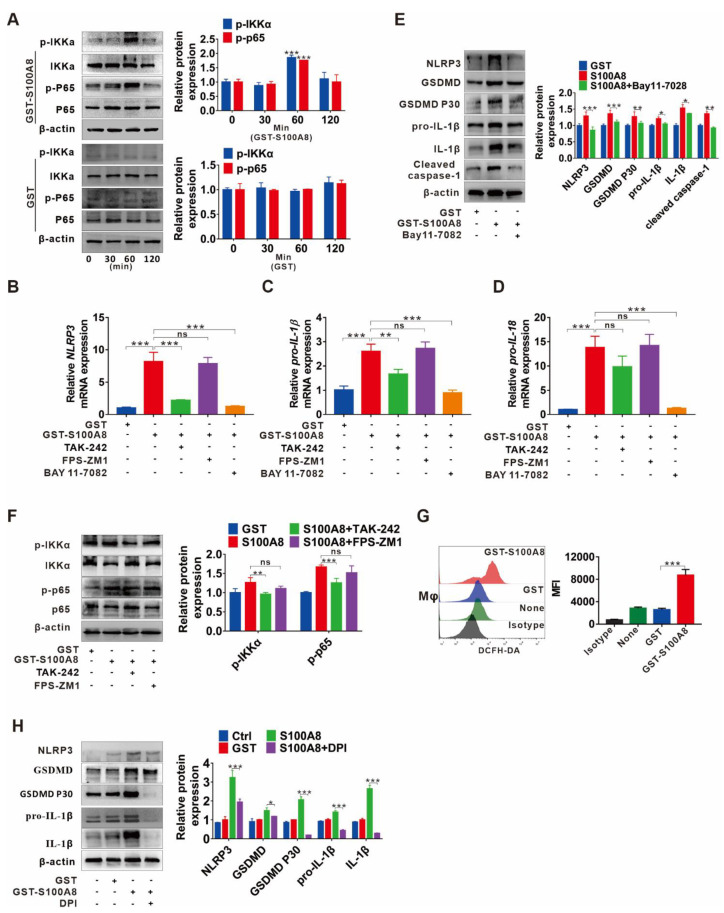
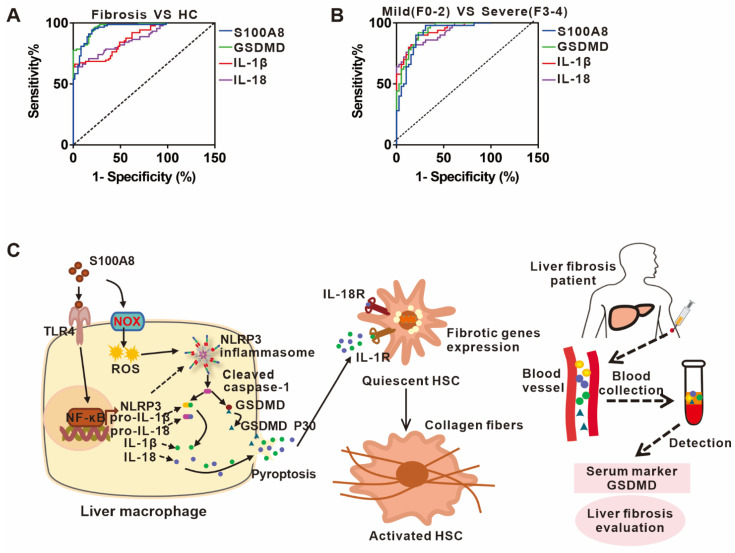
NLRP3 inflammasome-dependent pyroptosis has been implicated in liver fibrosis progression. However, the definite intrahepatic cell types that undergo pyroptosis and the underlying mechanism as well as the clinical importance remain unclear. Here, augmented levels of pyroptosis-related indicators GSDMD, IL-1β, and IL-18 were verified in both liver fibrosis patients and CCl4-induced fibrotic mouse model. Confocal imaging of NLRP3 with albumin, F4/80 or α-SMA revealed that enhanced NLRP3 was mainly localized to kupffer cells (KCs), indicating that KCs are major cell types that undergo pyroptosis. Targeting pyroptosis by inhibitor MCC950 attenuated the severity and ameliorated liver function in fibrosis models. In addition, elevated S100A8 in liver fibrosis patients was correlated with pyroptosis-related indicators. S100A8 stimulated pyroptotic death of macrophages, which resulted in activation of human hepatic stellate cell line LX-2 cells and increased collagen deposition. Mechanistically, S100A8 activated TLR4/NF-κB signaling and upregulated its target genes NLRP3, pro-IL-1β, and pro-IL-18 expression, and induced reactive oxygen (ROS) abundance to activate NLRP3 inflammasome, finally leading to pyroptotic cell death in macrophages. More importantly, circulating GSDMD had the optimal predicting value for liver fibrosis progression. In conclusion, S100A8-mediated NLRP3 inflammasome-dependent pyroptosis by TLR4/NF-κB activation and ROS production in macrophages facilitates liver fibrosis progression. The identified GSDMD has the potential to be a biomarker for liver fibrosis evaluation.

Keywords: GSDMD; NLRP3; S100A8; liver fibrosis.


Conflict of interest statement

The authors declare no conflict of interest.

Figures

Figure 1
Figure 1
NLRP3 inflammasome-dependent pyroptosis occurs in liver fibrosis. (A) IHC staining for GSDMD, IL-1β, and IL-18 in liver sections from liver fibrosis patients and HCs. Scale bar: 40 µm. (BD) ELISA analyses of serum levels of GSDMD (B), IL-1β (C), and IL-18 (D) in liver fibrosis patients (n = 89) and HCs (n = 60). (E) Representative immunofluorescence images of NLRP3 (red) and albumin (hepatocyte marker) (top), F4/80 (KC marker) (middle) or α-SMA (HSC marker) (bottom) (green) from the human fibrotic liver tissues. Scale bar: 40 µm. (F) Schematic diagram of the study. Liver fibrosis was induced by CCl4 injection for 8 weeks. (G) Representative mouse liver histology of H&E, Sirius Red staining, and IHC staining for α-SMA, GSDMD, and IL-1β. Black scale bar: 100 µm; Red scale bar: 50 µm. (HJ) ELISA analyses for serum levels of GSDMD (H), IL-1β (I), and IL-18 (J) in CCl4 group mouse (n = 5) and vehicle group mouse (n = 5). (K) Representative immunofluorescence images of NLRP3 (red) and albumin (hepatocyte marker) (top), F4/80 (KC marker) (middle) or α-SMA (HSC marker) (bottom) (green) from the 8-week CCl4-treated mouse liver. The vehicle group mouse liver was used as a control. Scale bar: 40 µm. (L) The qRT-PCR analysis for mRNA levels of IL-1β in THP-1 macrophages treated with LPS to induce pyroptosis. (M) ELISA analysis for IL-1β expression in supernatants from THP-1. (N) Western blot analysis of COL1A1, α-SMA, and TGF-β expression in LX-2 cells which were exposed to CM from LPS-treated THP-1 macrophages. The protein expression was quantified by densitometry and normalized to β-actin and are shown as fold changes relative to the control group (right panel). ** p < 0.01, *** p < 0.001.
Figure 2
Figure 2
Inhibition of NLRP3 inflammasome-dependent pyroptosis alleviates liver fibrosis progression. (A) Experimental protocol of NLRP3 inhibitor MCC950 or saline application based on CCl4 injection in mice. (B) Representative liver histology of H&E and Sirius Red staining. The expression of α-SMA, NLRP3, GSDMD, and IL-1β was determined by immunohistochemistry. Black scale bar: 100 µm; Red scale bar: 50 µm. (CE) Serum levels of ALT, AST, and TP were measured. * p < 0.05.
Figure 3
Figure 3
DAMP S100A8 along with NLRP3 inflammasome-dependent pyroptosis is positively related to the progression of liver fibrosis. (A) Representative IHC images for S100A8 and S100A9 in liver sections from liver fibrosis patients and HCs. (B,C) ELISA analyses for serum levels of S100A8 and S100A9 in liver fibrosis patients and HCs. (D) Comparison of serum S100A8 and S100A9 levels in liver fibrosis patients with different phases. (EG) Distribution of serum GSDMD (E), IL-1β (F), and IL-18 (G) levels in liver fibrosis patients with different phases (F0–4). (HJ) Correlation between serum S100A8 levels and GSDMD (H), IL-1β (I) or IL-18 (J) levels in liver fibrosis patients. (K) Representative mouse liver morphology and staining with H&E and Sirius Red. (LO) IHC staining of mouse liver sections for NLRP3, S100A8, and S100A9. Black scale bar: 100 µm; Red scale bar: 50 µm. ELISA analyses for serum levels of S100A8 (L), GSDMD (M), IL-1β (n), and IL-18 (O) in 4-, 6-, and 8 week-mouse models of liver fibrosis. *** p < 0.001.
Figure 4
Figure 4
S100A8-mediated NLRP3 inflammasome-dependent pyroptotic macrophage death amplify the activation of human hepatic stellate cells. (AC) The qRT–PCR analysis for the mRNA levels of NLRP3, pro-IL-1β, and pro-IL-18 in THP-1 macrophages treated with 0, 2, 5 or 10 µg/mL rhS100A8 or 5 µg/mL GST for 24 h. (D) The protein levels of NLRP3, GSDMD, GSDMD P30, pro-IL-1β, mature IL-1β, and cleaved caspase-1 were detected by Western blot in THP-1 macrophages treated with 5 µg/mL GST or rhS100A8. The protein expression was quantified by densitometry and normalized to β-actin and are shown as fold changes relative to the GST group (right panel). (E) PI and active caspase-1 double staining of pyroptotic cell death by flow cytometry in THP-1 macrophages treated with 5 µg/mL GST or rhS100A8. (FI) Western blot analysis (F) and qRT-PCR analysis (G–I) of COL1A1, α-SMA, and TGF-β in LX-2 cells exposed to CM from THP-1 macrophages that were treated with 0, 2, 5 or 10 µg/mL of rhS100A8 or 5 µg/mL GST. (J) Western blot analysis of COL1A1, α-SMA, and TGF-β in LX-2 cells exposed to CM from THP-1 macrophages that were treated with 5 µg/mL of rhS100A8 with or without 1 h of MCC950 pretreatment. The protein expression was quantified by densitometry and normalized to β-actin and are shown as fold changes relative to the GST group (right panel). * p < 0.05, ** p < 0.01, *** p < 0.001.
Figure 5
Figure 5
TLR4/NF-κB signaling cascade and ROS abundance are responsible for S100A8-induced NLRP3 inflammasome-dependent pyroptotic death in macrophages. (A) Western blot analysis of p65, p-p65, IKKα, and p-IKKα expression in THP-1 macrophages treated with GST-rhS100A8 or GST for 0, 30, 60 or 120 min. The protein expression was quantified by densitometry and normalized to β-actin and are shown as fold changes relative to the 0 min group (right panel). (BE) THP-1 macrophages were exposed to 5 µg/mL rhS100A8 with or without 1 h of BAY 11-7082, TAK-242 or FPS-ZM1 pretreatment. The qRT-PCR analysis was performed to detect the mRNA levels of NLRP3 (B), pro-IL-1β (C), and pro-IL-18 (D). Western blot analysis was used to determine the protein expression of NLRP3, GSDMD, GSDMD P30, pro-IL-1β, mature IL-1β, and cleaved caspase-1 (E). The protein expression was quantified by densitometry and normalized to β-actin and are shown as fold changes relative to the GST group (right panel). (F) THP-1 macrophages were pretreated with TAK-242 or FPS-ZM1 for 1 h and then exposed to 5 µg/mL of rhS100A8. Western blot analysis was used to determine the expression of p-p65 and p-IKKα. The protein expression was quantified by densitometry and normalized to β-actin and are shown as fold changes relative to the GST group (right panel). (G) Flow cytometry analysis of ROS levels in THP-1 macrophages treated with rhS100A8 for 6 h. (H) THP-1 macrophages were exposed to 5 µg/mL of rhS100A8 with or without 1 h of DPI pretreatment. Protein expression levels of NLRP3, GSDMD, GSDMD P30, pro-IL-1β, and mature IL-1β were determined by Western blot. The protein expression was quantified by densitometry and normalized to β-actin and are shown as fold changes relative to the GST group (right panel); ns, not significant; * p < 0.05, ** p < 0.01, *** p < 0.001.
Figure 6
Figure 6
The potential predictive powers of S100A8, GSDMD, IL-1β, and IL-18 for the occurrence and severity of liver fibrosis. (A) ROC curves of serum S100A8, GSDMD, IL-1β, and IL-18 for distinguishing liver fibrosis patients from HCs. (B) ROC curve, of serum S100A8, GSDMD, IL-1β, and IL-18 for detecting moderate-to-severe liver fibrosis from no or mild liver fibrosis in liver fibrosis patients. (C) A working model illustrating that S100A8-mediated NLRP3 inflammasome-dependent pyroptosis in macrophages facilitates liver fibrosis progression, and that the identified GSDMD may be used as a potential biomarker during liver fibrosis onset and progression.

References

    1. Hernandez-Gea V., Friedman S.L. Pathogenesis of liver fibrosis. Annu. Rev. Pathol. 2011;6:425–456. doi: 10.1146/annurev-pathol-011110-130246. - DOI - PubMed
    1. Iredale J.P. Models of liver fibrosis: Exploring the dynamic nature of inflammation and repair in a solid organ. J. Clin. Investig. 2007;117:539–548. doi: 10.1172/JCI30542. - DOI - PMC - PubMed
    1. Lo R.C., Kim H. Histopathological evaluation of liver fibrosis and cirrhosis regression. Clin. Mol. Hepatol. 2017;23:302–307. doi: 10.3350/cmh.2017.0078. - DOI - PMC - PubMed
    1. Schuppan D., Kim Y.O. Evolving therapies for liver fibrosis. J. Clin. Investig. 2013;123:1887–1901. doi: 10.1172/JCI66028. - DOI - PMC - PubMed
    1. Strowig T., Henao-Mejia J., Elinav E., Flavell R. Inflammasomes in health and disease. Nature. 2012;481:278–286. doi: 10.1038/nature10759. - DOI - PubMed

Publication types

LinkOut - more resources