

Patient-Derived Xenografts and Organoids Recapitulate Castration-Resistant Prostate Cancer with Sustained Androgen Receptor Signaling
- PMID: 36429059
- PMCID: PMC9688335
- DOI: 10.3390/cells11223632
Patient-Derived Xenografts and Organoids Recapitulate Castration-Resistant Prostate Cancer with Sustained Androgen Receptor Signaling
Abstract
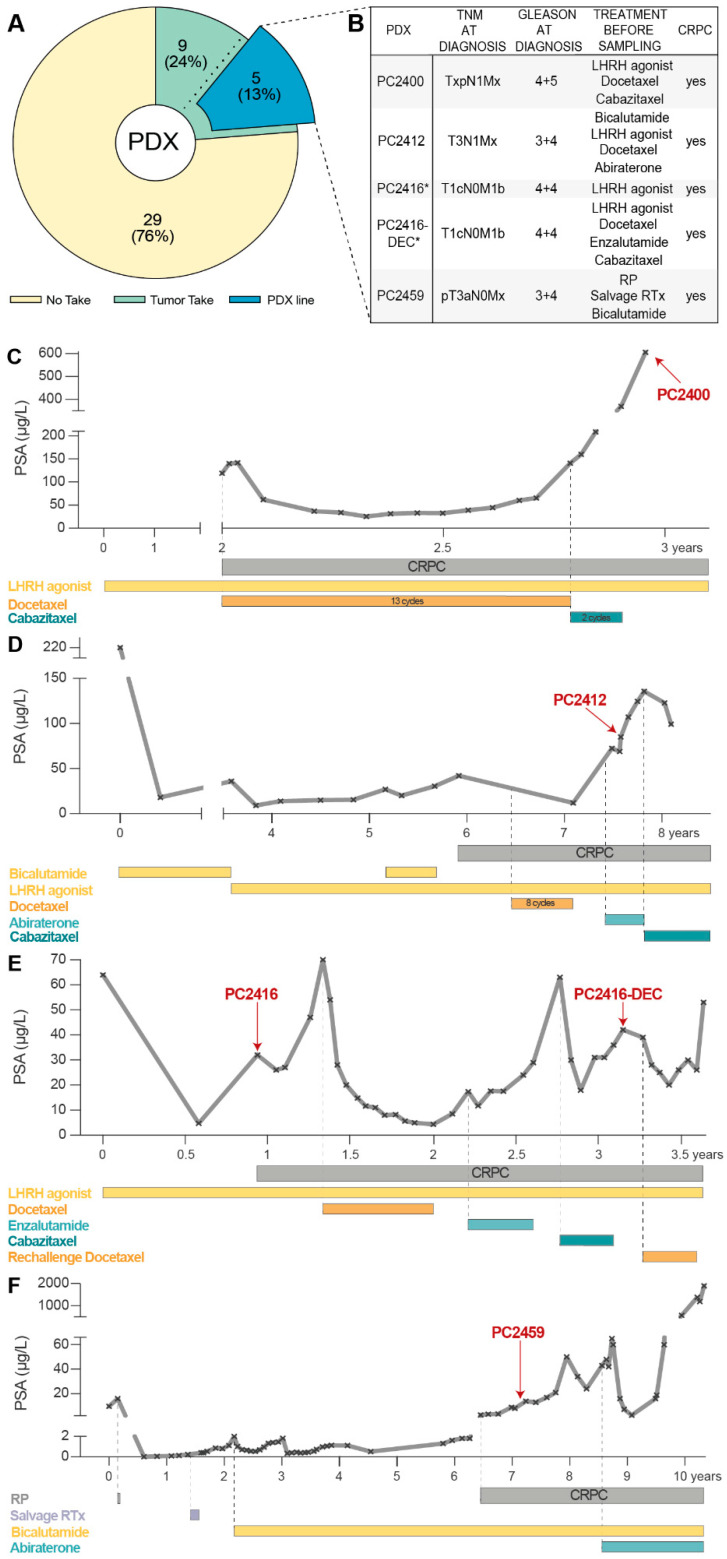
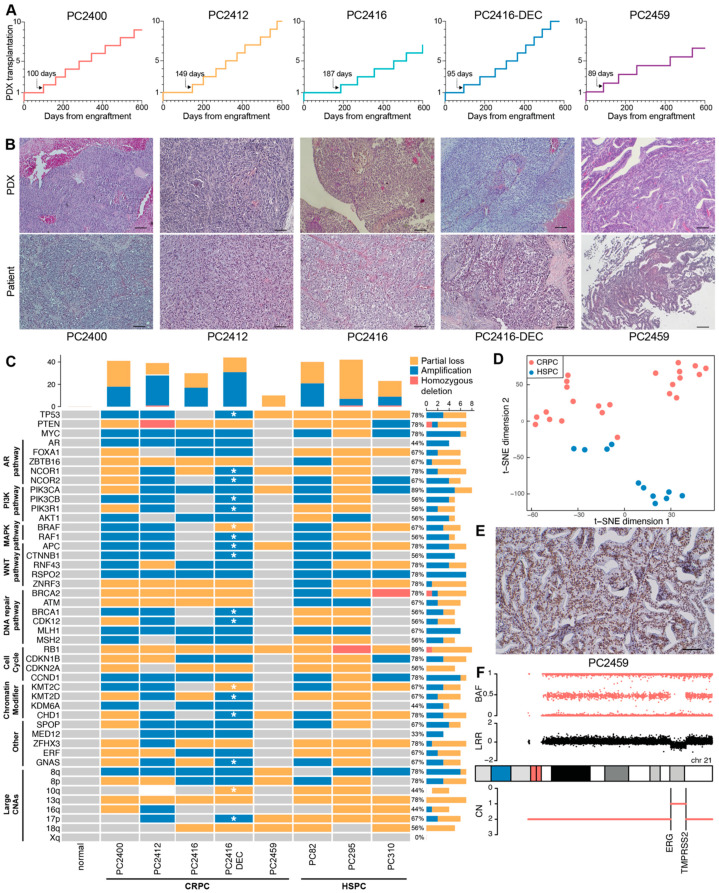
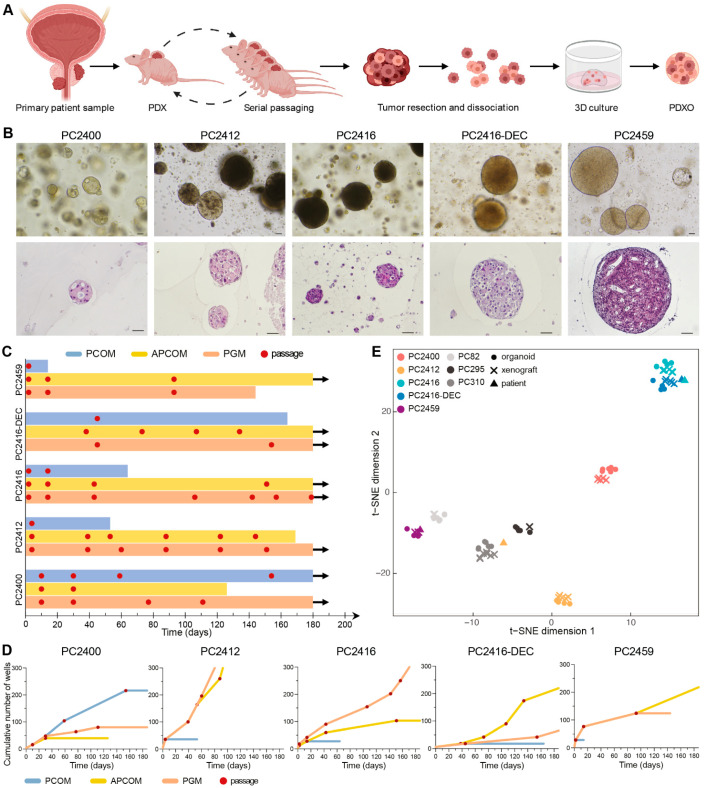
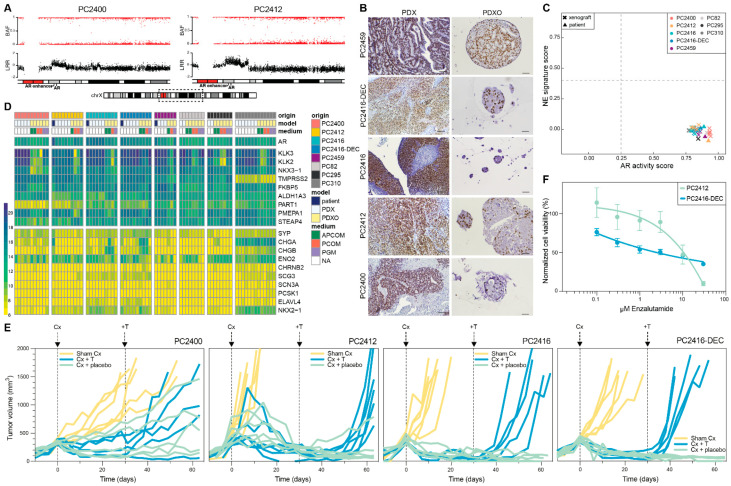
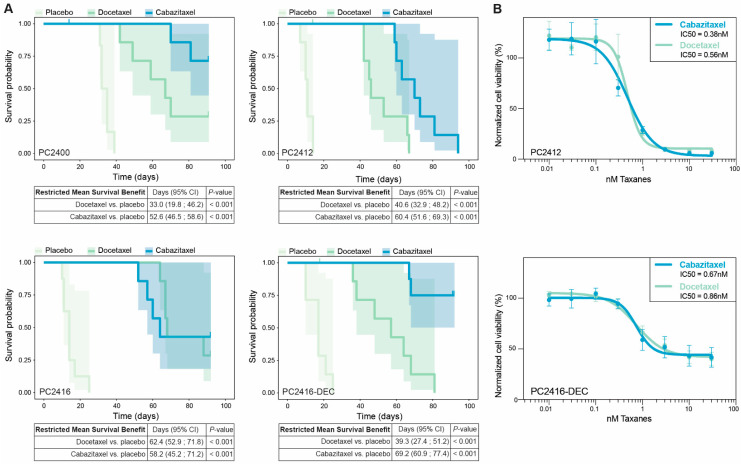
Castration-resistant prostate cancer (CRPC) remains an incurable and lethal malignancy. The development of new CRPC treatment strategies is strongly impeded by the scarcity of representative, scalable and transferable preclinical models of advanced, androgen receptor (AR)-driven CRPC. Here, we present contemporary patient-derived xenografts (PDXs) and matching PDX-derived organoids (PDXOs) from CRPC patients who had undergone multiple lines of treatment. These models were comprehensively profiled at the morphologic, genomic (n = 8) and transcriptomic levels (n = 81). All are high-grade adenocarcinomas that exhibit copy number alterations and transcriptomic features representative of CRPC patient cohorts. We identified losses of PTEN and RB1, MYC amplifications, as well as genomic alterations in TP53 and in members of clinically actionable pathways such as AR, PI3K and DNA repair pathways. Importantly, the clinically observed continued reliance of CRPC tumors on AR signaling is preserved across the entire set of models, with AR amplification identified in four PDXs. We demonstrate that PDXs and PDXOs faithfully reflect donor tumors and mimic matching patient drug responses. In particular, our models predicted patient responses to subsequent treatments and captured sensitivities to previously received therapies. Collectively, these PDX-PDXO pairs constitute a reliable new resource for in-depth studies of treatment-induced, AR-driven resistance mechanisms. Moreover, PDXOs can be leveraged for large-scale tumor-specific drug response profiling critical for accelerating therapeutic advances in CRPC.
Keywords: androgen receptor; castration-resistant prostate cancer; drug testing; organoids; patient-derived xenografts.
Conflict of interest statement
W.M.v.W. reports financial support from Bayer outside the submitted work. The remaining authors declare no potential conflict of interest.
Figures
Similar articles
-
Androgen receptor enhancer amplification in matched patient-derived xenografts of primary and castrate-resistant prostate cancer.J Pathol. 2021 Jun;254(2):121-134. doi: 10.1002/path.5652. Epub 2021 Mar 29. J Pathol. 2021. PMID: 33620092
-
Patient-derived Hormone-naive Prostate Cancer Xenograft Models Reveal Growth Factor Receptor Bound Protein 10 as an Androgen Receptor-repressed Gene Driving the Development of Castration-resistant Prostate Cancer.Eur Urol. 2018 Jun;73(6):949-960. doi: 10.1016/j.eururo.2018.02.019. Epub 2018 Mar 12. Eur Urol. 2018. PMID: 29544736
-
Androgen Receptor Signaling in Castration-Resistant Prostate Cancer Alters Hyperpolarized Pyruvate to Lactate Conversion and Lactate Levels In Vivo.Mol Imaging Biol. 2019 Feb;21(1):86-94. doi: 10.1007/s11307-018-1199-6. Mol Imaging Biol. 2019. PMID: 29748904 Free PMC article.
-
Bipolar Androgen Therapy Followed by Androgen Receptor Inhibition as Sequential Therapy for Prostate Cancer.Oncologist. 2023 Jun 2;28(6):465-473. doi: 10.1093/oncolo/oyad055. Oncologist. 2023. PMID: 37027449 Free PMC article. Review.
-
Understanding the mechanisms of androgen deprivation resistance in prostate cancer at the molecular level.Eur Urol. 2015 Mar;67(3):470-9. doi: 10.1016/j.eururo.2014.09.049. Epub 2014 Oct 8. Eur Urol. 2015. PMID: 25306226 Free PMC article. Review.
Cited by
-
Engineering prostate cancer in vitro: what does it take?Oncogene. 2023 Aug;42(32):2417-2427. doi: 10.1038/s41388-023-02776-6. Epub 2023 Jul 12. Oncogene. 2023. PMID: 37438470 Free PMC article. Review.
-
Viability Analysis and High-Content Live-Cell Imaging for Drug Testing in Prostate Cancer Xenograft-Derived Organoids.Cells. 2023 May 12;12(10):1377. doi: 10.3390/cells12101377. Cells. 2023. PMID: 37408211 Free PMC article.
-
The Role of ERα and ERβ in Castration-Resistant Prostate Cancer and Current Therapeutic Approaches.Biomedicines. 2023 Mar 9;11(3):826. doi: 10.3390/biomedicines11030826. Biomedicines. 2023. PMID: 36979805 Free PMC article. Review.
-
Biomimetic Tumour Model Systems for Pancreatic Ductal Adenocarcinoma in Relation to Photodynamic Therapy.Int J Mol Sci. 2025 Jul 2;26(13):6388. doi: 10.3390/ijms26136388. Int J Mol Sci. 2025. PMID: 40650165 Free PMC article. Review.
-
A new tumorgraft panel to accelerate precision medicine in prostate cancer.Front Oncol. 2023 May 26;13:1130048. doi: 10.3389/fonc.2023.1130048. eCollection 2023. Front Oncol. 2023. PMID: 37305585 Free PMC article.
References
-
- Annala M., Taavitsainen S., Khalaf D.J., Vandekerkhove G., Beja K., Sipola J., Warner E.W., Herberts C., Wong A., Fu S., et al. Evolution of Castration-Resistant Prostate Cancer in ctDNA during Sequential Androgen Receptor Pathway Inhibition. Clin. Cancer Res. 2021;27:4610–4623. doi: 10.1158/1078-0432.CCR-21-1625. - DOI - PubMed
-
- Sumanasuriya S., Seed G., Parr H., Christova R., Pope L., Bertan C., Bianchini D., Rescigno P., Figueiredo I., Goodall J., et al. Elucidating Prostate Cancer Behaviour during Treatment via Low-pass Whole-genome Sequencing of Circulating Tumour DNA. Eur. Urol. 2021;80:243–253. doi: 10.1016/j.eururo.2021.05.030. - DOI - PMC - PubMed
-
- van Dessel L.F., van Riet J., Smits M., Zhu Y., Hamberg P., van der Heijden M.S., Bergman A.M., van Oort I.M., de Wit R., Voest E.E., et al. The genomic landscape of metastatic castration-resistant prostate cancers reveals multiple distinct genotypes with potential clinical impact. Nat. Commun. 2019;10:5251. doi: 10.1038/s41467-019-13084-7. - DOI - PMC - PubMed
Publication types
MeSH terms
Substances
LinkOut - more resources
Full Text Sources
Research Materials
Miscellaneous
