. 2022 Nov 17;11(22):3649.
doi: 10.3390/cells11223649.

Rearing in an Enriched Environment Ameliorates the ADHD-like Behaviors of Lister Hooded Rats While Suppressing Neuronal Activities in the Medial Prefrontal Cortex

Affiliations

Rearing in an Enriched Environment Ameliorates the ADHD-like Behaviors of Lister Hooded Rats While Suppressing Neuronal Activities in the Medial Prefrontal Cortex

Ryo Utsunomiya et al. Cells. .

Abstract

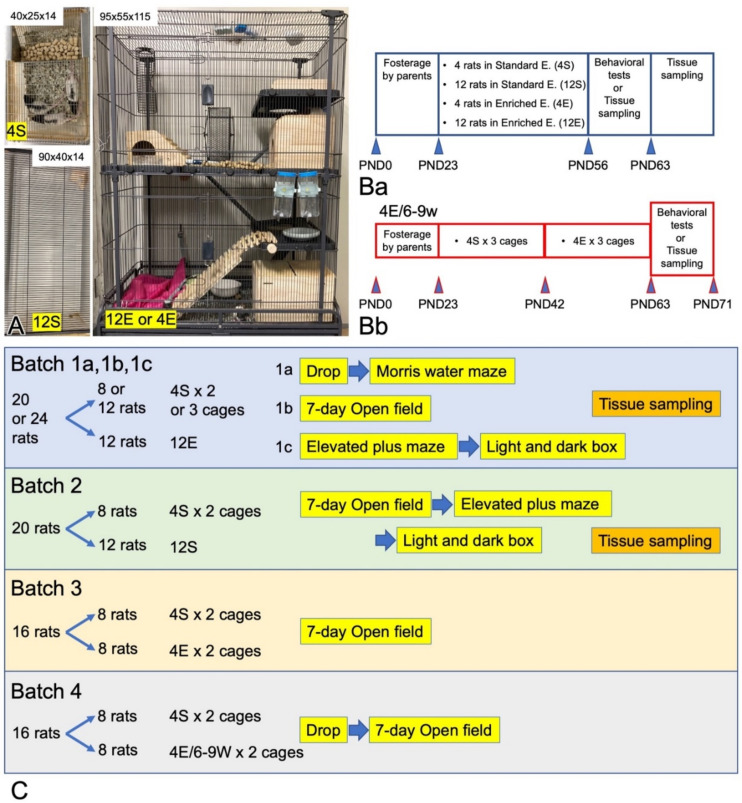
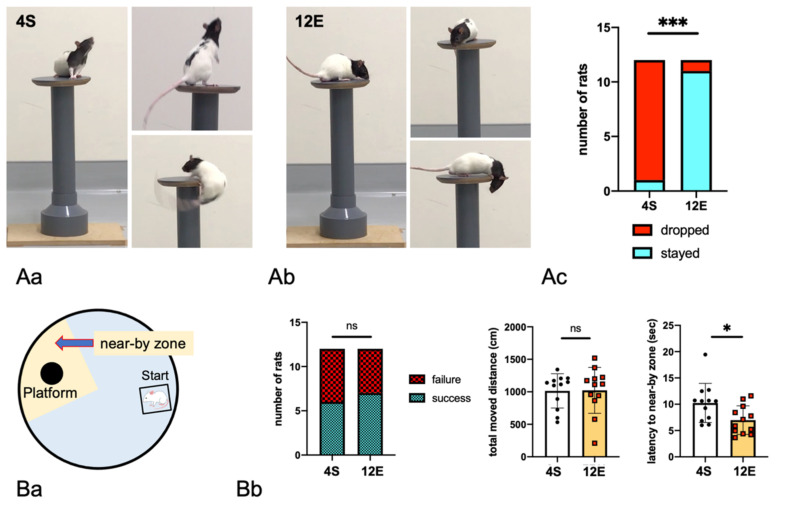
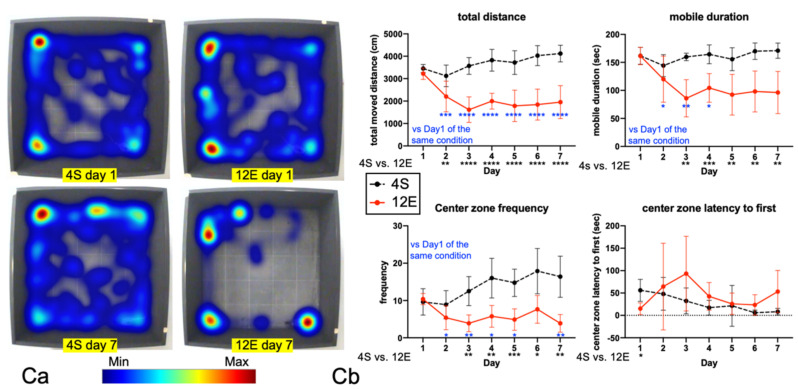
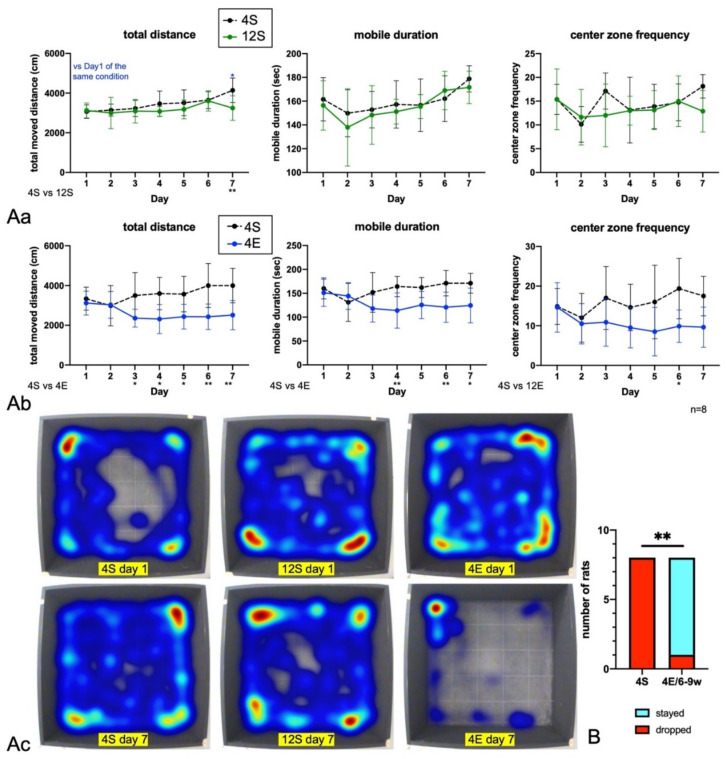
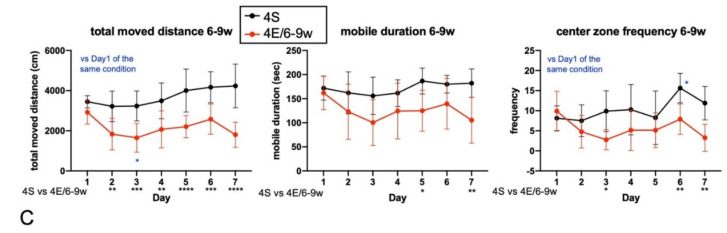
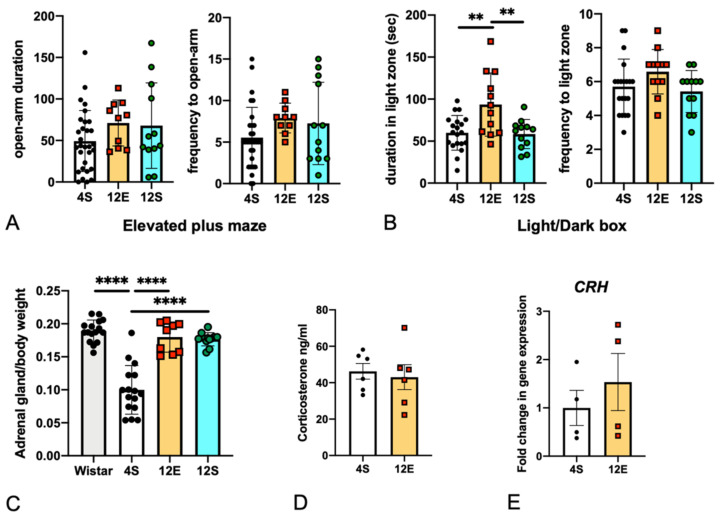
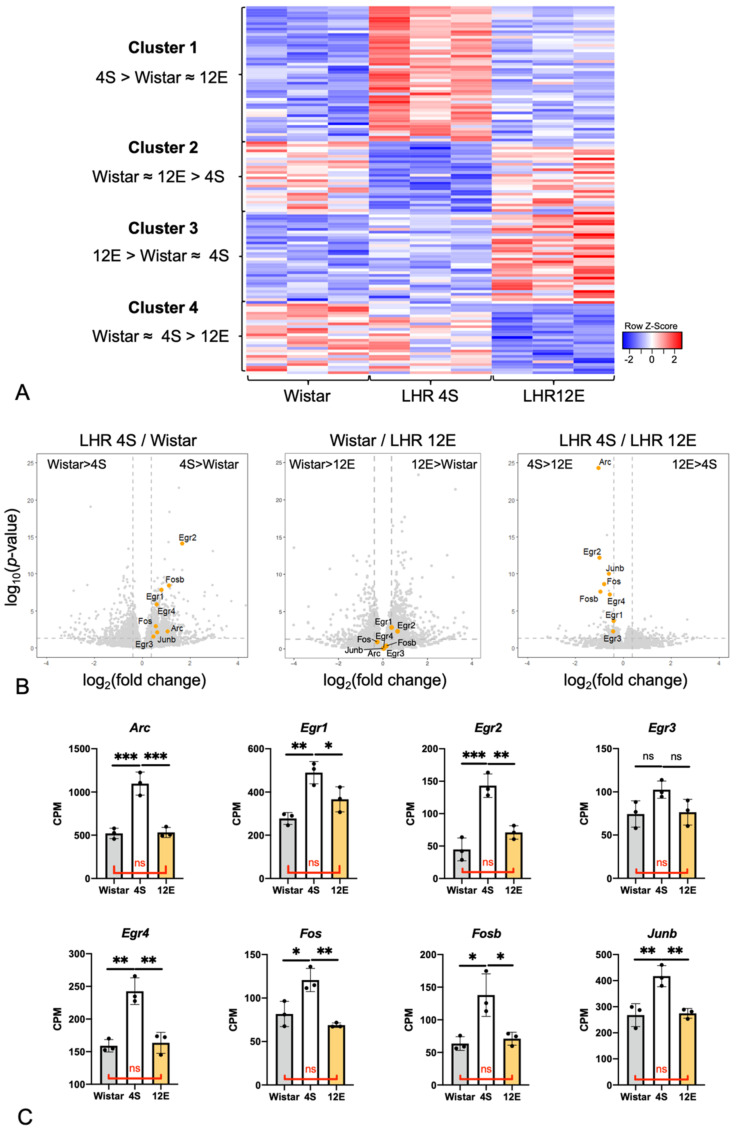
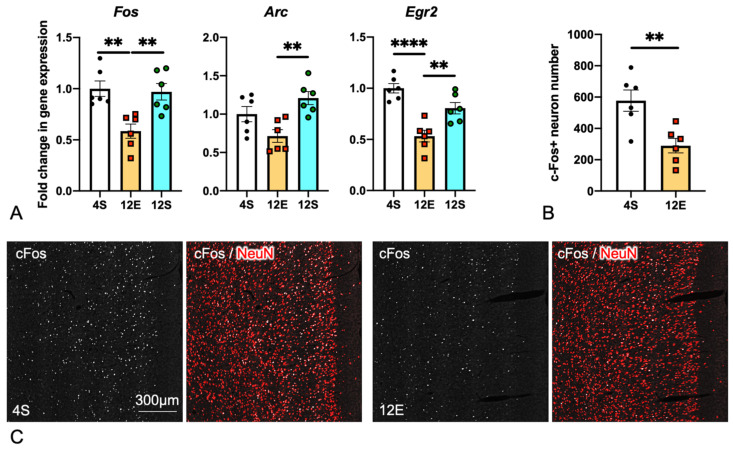
In addition to genetic factors, environmental factors play a role in the pathogenesis of attention deficit/hyperactivity disorder (ADHD). This study used Lister hooded rats (LHRs) as ADHD model animals to evaluate the effects of environmental factors. Male LHR pups were kept in four rearing conditions from postnatal day 23 (4 rats in a standard cage; 12 rats in a large flat cage; and 4 or 12 rats in an enriched environment [EE]) until 9 weeks of age. EE rearing but not rearing in a large flat cage decreased the activity of LHRs in the open field test that was conducted for 7 consecutive days. In the drop test, most rats reared in an EE remained on a disk at a height, whereas most rats reared in a standard cage fell off. RNA sequencing revealed that the immediate-early gene expression in the medial prefrontal cortex of LHRs reared in an EE was reduced. cFos-expressing neurons were reduced in number in LHRs reared in an EE. These results suggest that growing in an EE improves ADHD-like behaviors and that said improvement is due to the suppression of neuronal activity in the mPFC.

Keywords: LHR; RNAseq; cFos; enriched environment; immediate-early gene; prefrontal cortex.


Conflict of interest statement

The authors declare no competing interests.

Figures

Figure 1
Figure 1
Rearing cages for LHRs and experimental protocols. (A) Rearing conditions. LHRs were reared in one of four conditions, namely, 4S, 12S, 12E, and 4E. Under 4S, 4 LHRs were kept in a standard cage measuring 40 × 25 × 14 cm [width × depth × height]; 12S, 12 LHRs were kept in a large flat cage (90 × 40 ×14 cm); and 12E or 4E, 12 or 4 LHRs were kept in a large, tall cage (95 × 55 × 115 cm) with four stages, a running wheel, three wooden pens, and other features. (B) Rearing schedule. LHR pups were reared with their parents until PND23 and then kept in each rearing condition up to PND63 (Ba). (Bb) The pups of 4E/6-9w group were kept in a standard cage until PND42 and then reared in a large, tall cage until PND71. During the behavioral test days, the rats were kept in the same cages. (C) Four kinds of Batches of rats were prepared, reared, and subjected to behavioral tests. Two groups were formed in each batch by bisecting male littermates born from the same parents.
Figure 2
Figure 2
Behaviors of LHRs from Batch 1 reared in the 12E and 4S conditions. (A) Representative video clip images of the behaviors of 4S and 12E LHRs during a drop test. (Aa) The 4S LHRs showed frequent movement on a disk placed at a height of 40 cm and fell from the disk. Images of a 4S rat that slipped and fell backward are shown. (Ab) The 12E LHRs were much calmer than the 4S ones, and they did not fall even though they were curious about the space below. (Ac) Statistical findings on the drop test. A total of 11 of the 12 4S rats and 1 of the 12 12E rats fell. χ2 test and Fisher’s exact test. (B) An MWM test was conducted to evaluate the very short-term memory of the rats. (Ba) Settings of the arena. After the rats were trained to memorize the location of the transparent platform under the waterline, they were subjected to the MWM test for 90 s. Panel (Bb) shows the number of rats that successfully reached the platform within 90 s, their total distance moved, and their latency to the first entry into the nearby zone. Unpaired two-tailed t test, n = 12. (C) Batch 1b rats were subjected to an OF test conducted for 7 consecutive days. (Ca) Representative heatmaps displaying movement of one rat of 4S or 12E groups on days 1 and 7. All other heatmap data are shown in Supplementary Figure S1. (Cb) On the first day, significant differences in the OF test parameters between 4S and 12E rats were not observed, except for the latency to the first entry into the center zone. In the subsequent days, significant differences between the two groups, indicating that the 4S rats were more hyperactive than the 12E rats, were noted. Two-way analysis of variance (ANOVA) with Tukey’s multiple comparison test, n = 8. The single, double, triple, and quadruple asterisks in the graphs indicate statistical significance at p < 0.05, 0.01, 0.001, and 0.0001.
Figure 2
Figure 2
Behaviors of LHRs from Batch 1 reared in the 12E and 4S conditions. (A) Representative video clip images of the behaviors of 4S and 12E LHRs during a drop test. (Aa) The 4S LHRs showed frequent movement on a disk placed at a height of 40 cm and fell from the disk. Images of a 4S rat that slipped and fell backward are shown. (Ab) The 12E LHRs were much calmer than the 4S ones, and they did not fall even though they were curious about the space below. (Ac) Statistical findings on the drop test. A total of 11 of the 12 4S rats and 1 of the 12 12E rats fell. χ2 test and Fisher’s exact test. (B) An MWM test was conducted to evaluate the very short-term memory of the rats. (Ba) Settings of the arena. After the rats were trained to memorize the location of the transparent platform under the waterline, they were subjected to the MWM test for 90 s. Panel (Bb) shows the number of rats that successfully reached the platform within 90 s, their total distance moved, and their latency to the first entry into the nearby zone. Unpaired two-tailed t test, n = 12. (C) Batch 1b rats were subjected to an OF test conducted for 7 consecutive days. (Ca) Representative heatmaps displaying movement of one rat of 4S or 12E groups on days 1 and 7. All other heatmap data are shown in Supplementary Figure S1. (Cb) On the first day, significant differences in the OF test parameters between 4S and 12E rats were not observed, except for the latency to the first entry into the center zone. In the subsequent days, significant differences between the two groups, indicating that the 4S rats were more hyperactive than the 12E rats, were noted. Two-way analysis of variance (ANOVA) with Tukey’s multiple comparison test, n = 8. The single, double, triple, and quadruple asterisks in the graphs indicate statistical significance at p < 0.05, 0.01, 0.001, and 0.0001.
Figure 3
Figure 3
Day OF test data of LHRs of Batches 2, 3, and 4 (n = 8). (A) (Aa) The behaviors of the 4S and 12S LHRs were almost the same throughout the 7-day OF test. (Ab) The 4E rats were less active than the 4S ones. (Ac) Representative heatmaps of the OF test for each group. On day 7, only the 4E rats exhibited decreased activity. Two-way ANOVA with Tukey’s multiple comparison test. (B) The drop test showed that the 4E/6–9w LHRs were more attentive than the 4S control rats. χ2 test and Fisher’s exact test. (C) The 7-day OF test showed that the 4E/6–9w LHRs had a less active nature compared with the 4S rats. The results of tests were analyzed with two-way ANOVA with Tukey’s multiple comparison test. The single, double, triple, and quadruple asterisks in the graphs indicate statistical significance at p < 0.05, 0.01, 0.001, and 0.0001.
Figure 3
Figure 3
Day OF test data of LHRs of Batches 2, 3, and 4 (n = 8). (A) (Aa) The behaviors of the 4S and 12S LHRs were almost the same throughout the 7-day OF test. (Ab) The 4E rats were less active than the 4S ones. (Ac) Representative heatmaps of the OF test for each group. On day 7, only the 4E rats exhibited decreased activity. Two-way ANOVA with Tukey’s multiple comparison test. (B) The drop test showed that the 4E/6–9w LHRs were more attentive than the 4S control rats. χ2 test and Fisher’s exact test. (C) The 7-day OF test showed that the 4E/6–9w LHRs had a less active nature compared with the 4S rats. The results of tests were analyzed with two-way ANOVA with Tukey’s multiple comparison test. The single, double, triple, and quadruple asterisks in the graphs indicate statistical significance at p < 0.05, 0.01, 0.001, and 0.0001.
Figure 4
Figure 4
Behavioral test data (EPM and L/D box tests) of the 4S, 12E, and 12S rats of Batches 1 and 2, and weights of the adrenal glands, plasma corticosterone levels, CRH mRNA expression in the hypothalamus. (A) The EPM test did not produce significant results for the 4S (n = 30), 12E (n = 10), and 12S (n = 12) groups. One-way ANOVA with Tukey’s multiple comparison test. (B) L/D box test. The 12E rats (n = 12) remained longer in the light chamber than did the 4S (n = 20) and 12S (n = 12) rats. One-way ANOVA with Tukey’s multiple comparison test. (C) The adrenal gland weight (milligrams)/body weight (grams) ratio of the 4S LHRs (n = 24) was lower than the ratios of the other groups. Wistar rats (n = 10) reared in the 4S condition had larger adrenal glands compared with the 4S LHRs. The 12E (n = 9) and 12S (n = 12) LHRs had almost the same weight of adrenal glands. ANOVA with Tukey’s multiple comparison test. (D) The plasma corticosterone levels of the 4S and 12E LHRs (n = 6) were almost the same. Unpaired two-tailed t test. (E) The CRH mRNA level in the hypothalamus of 12E LHRs and the 4S ones. One-way ANOVA with Tukey’s multiple comparison test, n = 4. The double and quadruple asterisks in the graphs indicate statistical significance at p < 0.01 and 0.0001.
Figure 5
Figure 5
Gene expression in the PrL of Wistar rats, 4S LHRs, and 12E LHRs (n = 3, each) was investigated with RNAseq. (A) Hierarchical clustering of gene expression of the three groups. Cluster 1 is the one expressed more strongly by the 4S LHRs relative to the other two groups. (B) Volcano plot analysis showed stronger expression of IEGs, including Fos, Egr2, and Arc, in the 4S and 12E LHRs compared with the Wistar rats. The 12E LHRs and Wistar rats demonstrated nearly the same levels of IEG expression. (C) 4S LHRs expressed Arc, Egr1, Egr2, Egr4, Fos, Fosb, and Junb, at higher levels than Wistar rats and 12E LHRs. One-way ANOVA with Tukey’s multiple comparison test. Genes belonging to each cluster are listed in Supplementary Table S1. The single, double, and triple asterisks in the graphs indicate statistical significance at p < 0.05, 0.01, and 0.001.
Figure 6
Figure 6
Expression of Fos, Arc, and Egr2 in the mPFC of 4S (n = 12), 12E (n = 6), and 12S (n = 6) LHRs. (A) qPCR revealed that the 12E rats expressed mRNA encoding Fos, Arc, and Egr2 at weaker levels compared with the 4S and 12S rats. One-way ANOVA with Tukey’s multiple comparison test. (B) The number of cFos+/NeuN+ neurons in the mPFC was counted on immunohistochemically stained specimens of the 4S and 12E rats. Unpaired two-tailed t test. (C) Representative micrographs of the mPFC of the 4S and 12E groups stained with antibodies to cFos and NeuN. Enlarged micrographs are shown in Supplementary Figure S2. The double and quadruple asterisks in the graphs indicate statistical significance at p < 0.01 and 0.0001.

Similar articles

Cited by

References

    1. Polanczyk G.V., Salum G.A., Sugaya L.S., Caye A., Rohde L.A. Annual research review: A meta-analysis of the worldwide prevalence of mental disorders in children and adolescents. J. Child Psychol. Psychiatry. 2015;56:345–365. doi: 10.1111/jcpp.12381. - DOI - PubMed
    1. Buitelaar N.J.L., Posthumus J.A., Buitelaar J.K. ADHD in Childhood and/or Adulthood as a Risk Factor for Domestic Violence or Intimate Partner Violence: A Systematic Review. J. Atten. Disord. 2020;24:1203–1214. doi: 10.1177/1087054715587099. - DOI - PubMed
    1. Biederman J., Faraone S.V. Attention-deficit hyperactivity disorder. Lancet. 2005;366:237–248. doi: 10.1016/S0140-6736(05)66915-2. - DOI - PubMed
    1. Faraone S.V. The pharmacology of amphetamine and methylphenidate: Relevance to the neurobiology of attention-deficit/hyperactivity disorder and other psychiatric comorbidities. Neurosci. Biobehav. Rev. 2018;87:255–270. doi: 10.1016/j.neubiorev.2018.02.001. - DOI - PMC - PubMed
    1. Dark C., Homman-Ludiye J., Bryson-Richardson R.J. The role of ADHD associated genes in neurodevelopment. Dev. Biol. 2018;438:69–83. doi: 10.1016/j.ydbio.2018.03.023. - DOI - PubMed

Publication types