. 2022 Nov 8;19(22):14631.
doi: 10.3390/ijerph192214631.

Discrepancy between Food Classification Systems: Evaluation of Nutri-Score, NOVA Classification and Chilean Front-of-Package Food Warning Labels

Affiliations

Discrepancy between Food Classification Systems: Evaluation of Nutri-Score, NOVA Classification and Chilean Front-of-Package Food Warning Labels

Aranza Valenzuela et al. Int J Environ Res Public Health. .

Abstract

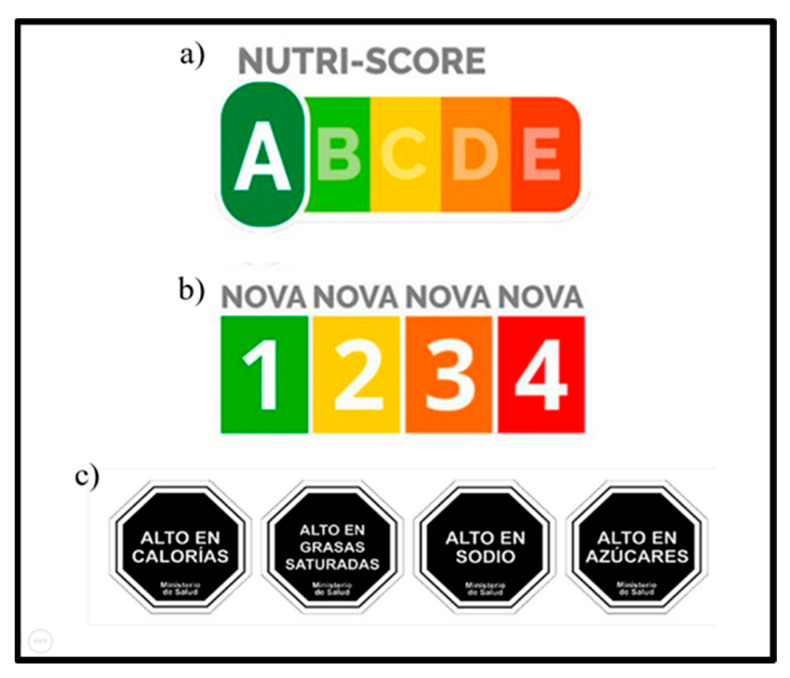
Background: Currently, there are different food classification systems in order to inform the population of the best alternatives for consumption, considering all the diseases associated with the consumption of products of low nutritional quality. Reports indicate that these forms of labelling warnings correspond to a laudable strategy for populations that do not have the knowledge to discriminate between the wide range of products offered by the food industry. However, recent publications indicate that there may be inconsistencies between the different classification guidelines, and the guidelines that nations should adopt in their food guides are still a matter of debate. In view of this, the present study aimed to evaluate the quantitative and qualitative differences that exist between the NOVA, Nutri-Score and Chilean Front-of-package (FoP) food warning label according to the Chilean basic food basket list.

Method: An analytical study was carried out to classify a list of 736 foods according to three different systems, evaluating the distributions according to their methods of classifying the products. Quantitative differences were contrasted for each system, as well as between them, together with an analysis of the dimensions of each system.

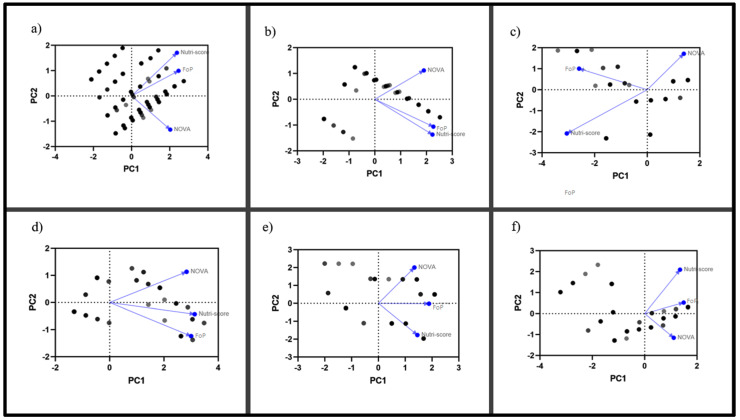
Results: According to the Nutri-Score classification, the most frequent category was A with 27% (high nutritional quality), followed by D with 22% (low nutritional quality) of the total. On the other hand, the NOVA classification showed that the most frequent categorization was ultra-processed food (NOVA 4) with 54%, followed by unprocessed (NOVA 1) with 19%. Regarding the FoP warning labels, 57% of the foods were categorized as free warning labels, followed by the category of foods with 3 warning labels (23%). Regarding the results of the principal component analysis, the Nutri-Score and FoP warning labels present a degree of similarity in their classification guidelines, being different than the dimension pointed out by NOVA.

Conclusion: The present work managed to demonstrate that there are quantitative and qualitative differences between the classification and recommendation guidelines of the Nutri-Score, NOVA and FoP warning labels, finding concrete discrepancies between them.

Keywords: food labelling; open food facts; ultra-processed foods.


Conflict of interest statement

The authors declare no conflict of interest.

Figures

Figure 1
Figure 1
The workflow of food selection. The foods evaluated were selected from the online catalogue and included according to the inclusion criteria of belonging to the Chilean basic food basket regardless of the brand of the product, and excluded because they did not have complete nutritional information, were not available according to the establishment’s stock or could not be classified by the three systems evaluated (some bulk foods such as fruits, for example, for Nutri-Score guidelines).
Figure 2
Figure 2
The food classification systems. This figure shows the classifications of each of the evaluated systems. First, (a) Nutri-Score categorises foods according to the balance of positive and negative nutritional characteristics for health, establishing the letters A and B as foods of high nutritional quality, and their counterparts D and E as products of low nutritional quality. For the (b) NOVA classification, four categories are established from number 1 to 4, basing its recommendation on the consumption of unprocessed foods (number 1) to processed foods (number 3), and suggesting the limitation or non-consumption of ultra-processed foods (number 4). Finally, (c) Chilean FoP warning labels establish their classification with cut-off points associated with critical nutrients that affect the health of the population, and precisely those foods that exceed the established limits receive a warning label that identifies them, and can be free of them or have all of them.
Figure 3
Figure 3
The distribution by different systems classification for all foods, cereals and dairy. All foods (a) are classified by Nutri-Score: A (27%), B (16%), C (18%), D (22%) and E (17%), for NOVA: 1 (19%), 2 (12%), 3 (15%) and 4 (54%), and FoP warning labels: 0 (57%), 1 (10%), 2 (9%), 3 (23%) and 4 (1%). For cereals (b), the Nutri-Score ranked: A (46%), B (7%), C (13%), D (15%) and E (19%), regarding NOVA show: 1 (25%), 2 (0%), 3 (10%) and 4 (65%), and FoP warning labels: 0 (49%), 1 (13%), 2 (7%), 3 (29%) and 4 (2%). For dairy products (c), NutriScore classified: A (11%), B (47%), C (7%), D (19%) y E (16%), for NOVA: 1 (14%), 2 (0%), 3 (31%) y 4 (55%), and for warning labels: 0 (75%), 1 (18%), 2 (6%), 3 (0%) and 4 (1%). Distribution by different systems classifications for protein foods, fats and sugars. Protein foods (meat, fish, eggs, and pulses) (d) are classified by Nutri-Score: A (60%), B (7%), C (6%), D (25%) and E (4%), for NOVA: 1 (48%), 2 (2%), 3 (25%) and 4 (25%), and for FoP warning labels as: 0 (71%), 1 (14%), 2 (6%), 3 (9%) and 4 (0%). Regarding Oils and Fats (e), ranked by Nutri.Score as: A (4%), B (5%), C (51%), D (36%) and E (4%), for NOVA: 1 (0%), 2 (64%), 3 (6%) and 4 (30%), and for FoP warning labels: 0 (50%), 1 (2%), 2 (21%), 3 (27%) and 4 (0%). Finally for Sugars and others (f), Nutri-Score stablished: A (4%), B (20%), C (18%), D (25%) and E (33%), for NOVA: 1 (6%), 2 (11%), 3 (18%) and 4 (75%), and for FoP warning labels: 0 (49%), 1 (3%), 2 (19%), 3 (38%) and 4 (0%).
Figure 3
Figure 3
The distribution by different systems classification for all foods, cereals and dairy. All foods (a) are classified by Nutri-Score: A (27%), B (16%), C (18%), D (22%) and E (17%), for NOVA: 1 (19%), 2 (12%), 3 (15%) and 4 (54%), and FoP warning labels: 0 (57%), 1 (10%), 2 (9%), 3 (23%) and 4 (1%). For cereals (b), the Nutri-Score ranked: A (46%), B (7%), C (13%), D (15%) and E (19%), regarding NOVA show: 1 (25%), 2 (0%), 3 (10%) and 4 (65%), and FoP warning labels: 0 (49%), 1 (13%), 2 (7%), 3 (29%) and 4 (2%). For dairy products (c), NutriScore classified: A (11%), B (47%), C (7%), D (19%) y E (16%), for NOVA: 1 (14%), 2 (0%), 3 (31%) y 4 (55%), and for warning labels: 0 (75%), 1 (18%), 2 (6%), 3 (0%) and 4 (1%). Distribution by different systems classifications for protein foods, fats and sugars. Protein foods (meat, fish, eggs, and pulses) (d) are classified by Nutri-Score: A (60%), B (7%), C (6%), D (25%) and E (4%), for NOVA: 1 (48%), 2 (2%), 3 (25%) and 4 (25%), and for FoP warning labels as: 0 (71%), 1 (14%), 2 (6%), 3 (9%) and 4 (0%). Regarding Oils and Fats (e), ranked by Nutri.Score as: A (4%), B (5%), C (51%), D (36%) and E (4%), for NOVA: 1 (0%), 2 (64%), 3 (6%) and 4 (30%), and for FoP warning labels: 0 (50%), 1 (2%), 2 (21%), 3 (27%) and 4 (0%). Finally for Sugars and others (f), Nutri-Score stablished: A (4%), B (20%), C (18%), D (25%) and E (33%), for NOVA: 1 (6%), 2 (11%), 3 (18%) and 4 (75%), and for FoP warning labels: 0 (49%), 1 (3%), 2 (19%), 3 (38%) and 4 (0%).
Figure 4
Figure 4
A Principal Component Analysis of each food system classification. In this figure, we proceeded to qualitatively analyse the systems assessed, identifying the dimensions targeted by a principal component analysis in (a) all foods, (b) cereals, (c) dairy, (d) protein foods, (e) lipids and fats, and (f) sugars and derivatives. This analysis establishes the ranking patterns used by NOVA, Nutri-Score and FoP warning labels, showing the closeness and remoteness between them. Black and grey boxes indicate the spatial location assigned for each input element, and blue arrows indicate the direction and dimension identified for each system.

References

    1. World Health Organization . Global Health Risks: Mortality and Burden of Disease Attributable to Selected Major Risks. World Health Organization; Genève, Switzerland: 2009. p. 70.
    1. GBD 2015 Risk Factors Collaborators Global, regional, and national comparative risk assessment of 79 behavioural, environmental and occupational, and metabolic risks or clusters of risks, 1990–2015: A systematic analysis for the Global Burden of Disease Study 2015. Lancet. 2016;388:1659–1724. doi: 10.1016/S0140-6736(16)31679-8. - DOI - PMC - PubMed
    1. Elizabeth L., Machado P., Zinöcker M., Baker P., Lawrence M. Ultra-Processed Foods and Health Outcomes: A Narrative Review. Nutrients. 2020;12:1955. doi: 10.3390/nu12071955. - DOI - PMC - PubMed
    1. Romero Ferreiro C., Martín-Arriscado Arroba C., Cancelas Navia P., Lora Pablos D., Gómez de la Cámara A. Ultra-processed food intake and all-cause mortality: DRECE cohort study. Public Health Nutr. 2021;25:1854–1863. doi: 10.1017/S1368980021003256. - DOI - PMC - PubMed
    1. Rico-Campà A., Martínez-González M.A., Alvarez-Alvarez I., de Deus Mendonça R., De La Fuente-Arrillaga C., Gómez-Donoso C., Bes-Rastrollo M. Association between consumption of ultra-processed foods and all cause mortality: SUN prospective cohort study. BMJ. 2019;365:11949. doi: 10.1136/bmj.l1949. - DOI - PMC - PubMed